
Table of Contents
Great systems are not just built. They are monitored.
MetricFire is the fully managed Graphite and Grafana platform for small teams that don’t want to self-host their monitoring stack. Pre-built dashboards, alerts, and native add-ons for Heroku, AWS, Azure, and GCP. All with dedicated support and no infrastructure to maintain.

Introduction
Behind the trends of cloud-native architectures and microservices lies a technical complexity, a paradigm shift, and a rugged learning curve. This complexity manifests itself in the design, deployment, and security, as well as everything that concerns the monitoring and observability of applications running in distributed systems like Kubernetes. Fortunately, there are tools to help developers overcome these obstacles. At the observability level, for example, tools such as Prometheus and Grafana greatly help the developers' community.
In this blog post, we will explore how to use Prometheus and Grafana with Kubernetes, how Prometheus works, and how to create custom dashboards. Then, we'll explore some concepts and discuss which metrics to watch in production and how to do so.
A quick way to start with Grafana is to sign up for the MetricFire free trial. MetricFire runs a hosted version of Graphite and Grafana, where we handle the heavy lifting, so you get more time to experiment with the right monitoring strategy.
Installation and configuration
You will need to run a Kubernetes cluster first. You can use a Minikube cluster like in one of our other tutorials or deploy a cloud-managed solution like GKE. In this article, we’ll use GKE.
We are also going to use Helm to deploy Grafana and Prometheus. If you don't know Helm, it's a Kubernetes package manager- like Debian's APT. The CNCF maintains the project in collaboration with Microsoft, Google, Bitnami, and the Helm contributor community.
With Helm, we can manage Kubernetes applications using "Helm Charts." Helm Charts define, install, and upgrade Kubernetes applications.
The Helm community develops and shares charts on Helm hub. From web servers, CI/CD tools, databases, and security tools to web apps, Helm hub hosts distributed repositories of Kubernetes-ready apps.
To install Helm, start by downloading the last version, unpack it and move "helm" binary to "/usr/local/bin/helm":
mv linux-amd64/helm /usr/local/bin/helm
MacOS users can use brew install helm; Windows users can use Chocolatey choco install Kubernetes-helm. Linux users (and MacOS users as well), can use the following script:
curl -fsSL -o get_helm.sh https://raw.githubusercontent.com/helm/helm/master/scripts/get-helm-3 chmod 700 get_helm.sh ./get_helm.sh
Using Helm, we will install the Prometheus operator in a separate namespace.
It is a good practice to run your Prometheus containers in a separate namespace, so let's create one:
kubectl create ns monitor
Then, proceed with the installation of the Prometheus operator:
Helm install Prometheus-operator stable/Prometheus-operator --namespace monitor
- “Prometheus-operator” is the name of the release. You can change this if you want.
- “stable/Prometheus-operator” is the name of the chart.
- “monitor” is the name of the namespace where we will deploy the operator.
You can verify your installation using:
kubectl get pods -n monitor
You should be able to see the Prometheus Alertmanager, Grafana, Kube-state-metrics pod, Prometheus node exporters and Prometheus pods.
NAME                                                   READY   STATUS    RESTARTS   AGE
alertmanager-prometheus-operator-alertmanager-0        2/2     Running   0          49s
prometheus-operator-grafana-5bd6cbc556-w9lds           2/2     Running   0          59s
prometheus-operator-kube-state-metrics-746dc6ccc-gk2p8 1/1     Running   0          59s
prometheus-operator-operator-7d69d686f6-wpjtd          2/2     Running   0          59s
prometheus-operator-prometheus-node-exporter-4nwbf     1/1     Running   0          59s
prometheus-operator-prometheus-node-exporter-jrw69     1/1     Running   0          59s
prometheus-operator-prometheus-node-exporter-rnqfc     1/1     Running   0          60s
prometheus-prometheus-operator-prometheus-0            3/3     Running   1          39s
Now that our pods are running, we can use the Prometheus dashboard right from our local machine. This is done by using the following command:
kubectl port-forward -n monitor prometheus-prometheus-operator-prometheus-0 9090
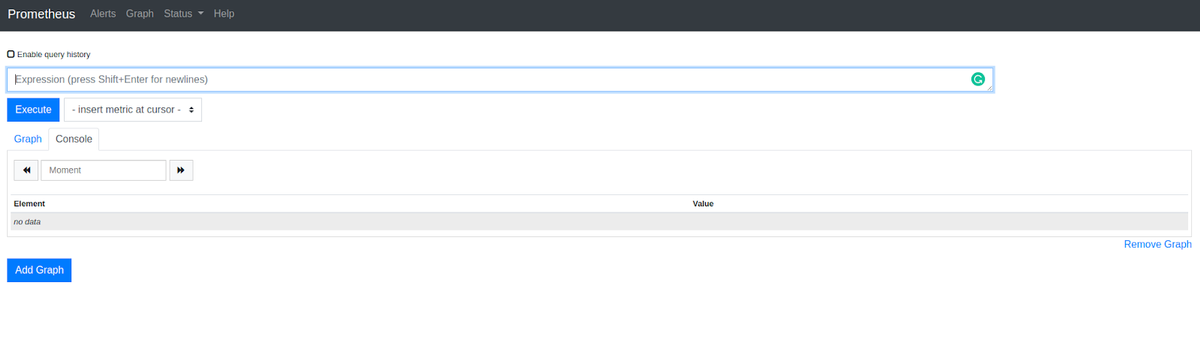
Now visit http://127.0.0.1:9090 to access the Prometheus dashboard.
Same as Prometheus, we can use this command to make the Grafana dashboard accessible:
kubectl port-forward $(kubectl get pods --selector=app=grafana -n monitor --output=jsonpath="{.items..metadata.name}") -n monitor 3000
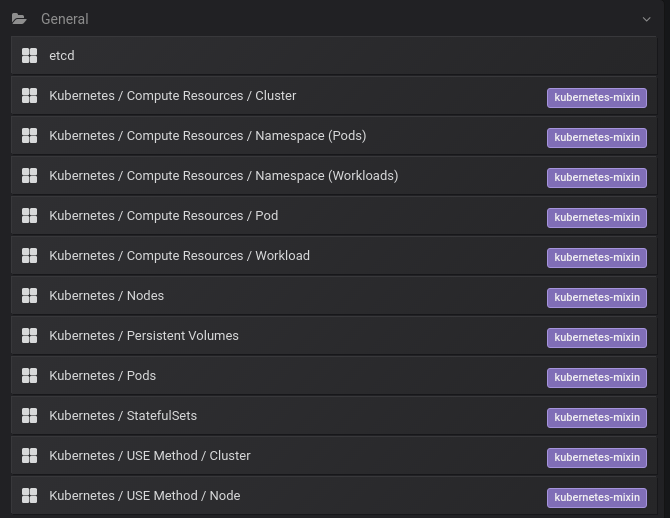
After visiting http://127.0.0.1:3000 you will be able to discover that there are some default preconfigured dashboards:
You should use "admin" as the login and "prom-operator" as the password. Both can be found in a Kubernetes Secret object:
kubectl get secret --namespace monitor grafana-credentials -o yaml
You should get a YAML description of the encoded login and password:
apiVersion: v1 data: password: cHJvbS1vcGVyYXRvcgo= user: YWRtaW4=
You need to decode the username and the password using:
echo "YWRtaW4=" | base64 --decode echo "cHJvbS1vcGVyYXRvcgo=" | base64 --decode
Using the "base64 --decode", you will be able to see the clear credentials.
Preconfigured Grafana dashboards for Kubernetes
By default, the Prometheus operator ships with a preconfigured Grafana - some dashboards are available by default, like the one below:
Some of these default dashboards are "Kubernetes / Nodes," "Kubernetes / Pods," "Kubernetes / Compute Resources / Cluster," "Kubernetes / Networking / Namespace (Pods)," and "Kubernetes / Networking / Namespace (Workload)."
If you are curious, you can find more details about these dashboards here. For example, if you want to see how the "Kubernetes / Compute Resources / Namespace (Pods)" dashboard works, you should view this ConfigMap. For more about visualizations with Grafana, check out the article on our favorite Grafana dashboards.
The metrics that are available as a result of the Helm install
To understand how Prometheus works, let's access the Prometheus dashboard. Use this port forwarding command:
kubectl port-forward -n monitor prometheus-prometheus-operator-prometheus-0 9090
Then visit "http://127.0.0.1:9090/metrics".
You will be able to see a long list of metrics.
Prometheus uses PromQL (Prometheus Query Language), a functional query language that lets users select and aggregate time series data in real-time. PromQL can be complicated, especially if you learn it comprehensively. Still, you can start with these examples from the official documentation, and you will be able to understand a good part of it. For more information about PromQL, check out our great article that illustrates 10 key examples of PromQL.
When we deployed Prometheus using Helm, we used this chart, and it actually deployed not just Prometheus but also:
- Prometheus-operator
- Prometheus
- alertmanager
- node-exporter
- kube-state-metrics
- grafana
- service monitors to scrape internal Kubernetes components
- kube-apiserver
- kube-scheduler
- kube-controller-manager
- etcd
- kube-dns/coredns
- kube-proxy
So, in addition to Prometheus, we included tools like the service monitors that scrape internal system metrics and other tools like "kube-state-metrics".
kube-state-metrics will also export information that the Prometheus server can read. We can see a list of these metrics by visiting "http://127.0.0.1:8080/metrics" after running:
kubectl port-forward -n monitor prometheus-operator-kube-state-metrics-xxxx-xxx 8080
Important metrics to watch in production
Now that we have Prometheus set up as a Datasource for Grafana - what metrics should we watch, and how do we watch them?
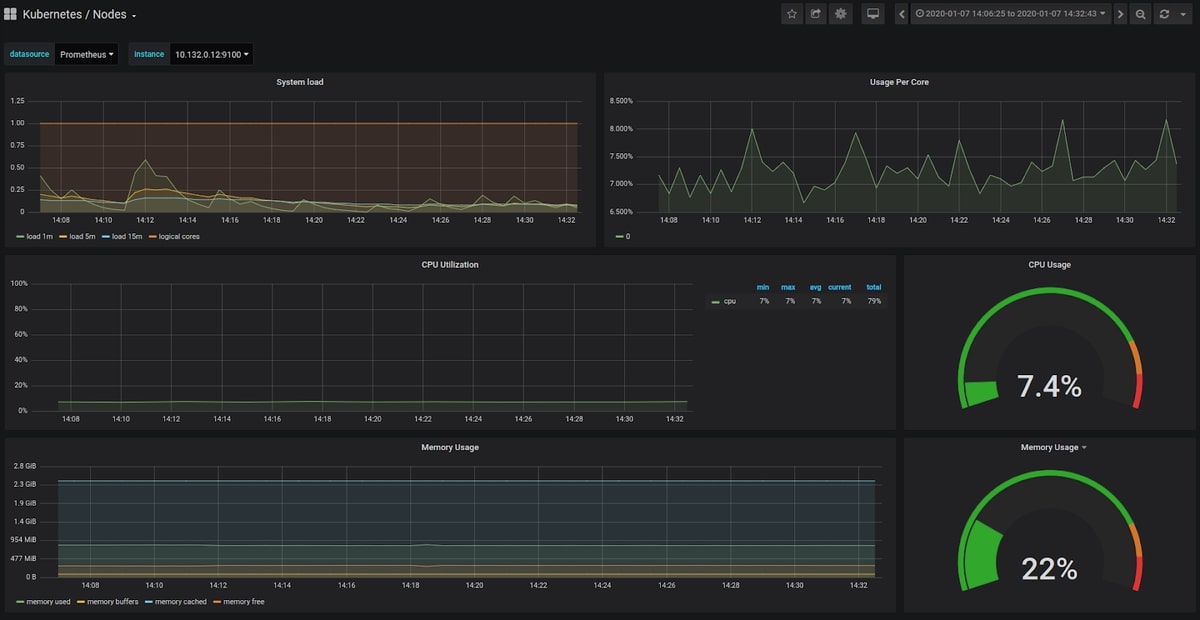
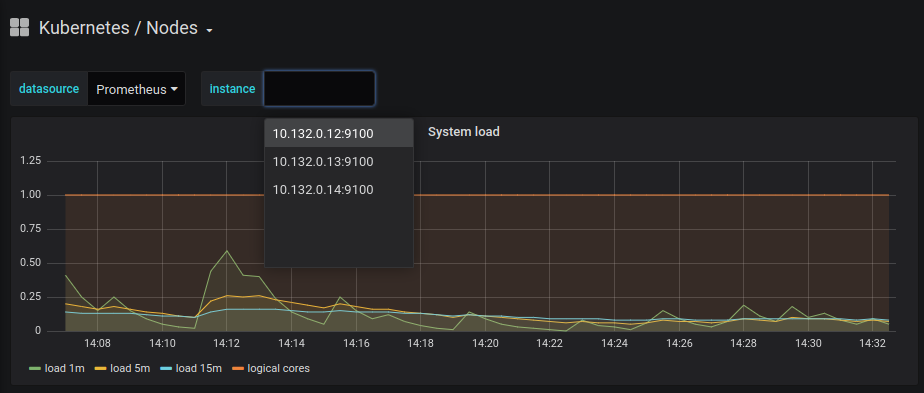
A large selection of default dashboards is available in Grafana. Default dashboard names are self-explanatory, so if you want to see metrics about your cluster nodes, you should use "Kubernetes / Nodes". The dashboard below is a default dashboard:

Unless you use minikube or one of its alternatives, a Kubernetes cluster usually runs more than one node. You must make sure that you are monitoring all of your nodes by selecting them one at a time:
It is possible to add your dashboards using a similar ConfigMap manifest or directly using the Grafana dashboard interface. You can see below the “create dashboard” UI:
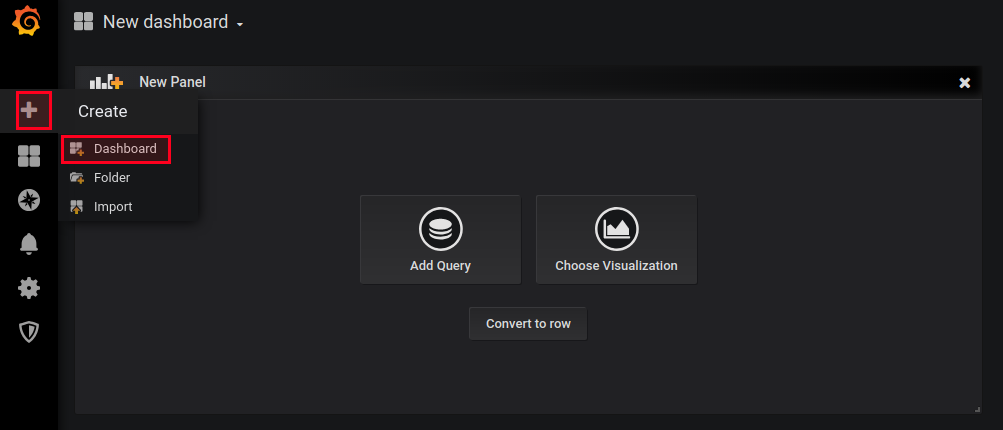
When creating a new custom dashboard, you will be asked whether you want to add a query or use visualization. If you choose visualization, you will be asked to choose a type of graph and a data source. We can choose Prometheus as our data source and add a query using Prometheus as a data source.
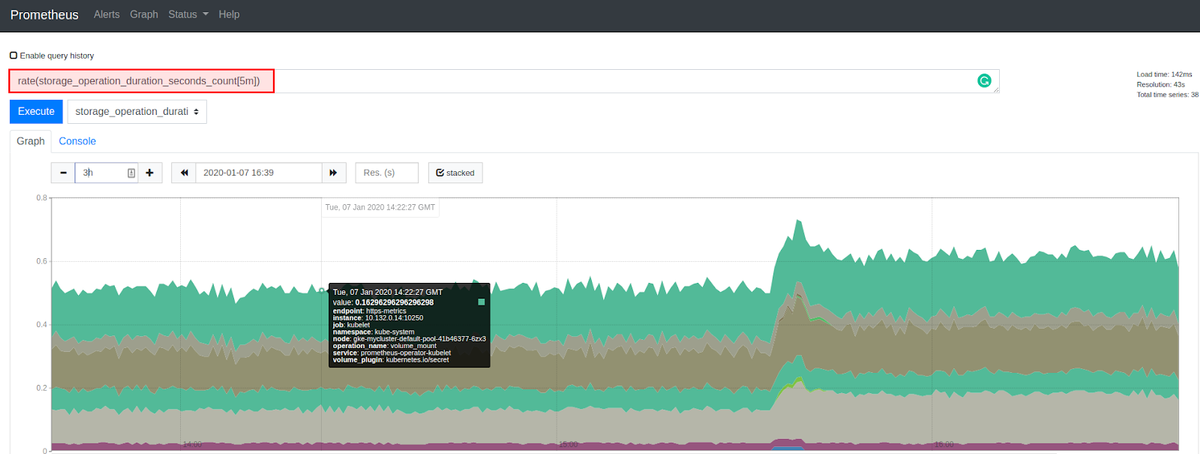
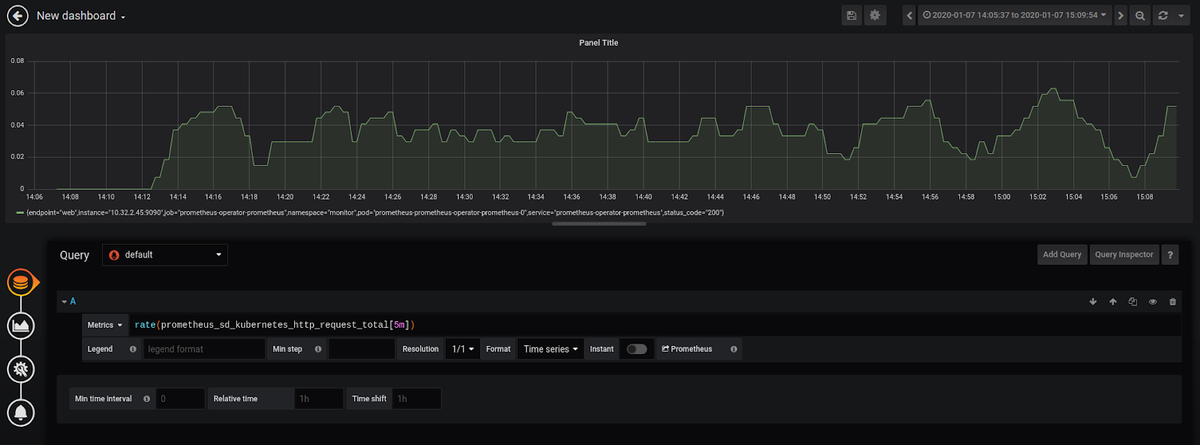
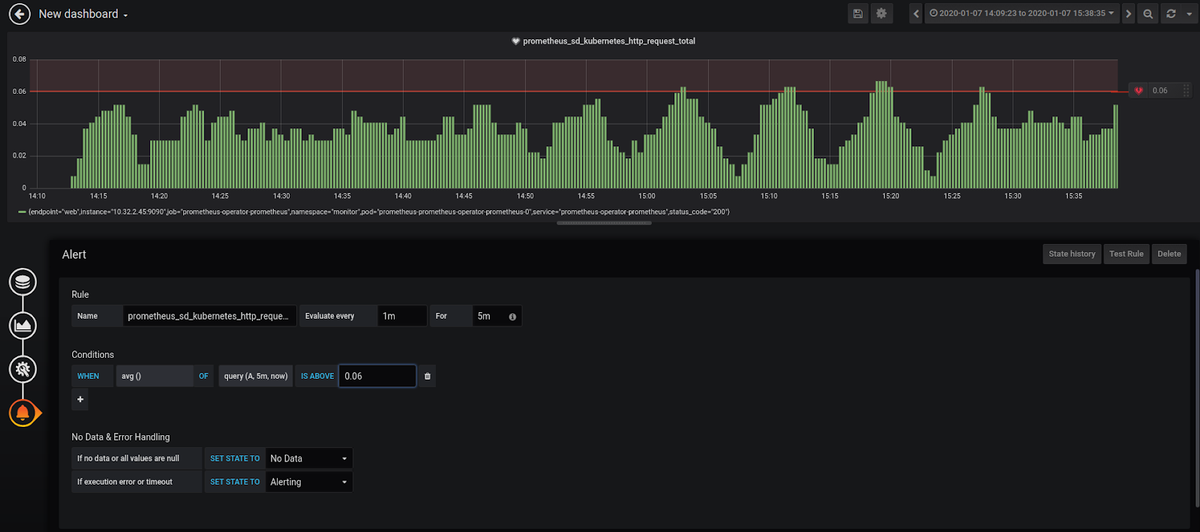
For example, we can set up a graph to monitor the prometheus_sd_kubernetes_http_request_total metric, which gives us information about the number of HTTP requests to the Kubernetes API made by an endpoint.
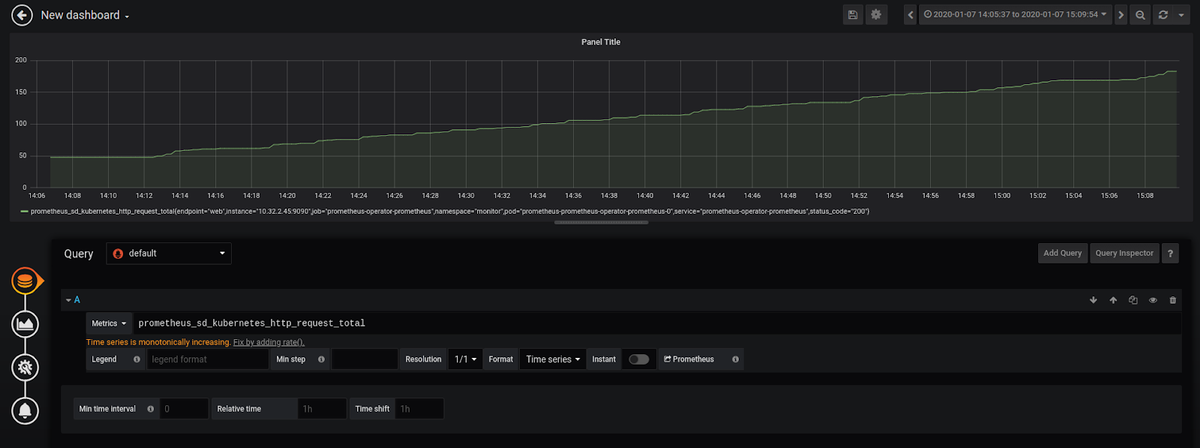
Since this metric is cumulative, Grafana asked us if we would rather use the function rate(), which gives us better information about our metric.
After setting up the name of the visualization, you can set alerts. Let's say that the average of the metric we chose should not exceed "0.06":
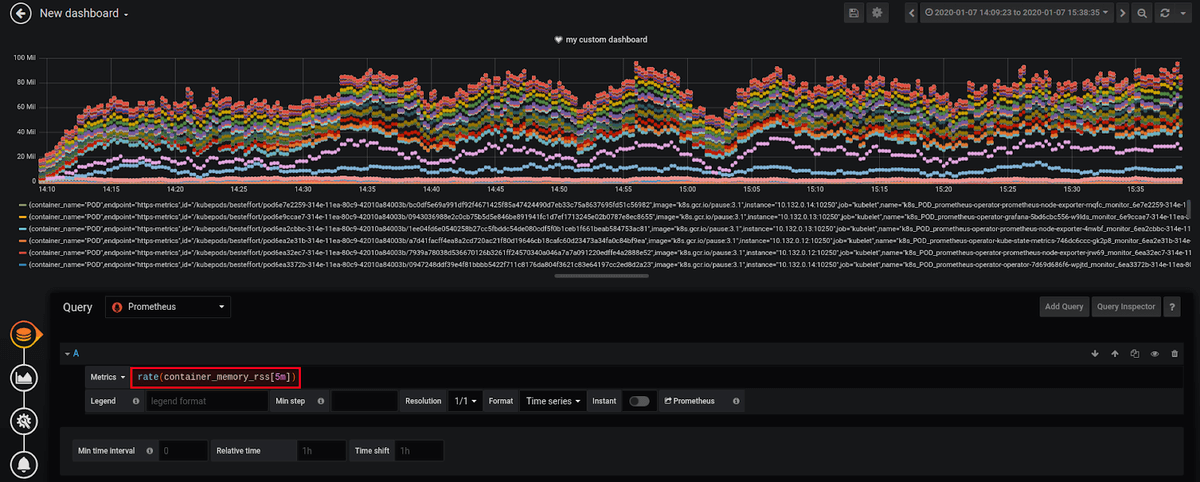
Let's choose a more significant metric, like the Resident Set Size (RSS) of Kubernetes system containers (RSS is the portion of memory occupied by a process that is held in main memory (RAM)). See the dashboard below:
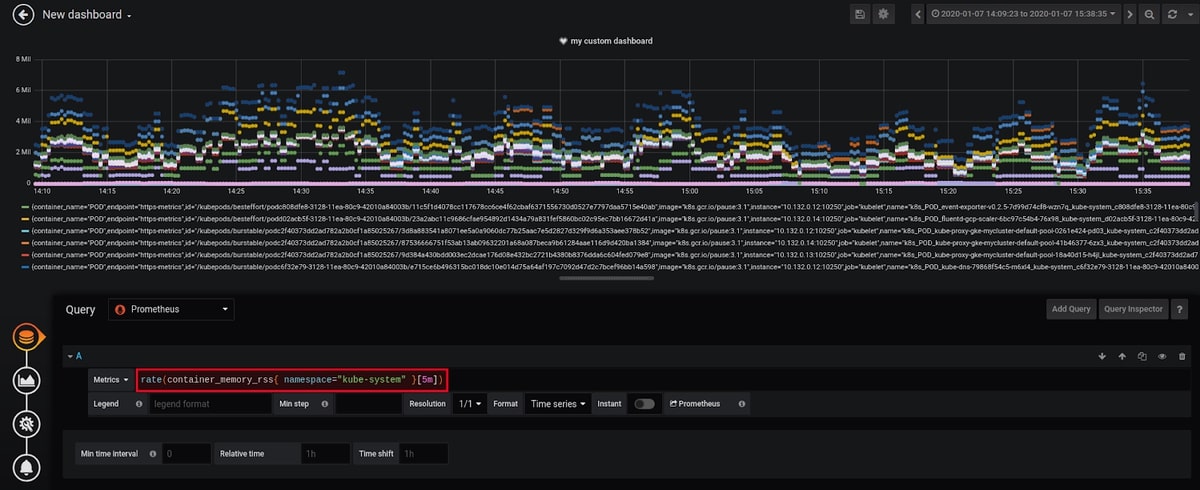
Sometimes, some views are overpopulated, and in our example, since we want to monitor the system containers, we can refine our dashboard by filtering by namespace:
Let's try a third important metric to watch, like the total number of container restarts. You can access this information using kube_pod_container_status_restarts_total or kube_pod_container_status_restarts_total{namespace="<namespace>"} for a specific namespace.
There are many other important metrics to watch in production. Some are common and related to Nodes, Pods, Kube API, CPU, memory, storage and resource usage. These are some examples:
- kube_node_status_capacity_cpu_cores : describes nodes CPU capacity
- kube_node_status_capacity_memory_bytes : describes nodes memory capacity
- kubelet_running_container_count : returns the number of currently running containers
- cloudprovider_*_api_request_errors : returns the cloud provider API request errors (GKE, AKS, EKS, etc.)
- cloudprovider_*_api_request_duration_seconds: returns the request duration of the cloud provider API call in seconds
In addition to the default metrics, our Prometheus instance is scraping data from kube-apiserver, kube-scheduler, kube-controller-manager, etcd, kube-dns/coredns, and kube-proxy, as well as all the metrics exported by "kube-state-metrics". The amount of data we can get is huge, and that's not necessarily good.
The list is long, but the important metrics can vary from one context to another. You may consider that Etcd metrics are not important for your production environment.
However, some abstractions and observability good practices like Google Golden Signals or the USE method, can help us to choose what metrics we should watch.
Setting up Kubernetes Monitoring using MetricFire
The setup we have done above works for very basic Kubernetes infrastructure, which would contain just a few nodes. In order to handle the production-level load, which would be a few hundred nodes and upwards of a few Mbps network traffic, you would need to scale out both Graphite and Grafana to handle the increasing load.
That’s where Hosted Graphite and Hosted Grafana come into the picture. They allow you to scale for long-term storage and provide redundant data storage without having to go through the arduous process of setting up Graphite and Grafana, as detailed above.
Hosted Graphite and Hosted Grafana through MetricFire allow for the continuous active deployment of new features, as MetricFire’s products all have their foundations in the ever-growing open-source projects. Configuring the Snap Daemon to send Kubernetes metrics to your MetricFire account is simple. It just requires configuring your account's API key to be used as the prefix for each metric and the URL Endpoint to be used as the server destination. Check out our article Monitoring Kubernetes with Hosted Graphite to learn how to set up monitoring your Kubernetes infrastructure quickly and easily using our Hosted service.
Sign up for the MetricFire free trial here, and start building Kubernetes dashboards within a few minutes.
Book a demo and talk to us directly if you want to know how MetricFire can help with your monitoring needs. Don’t forget you can use our 14-day free trial and create your own Dashboards within a few minutes of signing up.

