

Table of Contents
Great systems are not just built. They are monitored.
MetricFire runs Graphite and Grafana as a fully managed service for growing engineering teams, taking care of storage, scaling, and version updates so your team doesn't have to. Plans start at $19/month, billed per metric namespace rather than per host, and include engineer-staffed support. Integrations work natively with Heroku, AWS, Azure, and GCP, and data is stored with 3× redundancy in SOC2- and ISO:27001-certified data centres.

This article will focus on the popular monitoring tool Prometheus, and how to use PromQL. Prometheus uses Golang and allows simultaneous monitoring of many services and systems. In order to enable better monitoring of these multi-component systems, Prometheus has strong built-in data storage and tagging functionalities. To use PromQL to query these metrics you need to understand the architecture of data storage in Prometheus, and how the metric naming and tagging works.
This article will go through the principles of Prometheus and the data storage architecture, and then outline 10 examples of how to use PromQL. The examples will be routed in the theory laid out at the beginning.
Try out what you learn in this article on the MetricFire free trial. We have a Hosted alternative service, where you can start sending data and practice querying right away.
Key Takeaways
- Prometheus is a popular monitoring tool that uses Golang and allows simultaneous monitoring of multiple services and systems.
- To effectively use PromQL to query Prometheus metrics, you need to understand Prometheus's data storage architecture, metric naming, and tagging.
- Metrics are structured with Metric Names, Labels, and Values, allowing for flexible data representation and filtering.
- Prometheus can be installed on various platforms using package managers, binary source files, or Docker containers.
- PromQL is a language for querying and extracting data from Prometheus, supporting instant vectors and range vectors.
Prometheus Principles
Prometheus can be thought of as a set of tools for the following data operations:
- storage
- aggregations
- visualization
- alerts
The advantage of Prometheus is that it provides functionality to control many systems and servers from just one place. Prometheus achieves this with a decentralized and self-managed architecture. At the same time, individual commands can be used for individual servers.
If we compare it with the existing databases, we can say that Prometheus is a time-series database with the option of adding a variety of tools that extend the functionality to monitoring and data analysis.
Let's discuss the general structure of the Prometheus architecture to better understand the principles behind how it functions.
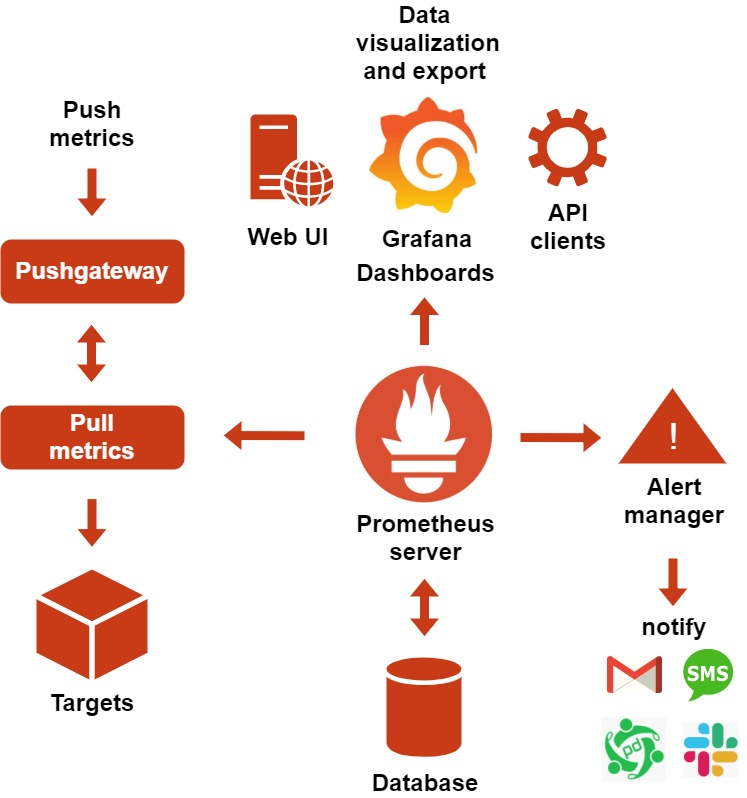
Prometheus includes these components:
- Prometheus server is a server that processes the data requests (metrics) and stores them in a database.
- Targets (exporters) – systems or services where the monitoring process is performed. In most cases, they periodically send data to the server. They export data in a format that will be understandable to the Prometheus server.
- Pushgateway is a component that processes metrics for short term jobs.
- Dashboard – metrics visualization using a native web interface or Grafana.
- Client Libraries – to connect different programming languages and data export tools.
- Alertmanager – the manager for sending notifications.
The core of this architecture is the Prometheus server, which processes data independently and stores it locally or on the selected resource. It scrapes objects to receive the essential information needed for the metrics. As a result, we need to configure the monitoring process only on the Prometheus side instead of the individual systems. This approach simplifies the deployment of the monitoring system: all you need to do is install the server and define the monitoring parameters.
Metrics collection is implemented with pull and push mechanisms. In the second case, it uses a special pushgateway component, which is necessary to export (collect) metrics from protected systems or if the connection process needs to take place in a short time. Prometheus provides a ready-to-use collection of exporters for different technologies.
Next, the native query language PromQL allows us to select the required information from the received data set and perform analysis and visualizations with that data using Grafana dashboards. The Alertmanager generates notifications from this data and sends them to us using methods such as e-mail, PagerDuty, and more.
Prometheus Data Concepts
Data representation in Prometheus depends on two factors: the model of data representation and the metrics type. To understand the processes of monitoring and correct programming of PromQL commands, we'll briefly review these two factors and their application in Prometheus.
Let's start with the Prometheus metrics. Their calculation and processing is an important and essential stage of monitoring. In general, metrics are numerical indicators that describe the state of a monitored object. A simple example of metrics for monitoring a remote server would be resource monitoring, such as the processor, memory, disk, network, etc. Similarly, it is possible to monitor web resource statistics such as visitor numbers, server response time, or key requests.
Let's take a look at the different kinds of Prometheus Metrics:
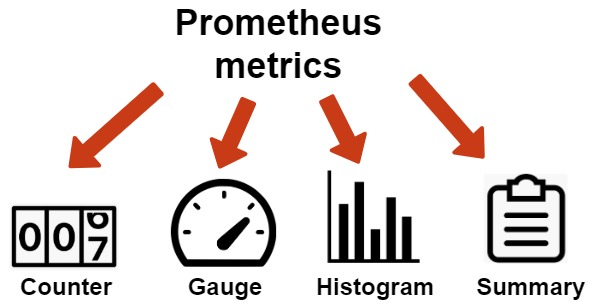
- Counter – accepts and stores only those values that will increase with time.
- Gauge – stores the values that can take different values, that can both increase and decrease.
- Histogram – samples observations (usually things like request durations or response sizes) and counts them in configurable buckets. It also provides a sum of all observed values, allowing you to calculate averages.
- Summary – histogram with a more detailed data representation using additional statistics (quantiles).
An important requirement for the proper and accurate display of metrics is the selection of the corresponding data type. For example, Gauge does not always correctly show the evolution of the metrics over the period. For this purpose, you should use the Histogram metrics. The choice between Histogram and Summary comes down to the data presentation needs: either for a time period or a continuous evolution in time.
Now let's proceed to Prometheus’s metrics structuring system. Each metric has a Metric Name, which should express the aspect of the system that’s being measured. Optionally, we can also assign a Label to each metric. Adding a Label creates a subset of time series within the larger group defined by the Metric Name. Each Metric Name and label is paired with a Value, where the Value is the actual numerical data point sent from the system. Metric Names, Labels, and Values are stored as a set, and we use this information to query the time-series info.
- The metric name describes the system feature that we will measure
- The label stores the numeric value of the metric
- The value is the numerical data point sent from the feature we’re monitoring
Below we will present this model as a chart.

So, we can configure the model with greater flexibility by using Labels and filtering the data. Filtering is the process of choosing which Labels you want to include in your query. Generally, this allows for fast and simple data aggregation in Prometheus.
More detailed information about Prometheus is available in the official documentation.
Installation and Configuration Aspects
Prometheus' architecture allows us to integrate it into almost any platform quite simply. The basic installation procedure consists of deploying the Prometheus server, configuring exporters, and configuring client libraries. Find out more about Prometheus setup and installation in our articles Deploying Prometheus to Kubernetes, and Prometheus 101.
For a brief overview, we’ll take a look at the most important points in this section. The Prometheus components have ready-to-compile binary files and require only internal program dependencies and libc support. Therefore, the Prometheus monitoring system will run on almost any platform: on different server systems, as well as on user computers with Linux or even Windows.
There are three installation methods:
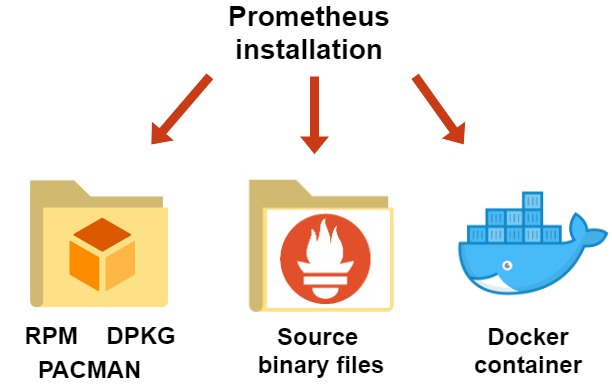
- with a package manager (only for Linux)
- using binary source files from the official website (for all available platforms)
- deploying the installed system in the Docker container
The first method is the simplest - find the package, and start the installation. However, we should remember that Linux repositories often contain not the latest software versions. The second way is the most complicated from the user's side, but it allows us to customize all the components of the monitoring system. The method using Docker containers is convenient at the stage of deployment on a remote server or some cloud platform.
After the installation procedure, we need to configure Prometheus by defining the options in the prometheus.yml file. The main settings are presented below:
- scrape interval – time interval for scrapping
- evaluation interval – a time interval to compare with rules
- scrape configs – define and set monitoring targets
- rule files – path to monitoring rules
The specific values of these parameters depend on the purpose and targets of the monitoring. In this article, we will use Prometheus to monitor local computer resources on Windows. Next, let's choose a source binary file that matches the system requirements and run Prometheus with version 2.15.2.
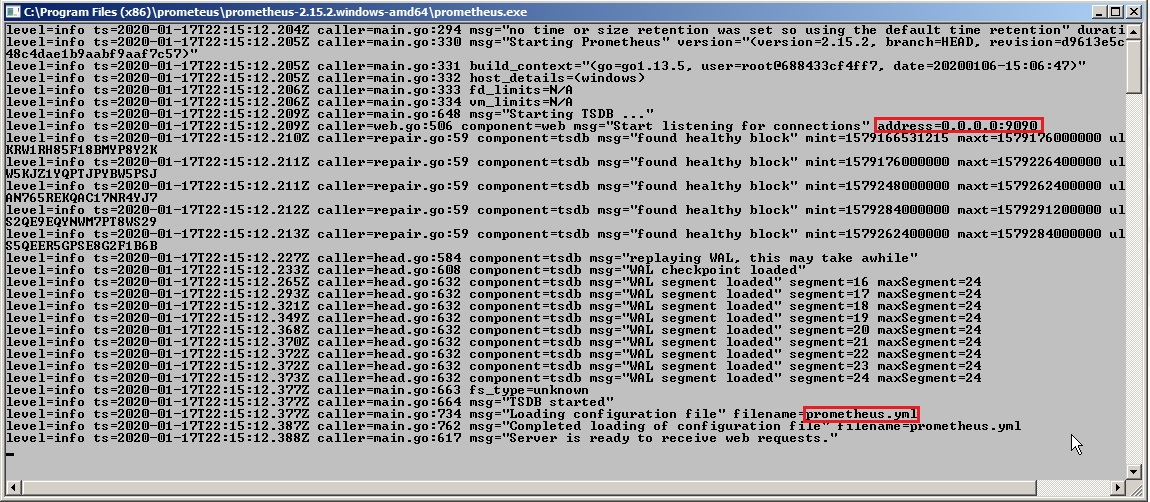
The terminal provided us with logs for the successful running of the monitoring system, along with the address (in this case, the local host) and access port to the Prometheus server web interface. Then we will use the browser to monitor the local system.
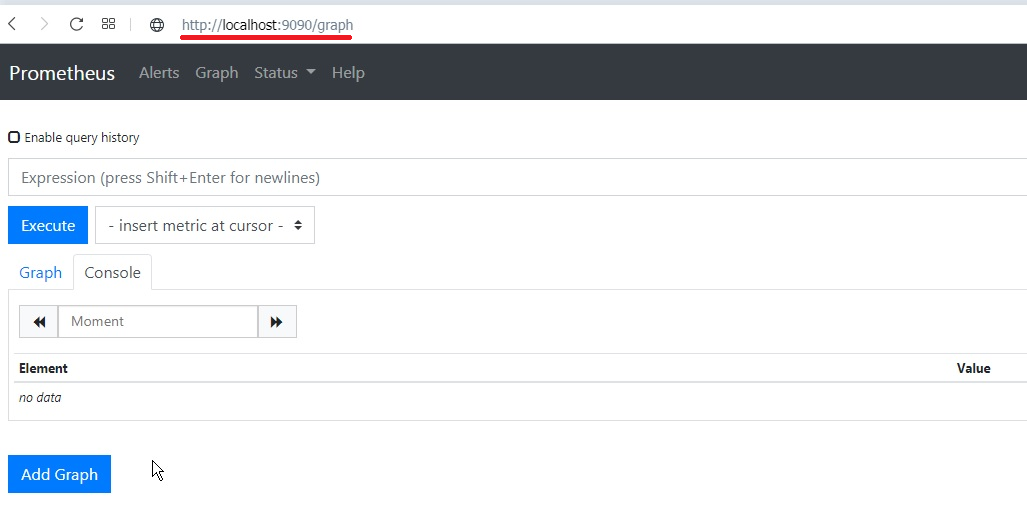
The Web interface provides access to the local Prometheus server and the associated parameters and monitoring options. It allows us to see the connected modules and the overall status of the server.
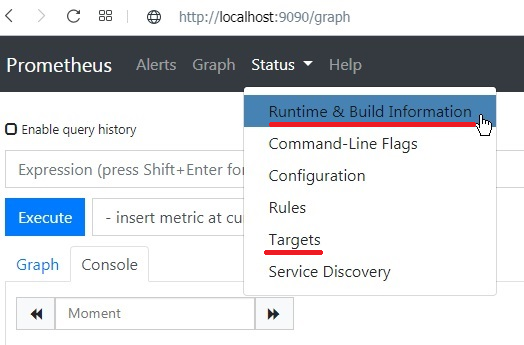
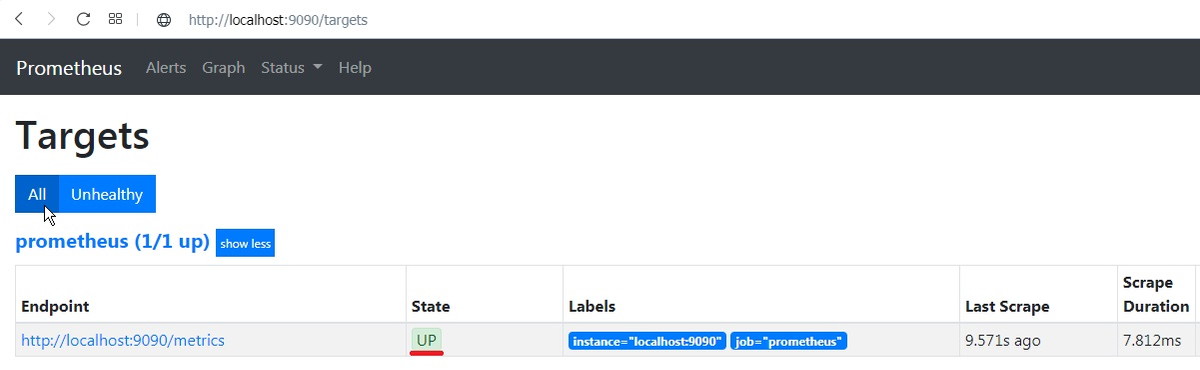
Also, this interface supports using predefined metrics and custom queries with PromQL.
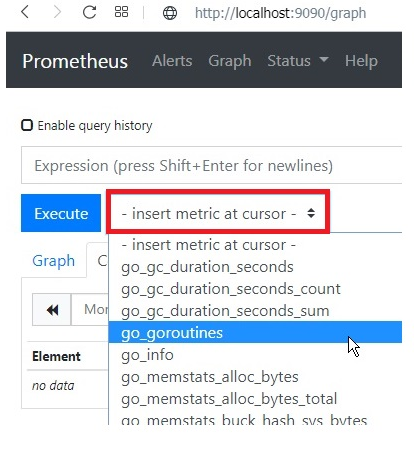
Let's explore how to write PromQL queries below.
Prometheus Querying with PromQL
PromQL is a language for creating queries and extracting or filtering data from the Prometheus server. It uses the Prometheus data representation model in the form of "Key&Value" and returns the results as vectors.
Prometheus can return vectors of two types:
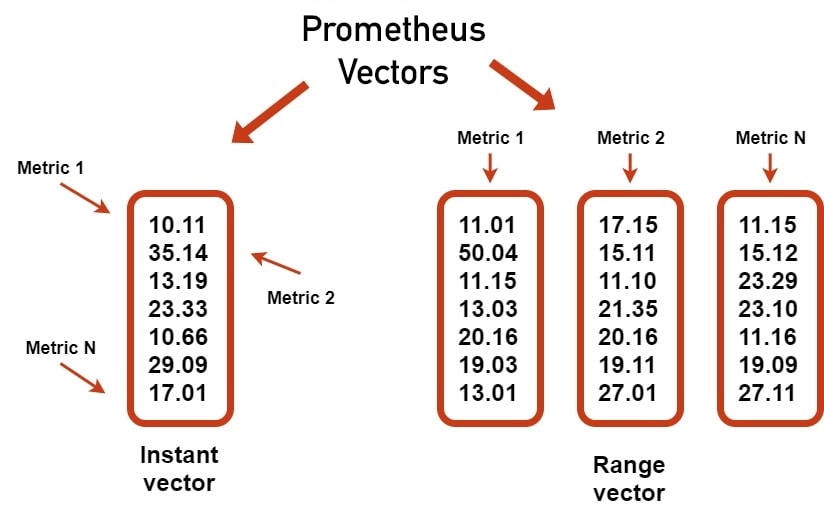
- Instant vectors – output of the requested values of all metrics from within the last time interval.
- Range vectors – represent values of several metrics as a set of vectors that is calculated for the selected period of time.
Choosing which type of vector to use depends on the metric you are requesting and the result you are looking for. Once you have requested to see the metric, the value of these vectors appears as graphics in the built-in web interface. We'll demonstrate this with ten simple examples of such requests.
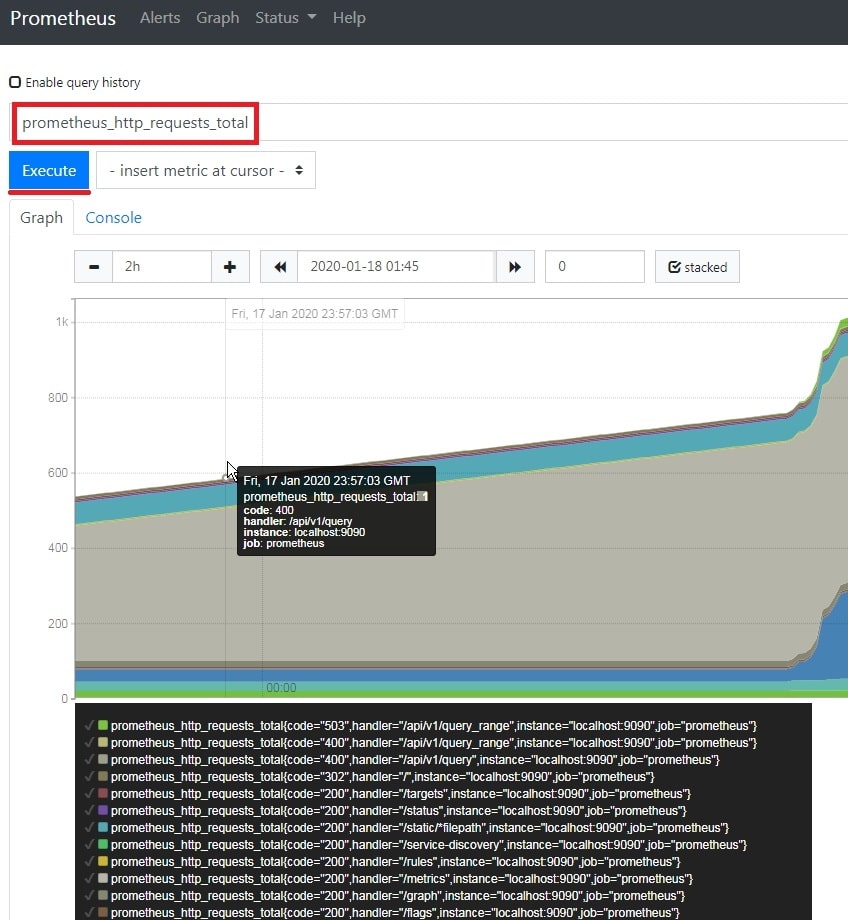
1. Let’s show the value of the all-time time series with the counter metric prometheus_http_requests_total. This will show us all of the data denoted by this metric name, or “key”.
2. Now, let’s take a look at the same metric as in example 1, but add some labels. Let’s add the values for the labels “job” and “code”.
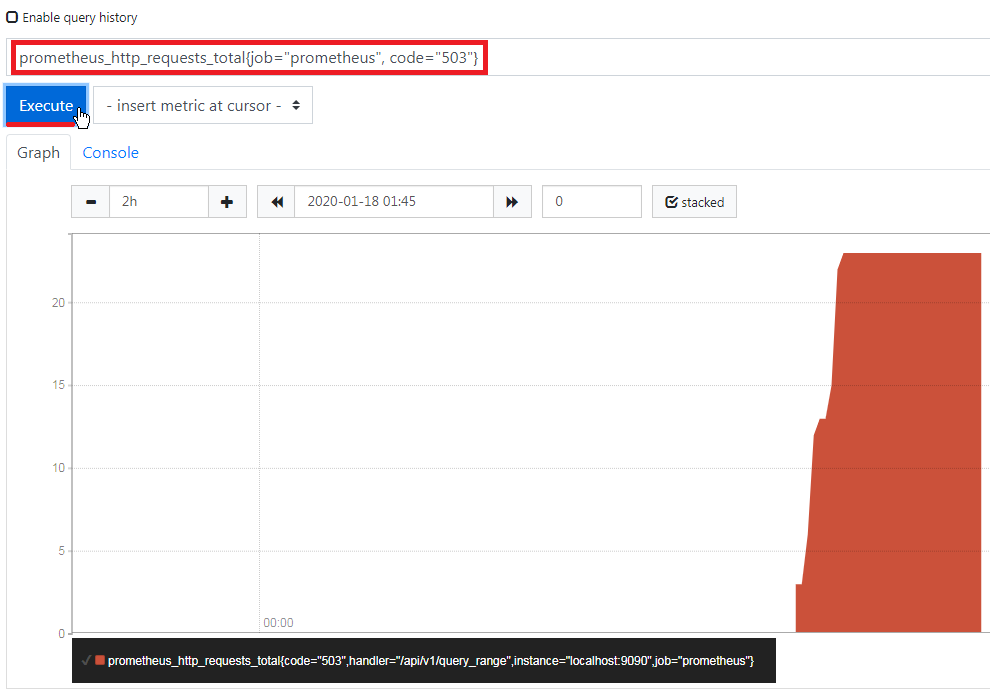
The result of this query is a chart or dashboard. We can also filter the essential data by using the time and date criteria on the graph interface.
3. Let’s take a look at the metric from example 1 again, but let’s add the time interval component. In the example below, we add the interval component by writing [15m] at the end of the query. The result will be displayed on the console tab in the web interface, and not on the graph tab. You will see the result as a list of values.
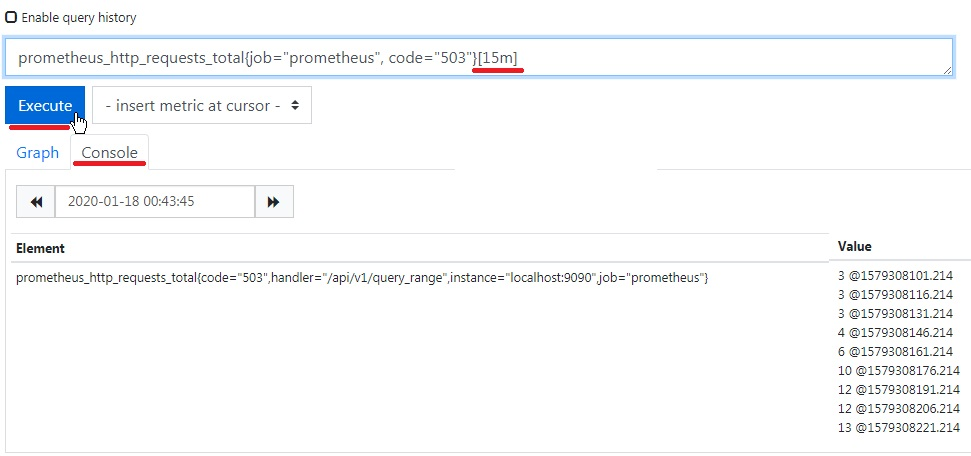
Note that a chart cannot be drawn because the vectors have multiple values for each timestamp.
4. To build complex filters, we will use regular expressions for Go – RE2 syntax. Let's create a filter for a histogram metric that will exclude all "/alerts" values for "handler" field and for "le" fields that starts with "In" symbols.
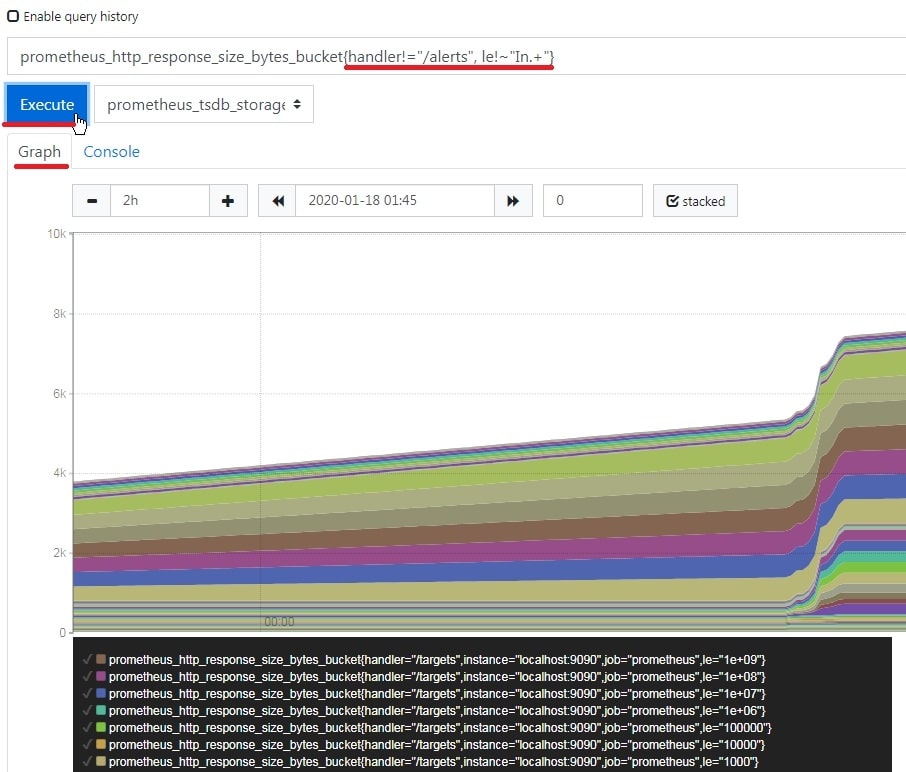
The result of the query execution is a dashboard that excludes filtered values of the specified metrics. In this way, we can exclude unnecessary data from the visualizations.
5. We can make even more complex queries by using other filtering rules. In the following example, we filter by an instance name, and also for two specific values of “code”. We want to see only instances named “Localhost:9090”, that have “code” equal to either 503 or 400.
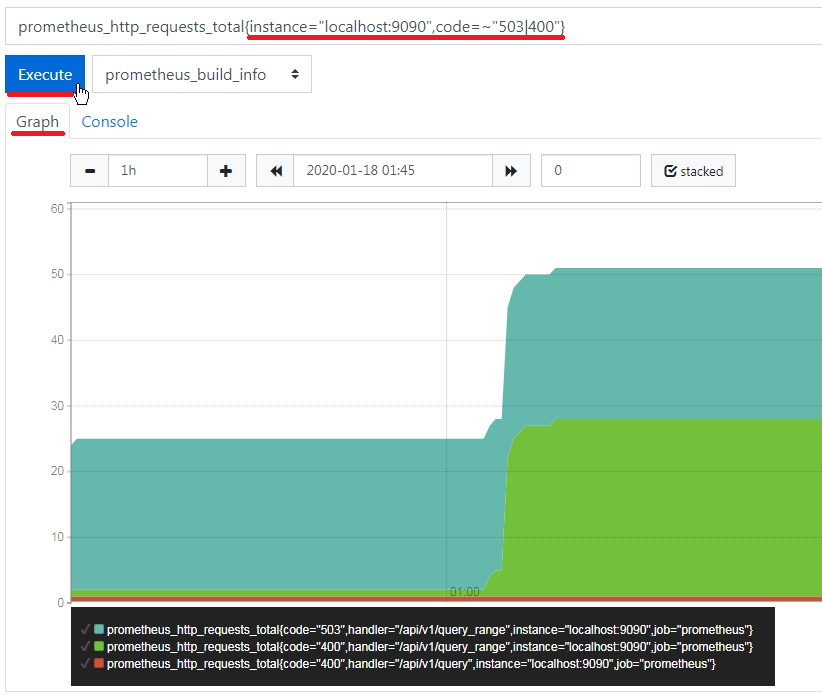
Note that when we query for two values of “code” it will automatically visualize for both the "and" and "or" logical functions.
6. The PromQL query function also allows you to create filters that combine different metrics using their names. Let's demonstrate it for histogram and counter metrics with similar names.
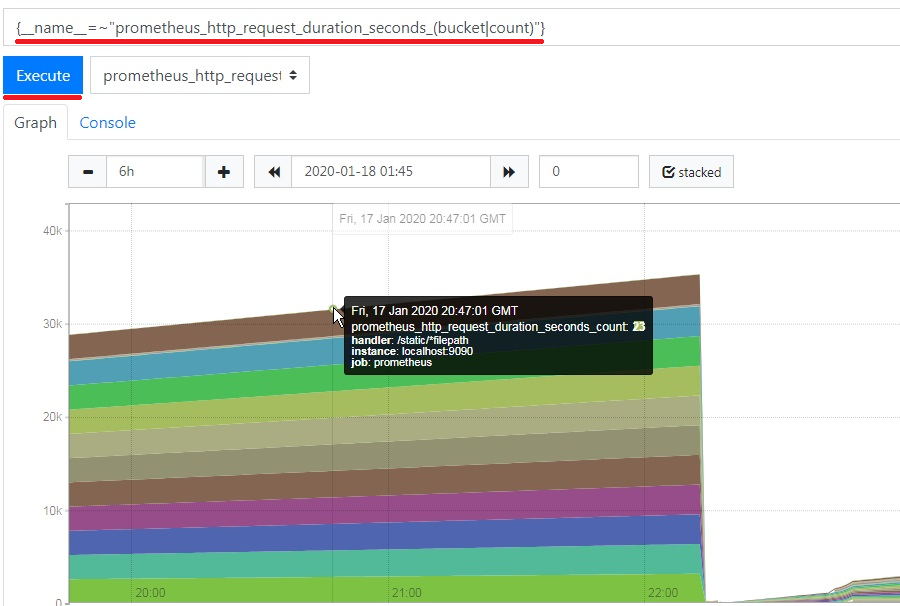
This approach allows for simple metrics value aggregation with similar names.
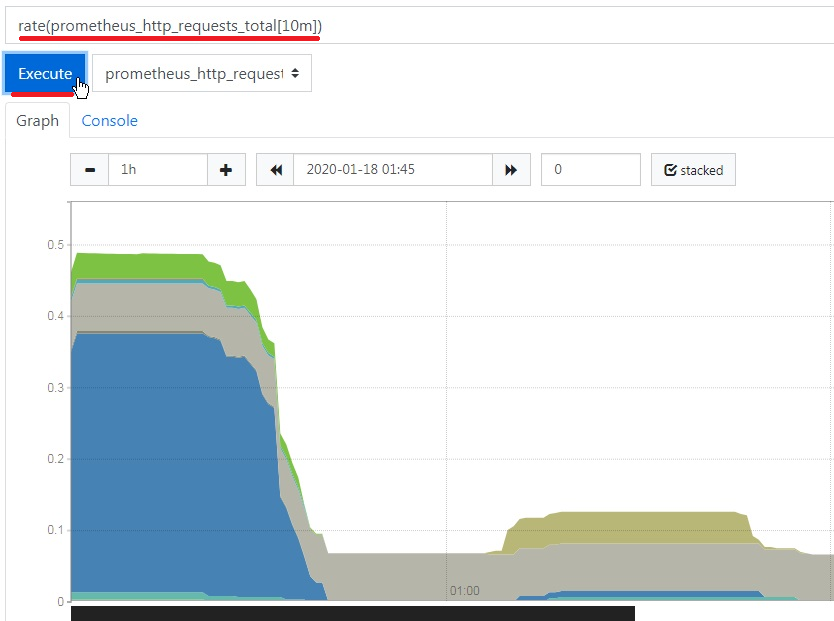
7. Usually, calculation functions are required for detailed analysis. One of them is the rate function that calculates the per-second rate for time series. Take a look at our article on Prometheus rate() for more detailed information. Let's build a rate() query for the counter metric from example 1, with a [10m] time value. The [10m] time value indicates the span of time over which the per-second rate is calculated for each point on the graph.
8. PromQL operates with basic comparison, logic, and arithmetic operations. Let's explore them below.
Comparison and Logical operations:
- greater (>)
- greater-or-equal (>=)
- less (<)
- less-or-equal (<=)
- equal (==)
- not equal (!=)
- and (intersection)
- or (union)
- unless (compliment)
Arithmetic operations:
- addition (+)
- subtraction (-)
- division (/)
- multiplication (*)
- power (^)
- modulo (%)
This functionality provides the basic calculations for additional data analysis. As an example, they can be used to convert measurement units to the required format. Next, we demonstrate how to convert virtual memory size data recorded in bytes into megabytes for a gauge metric.
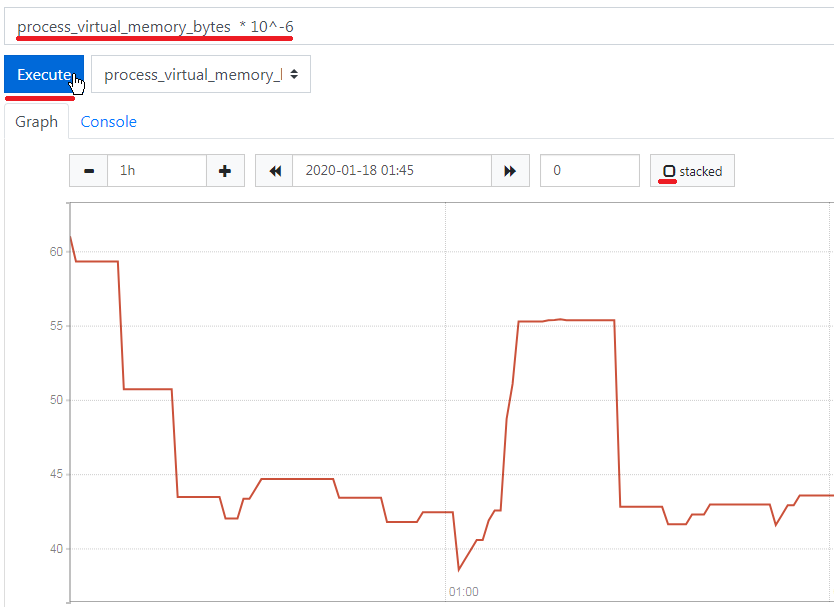
The arithmetic operations can be performed with time series, and these operations will be possible only for the corresponding values of these series.
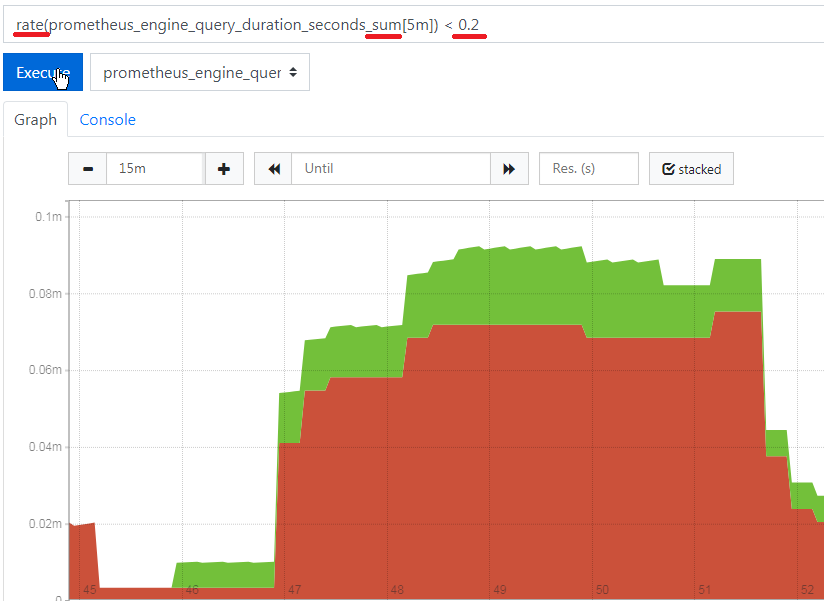
We will also show an example for comparison operations with summary metrics and limiting parameters to some limits.
9. Frequently, in the case of many labels, it is necessary to correctly group and aggregate them. PromQL has built-in functionality for this issue. Let's demonstrate it using the same metric and rate() calculation as in the previous example.
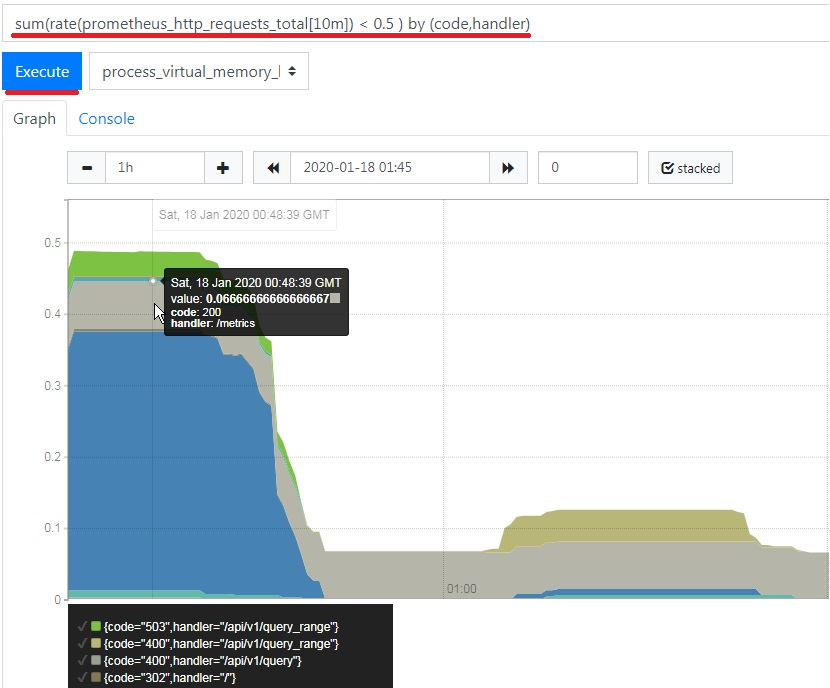
As we can see, the resulting data is sorted by the corresponding categories in the query. Such functionality will be useful in preparing the monitoring data for further analysis.
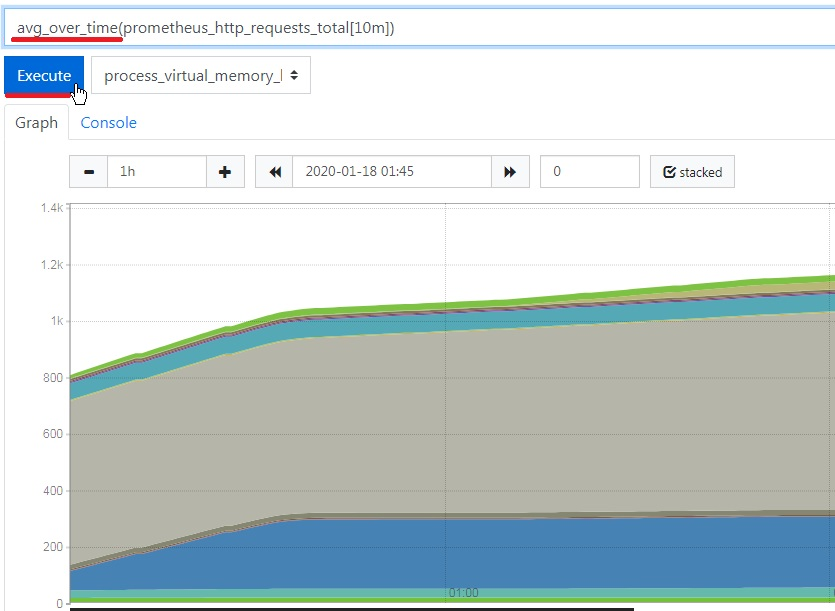
10. Usually, if we work with gauge-type metrics, we will need to limit, scale, or convert the metric values. To implement this type of query, we should use the <aggregation>_over_time PromQL functionality. As a demonstration, we will use it to calculate the statistical data for the average number of requests per defined time range.
We've shown only a small part of the PromQL functionality to demonstrate the flexible customization of queries with the Prometheus monitoring system. The full list and description of PromQL functionality are available on the official website.
Conclusion
This article introduces the basic functionality of the Prometheus monitoring system, with a focus on PromQL. We have discussed the basic principles and features of its operation, which can help you use it for your tasks in the future. We have also demonstrated the features and capabilities of building queries with PromQL.
If you’re interested in trying out our Hosted Graphite service, try out our free trial. And if you’re interested in how MetricFire can help you with your monitoring needs, talk to us directly by booking a demo.


