
Table of Contents
Great systems are not just built. They are monitored.
MetricFire runs Graphite and Grafana as a fully managed service for growing engineering teams, taking care of storage, scaling, and version updates so your team doesn't have to. Plans start at $19/month, billed per metric namespace rather than per host, and include engineer-staffed support. Integrations work natively with Heroku, AWS, Azure, and GCP, and data is stored with 3× redundancy in SOC2- and ISO:27001-certified data centres.

What is Prometheus?
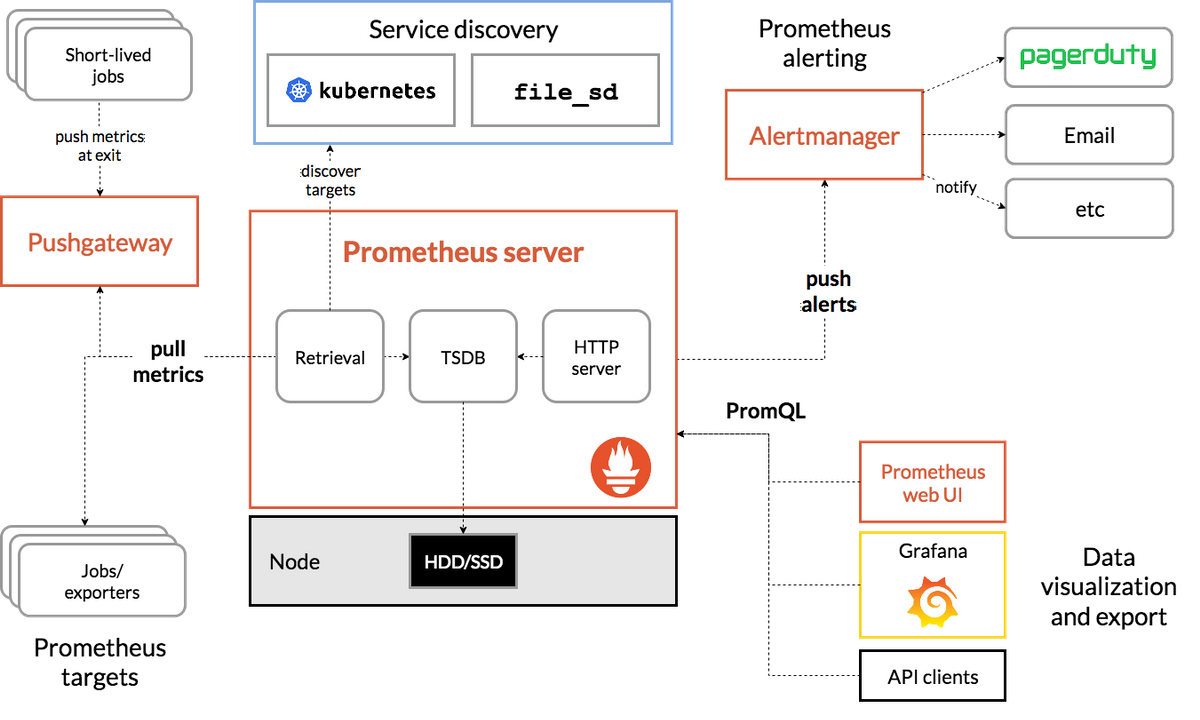
Prometheus is an open-source monitoring system built around a time series database, able to receive data and store it, in addition to supporting queries, graphs, and in-built alerting. Connecting to target endpoints to request metrics via HTTP, Prometheus provides a multi-dimensional data model wherein metrics can be defined by names and/or tags that identify them as part of a unique time series. Open-source Prometheus metrics have a default retention of 15 days, though with Hosted Graphite by MetricFire, our Prometheus alternative data can be stored for up to 2 years. The Prometheus query language (PromQL) can then be used to explore metrics and draw simple graphs. For teams looking to integrate monitoring data with other enterprise systems, Integrate.io provides a low-code data integration platform that can connect your metrics pipeline with databases, data warehouses, and other critical infrastructure without requiring heavy engineering.
Get our free trial and start using our Prometheus alternative in minutes. You can see if Graphite is the right fit for you. If you have any questions, you can always book a demo and talk to us directly.
What is CloudWatch?
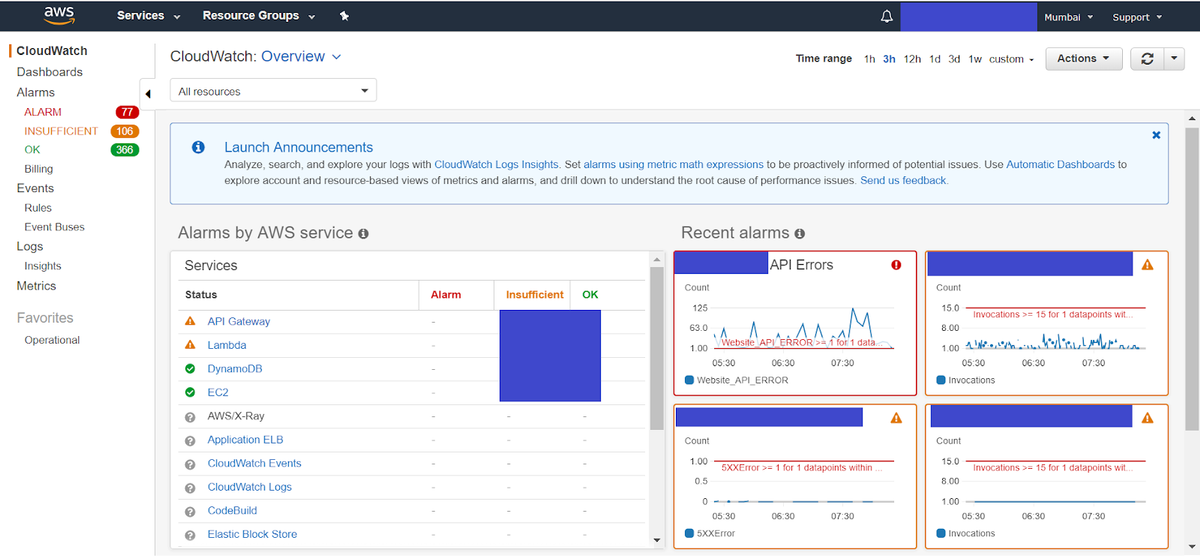
CloudWatch is an AWS service for monitoring and managing infrastructure systems or application performance. The resources can be on AWS, on-premises, or a combination of both. The application performance data and the infrastructure monitoring information can be simultaneously displayed on the same dashboard, as either logs or metrics. CloudWatch does everything from collecting metrics and logs to monitoring, alerting, and analyzing. CloudWatch has both the Alarms and Events functions, which notify you in the case where specific conditions are realized. CloudWatch charges on a pay-per-metric basis, where the cost of processing large amounts of metrics can grow substantially higher than competing monitoring solutions.
When to use CloudWatch?
Use CloudWatch when you …
- are already using other AWS services and need to monitor them, such as Lambda.
- are a larger company that can benefit from premium services that cover a lot of different areas.
- do not need a broad variety of visualization tools.
Pricing comparison
- Prometheus is open-source and free.
- Business-ready Prometheus as a Service by MetricFire, including Hosted Graphite AND Grafana, starts at 99 USD a month.
- CloudWatch is proprietary and starts with a free tier.
- For large amounts of metrics, CloudWatch grows to be substantially more expensive than competitors.
Key takeaways
- Prometheus can provide a dimensional data model where metrics are identified by a metric name and tags with built-in storage, graphing, and alerting.
- Prometheus is open-source and free.
- AWS CloudWatch is an excellent service that comes at a price.
Get to know our Hosted Graphite better, and check out how MetricFire can fit into your monitoring environment! Get a free trial and start using Graphite now. Feel free to book a demo if you have questions about what Hosted Graphite can do for you.


