
Table of Contents
Great systems are not just built. They are monitored.
MetricFire runs Graphite and Grafana as a fully managed service for growing engineering teams, taking care of storage, scaling, and version updates so your team doesn't have to. Plans start at $19/month, billed per metric namespace rather than per host, and include engineer-staffed support. Integrations work natively with Heroku, AWS, Azure, and GCP, and data is stored with 3× redundancy in SOC2- and ISO:27001-certified data centres.
Introduction
When it comes to visualization tools, there are various options, all designed for different kinds of data. Some of the most recognized among them include Grafana and Tableau. If you’re not sure which one to use, this article should give you a better idea of what kind of purpose each one has and which one will suit your needs best.
One great way to find out what tool works best for you is to try it out! Try out Grafana in seconds on MetricFire's Hosted Grafana free trial.
Key Takeaways
-
Grafana and Tableau are both tools for data visualization and analysis, but they have different purposes and strengths.
-
Grafana is open-source software that is designed for visualizing time-series data and has powerful integrations with Graphite. It is well-suited for monitoring logs and offers native support for a variety of different sources, such as Elasticsearch, InfluxDB, MySQL, and PostgreSQL.
-
Tableau is a tool used for data visualization and analysis performed in the business analytics field. It can pull data from any source, blend it, and allow you to make further transformations in order to prepare your data for visualization.
-
The Tableau ecosystem includes several tools such as Tableau Public, Tableau Desktop (Personal and Professional), Tableau Online, and Tableau Server, each with its own purpose and usage scenario.
-
Both Grafana and Tableau have great visualization abilities and support the most widely used visualization techniques, such as bar charts, line charts, histograms, heat maps, pie charts, and scatter plots.
What is Grafana and what is Tableau?
Both Grafana and Tableau are tools that can help you perform data visualization and analytics. But they are not so similar. Let’s have a closer look at both of them.
Grafana
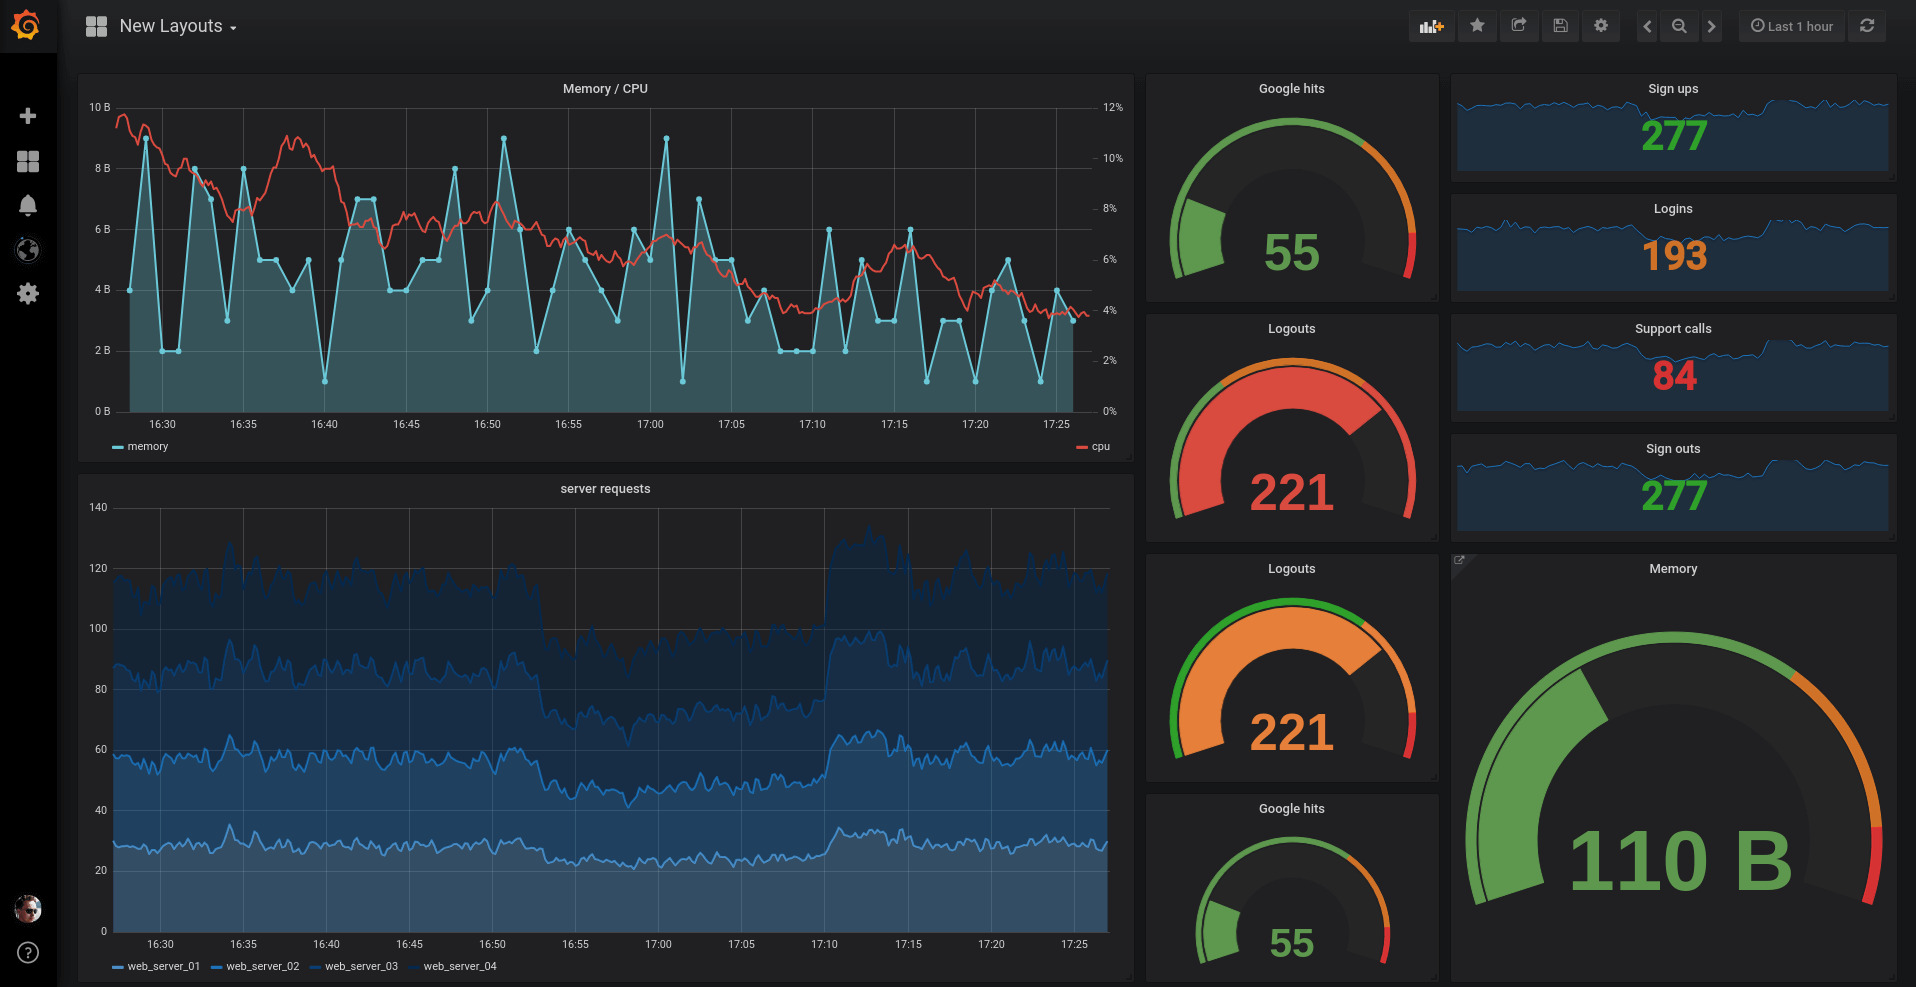
Grafana is open-source software that was designed on the same principle as Kibana. Torkel Ödegaard - Grafana’s creator - branched out Kibana and seriously expanded it, making it better adapted for visualizing and building graphs. (Kibana is a tool used for monitoring logs and is part of the ELK stack. So if you only need to monitor logs, take a look at our Grafana vs. Kibana comparison.) Grafana is the perfect tool for visualizing time series data. But that’s not all - the creators and maintainers of Grafana define it as an overall “open observatory platform”.
The main object in Grafana is a dashboard. It contains a grid of panels with different visualizations in them. You can organize dashboards into folders and assign different permissions to them.
As a descendant of the ELK stack, Grafana has native support for Elasticsearch. It also offers native support for a variety of different sources such as InfluxDB, MySQL, PostgreSQL, and many others. But the most promising aspect of Grafana is its powerful integrations with Prometheus and Graphite.
- Graphite is open-source software that is used for monitoring time-series data. It is powerful at querying but not as good for building dashboards. This is why using Graphite with Grafana is a popular solution. Graphite as a Service, which comes with Grafana already included, is a great option for scaling your Graphite and Grafana setup.
- Prometheus was developed by the SoundCloud team because they had a need for more specific monitoring tools than just Graphite. It’s free and also widely used with Grafana. Even though Prometheus has data visualization tools, it still has much fewer abilities than Grafana.
You can deploy Grafana yourself or, alternatively, Grafana as a Service is available through MetricFire.
Check out our free trial and start creating Grafana dashboards in minutes. Not sure if Grafana is the right option for you? If you have any questions you can book a demo and talk to us directly.
Tableau
Tableau is a tool used for data visualization and analysis performed in the business analytics field. But it can be used for more than this one purpose - Tableau has other add-ons for data management and server management, and developers can customize their own add-ons.
Tableau can pull data from any source you want, blend it, and allow you to make further transformations in order to prepare your data for visualization. For enterprise scenarios involving complex data pipelines, solutions like Integrate.io can handle the heavy lifting of ETL and data integration tasks across databases, APIs, and data warehouses, feeding clean data into your visualization tools. Popular sources of data for Tableau are Excel, PDF, Oracle, Amazon Web Services.
The Tableau ecosystem consists of the following tools:
Tableau Public
It allows you to create workbooks that will be available to everyone from the Tableau website. No privacy is provided here. It’s a good fit for educational purposes.
Tableau Desktop
It is software for creating workbooks on your local device and using them for whatever your needs are. In this case, a workbook can be private. Tableau Desktop exists in two versions: Tableau Desktop Personal and Tableau Desktop Professional. They will be explained later in the article.
Tableau Online
Allows you to share your workbook by loading it to the Tableau Group’s cloud.
Tableau Server
If you don’t want to load your workbooks anywhere except your machines you can share them with the Tableau Server. After creating a workbook in your Tableau Desktop you should publish it on your Server and give access credentials to your teammates.
The workflow is as follows:
Data collected from various sources goes either into Tableau Public or to Tableau Desktop. There it is transformed into a workbook. The workbook in the Public tool will be available to anyone. If you use Tableau Desktop Personal it will be available only to you. From Tableau Desktop Professional you can then publish a workbook either on the cloud via Tableau Online or self-host with Tableau Server. Tableau Desktop Professional is the only tool from which data can be sent to Tableau Online and Tableau Server services.
As you can see, Tableau Desktop and Tableau Public are developer tools - they allow workbook creators to fill them with visualizations, charts, and reports. Tableau Reader, Tableau Online, and Tableau Server are sharing tools. They are used to provide other people in your team with access to data on a dashboard.
Tableau is proprietary and includes various pricing options for on-premise and cloud-hosted formats.
Key similarities between Grafana and Tableau
- Both Grafana and Tableau have great visualization abilities. They use dashboards and various types of graphs.
- Both support the most widely used visualization techniques, such as bar charts, line charts, histograms, heat maps, pie charts, and scatter plots.
- Single values, text tables, and graph annotations are allowed too.
- HTTP API is available for Grafana and Tableau Server.
- Data can flow to Grafana or Tableau from various services and formats.
- Both services have alerting features.
- Grafana and Tableau are both able to visualize world maps.
Some of them are more or less powerful in some of these aspects, but both Grafana and Tableau can be used for business analytics, server management, and more data-focused cases.
Key differences between Grafana and Tableau
The concept of Grafana is very broad, while Tableau is more focused on business intelligence. Grafana is well suited for working with time series, application monitoring, and server monitoring. Working with servers can be a bit less comfortable with Tableau. However, Tableau has more specific business analytics tools. For example, only Tableau supports boxplots.
Add-ons
Grafana has plenty of data sources with built-in support, but if even those are not enough for your needs, it’s not a problem. As mentioned earlier, Grafana is fully open-source and enables you to write a plugin for any data source not presented yet. Given the fact that you’re probably not the first one that needs a specific plugin, you probably won’t even need to code: you can just search for a plugin that has already been created. The same is true for dashboard visualization tools.
Tableau has add-ons too, but not as many.
Alerts
Grafana’s alerting feature is very powerful and can send alerts about occurring events to any communication channel including Slack, PagerDuty, and more. You can set up predefined scenarios that you are interested in or manually send an alert from the graphic’s pop-up menu.
Tableau’s alerting system is nice, but sometimes it may not be enough. It only supports email notifications.
User friendly
Tableau is known for its ability to be used without writing any code. It provides enough tools to ensure that users without a technical background can get valuable insights from their data.
Grafana may seem more complicated if you want to build your monitoring system from scratch. Nonetheless, with Grafana as a Service from MetricFire, it wouldn’t be harder than using Tableau.
World map
One of Tableau’s most unique features is the World Map function, where built-in global postal codes allow for very fast mapping of countries. This is most frequently used to analyze business metrics by region.
This tool is also implemented at Grafana, but due to less attention to business intelligence, it is a bit simpler.
Templating
Grafana allows query templating which lets you define the dashboard structure once and then use variables with different data samples inside. Reusing the template may be suitable for test/development cases, working with different teams, or for replacing the data, depending on time or scope. Look for more details in the documentation.
In Tableau, you create worksheets in Tableau Desktop and send them to Tableau Reader as static files. You can reuse the template in Desktop next time, but you’ll need to create another worksheet by hand and share it separately.
License
It’s worth mentioning again that Grafana is fully open-source and Tableau is proprietary software. The availability of some functions may depend on this.
When to use each of the services
You probably need Tableau if you are working in the business intelligence field and have no other specific needs. If your demands are more complex and you have various types of data, Grafana may be a better fit. When it comes to time series and server monitoring, Grafana is very effective.
There are some scenarios where Tableau might be the better option for your needs. These include:
- If you have a lot of data in Excel sheets
- Need to compare regional data
- Need boxplots
Grafana fits you better if you:
- Have complex needs and various sources of data
- Need a powerful query builder
- Have high expectations for alerts
- Use Graphite for monitoring
Conclusion
Both Grafana and Tableau can probably meet your needs if you configure them correctly. But using the wrong tool can make things harder than they need to be. If you want to have fewer problems, it is essential to have a deep understanding of the capabilities of each tool. And when these capabilities are not enough, you need to know what tricks can be applied to compensate for this.
If you don’t have time to delve into these details, perhaps you should take a look at the out-of-the-box implementations. You can learn more about Grafana as a Service and see how MetricFire can fit into your monitoring environment. You also have the option of signing up for a free trial to start making Grafana dashboards right away. Feel free to book a demo if you have questions about what Grafana can do for you.