
Table of Contents
Great systems are not just built. They are monitored.
MetricFire runs Graphite and Grafana as a fully managed service for growing engineering teams, taking care of storage, scaling, and version updates so your team doesn't have to. Plans start at $19/month, billed per metric namespace rather than per host, and include engineer-staffed support. Integrations work natively with Heroku, AWS, Azure, and GCP, and data is stored with 3× redundancy in SOC2- and ISO:27001-certified data centres.
Introduction
Today we will look at monitoring Hashicorp’s Nomad platform using a combination of Prometheus and Grafana. But first, a quick recap of all 3 tools:
Nomad, from Hashicorp, is an abstraction layer that allows teams to divorce their applications from the underlying operating systems. Why would you want to do this? The main reason is to allow sysadmins and developers to stop worrying about each other’s areas of responsibility. Nomad can automate operational tasks for the system admin - automatic rescheduling, transparently removing live services from a node, taking nodes offline - without having to worry about how these actions will affect developers and their applications. For developers, Nomad lets them submit job deployment requests directly to Nomad, instead of first having to liaise by requesting the sysadmins. This means that the dev team does not have to worry about resource availability for their work.
Prometheus is an open-source monitoring and alerting toolkit. Its main features and benefits are its time-series data collection and automatic target discovery (especially useful in a multi-node setup where nodes are automatically created, such as in a Kubernetes cluster). For this post, we are also very interested in Prometheus’ ability to export data using the PromQL language. If you are not fully familiar with it, first read more about Prometheus monitoring capabilities here.
Grafana is a dashboard and data visualization platform. It allows you to take data from several sources and then query, visualize, and present it in richly featured dashboards, graphs, and charts.
Key Takeaways
- The article introduces three key tools: Nomad, Prometheus, and Grafana.
- Nomad: An abstraction layer that separates applications from the underlying OS, automating operational tasks for sysadmins and simplifying deployment for developers.
- Prometheus: An open-source monitoring toolkit with time-series data collection, automatic target discovery, and PromQL language for exporting data.
- Grafana: A dashboard and data visualization platform for creating rich dashboards, graphs, and charts.
MetricFire
MetricFire is a hosted Graphite and Grafana platform that provides all of the benefits of the OSS projects with none of the hassles. In this article, we'll also show you how to use Prometheus to monitor HashiCorp Nomad. You can use Graphite and Grafana directly in the web UI without having to manage the storage, querying, computing, installation, security, or updates. Book a demo with MetricFire to learn more about how MetricFire can help your Nomad monitoring.
How it works
In a nutshell, our monitoring setup will look like this:
- We have our app(s) running on a cluster of nodes.
- Since Nomad can be installed on a Kubernetes cluster and because both technologies complement each other, we can start with a cluster of nodes managed by Kubernetes.
- We then install a Nomad cluster on that platform and define various metrics to be collected (more on this later).
- These metrics will be collected, analyzed, and presented in complex combinations (such as time series) using Prometheus.
- Finally, that data will then be exported to Grafana for presentation and human-readable consumption in the form of dashboards, charts, graphs, etc.

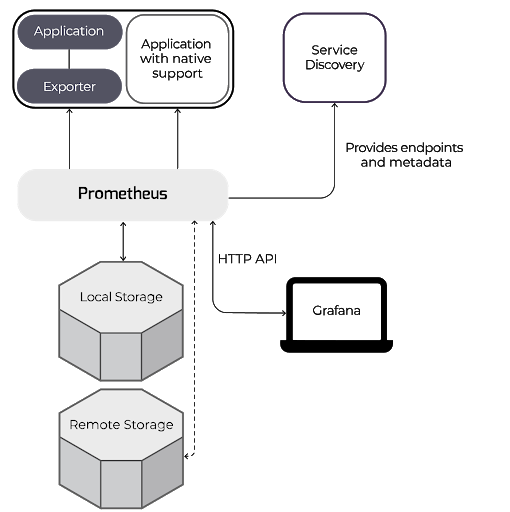
Below is a generic graphic showing how Prometheus works to collect metrics from an external application (in our case that is Nomad) and then export those via an HTTP API to Grafana for presentation.
More Details
Let us dive a bit more into the setup of each of our 3 components – Nomad, Prometheus, and Grafana:
Nomad
Although the exact details of how to set up and install Nomad are beyond the scope of this article, we can cover the basics and direct you to where to get more details:
- First, of course, we need to install the Nomad server and Nomad agents. The agents are the components that run on every node/machine in our cluster and collect Prometheus-friendly metrics specific to that node. You can read much more about how to install Nomad here.
- Next, you will need to set up a Nomad cluster, as explained in this article on the HashiCorp website.
- After that, start the Nomad cluster server and the Nomad agents on all the nodes.
- And finally, check Nomad’s browser-based UI using this URL: http://localhost:4646 to confirm that the Nomad server and agents are all up and running ok.
For our purposes, we are more interested in Nomad’s metrics – that is, the data that Nomad collects on each node/machine in our cluster, and that is what we will export to our Prometheus server. The Nomad Agent can collect a huge range of metrics, and not all will be equally useful in all situations. It is advisable to carefully go through the list of metrics and select only those applicable to your unique setup. That said, the hardware metrics listed below are likely of use to almost everyone:
|
Metric |
Description |
|
nomad.runtime.alloc_bytes |
Memory utilization as several bytes |
|
nomad.worker.wait_for_index |
Average Time spent waiting for Raft log replication from the leader. High delays result in lower scheduling throughput |
|
nomad.rpc.query |
Several RPC queries per interval |
|
nomad.client.allocated.cpu |
The total amount of CPU shares the scheduler has allocated to tasks |
|
nomad.client.allocated.memory |
The total amount of memory the scheduler has allocated to tasks |
|
nomad.client.allocated.disk |
The total amount of disk space the scheduler has allocated to tasks |
|
nomad.client.allocated.network |
The total amount of bandwidth the scheduler has allocated to tasks on the given device |
|
nomad.client.host.memory.total |
The total amount of physical memory on the node |
|
nomad.client.host.memory.used |
Amount of memory used by processes |
|
nomad.client.host.memory.free |
Amount of free memory on a node |
|
nomad.client.uptime |
Uptime of the node running the Nomad client |
|
nomad.client.host.cpu.total |
Total CPU utilization on a client node |
|
nomad.client.host.cpu.idle |
Idle time spent by the CPU |
|
nomad.client.host.disk.used |
Amount of disk space which has been used |
|
nomad.client.host.disk.used_percent |
Percentage of disk space used |
Nomad provides these metrics endpoints to Prometheus using one of the many available client libraries. Each application or exporter endpoint serves up its metrics, plus the relevant tags and other metadata, whenever Prometheus requests them. A popular exporter is node_exporter, which collects system metrics for Linux and other *nix servers.
You can (and should) also add to the main Nomad config file (nomad.conf.hcl) these 3 settings:
- Define the frequency of Nomad’s generation of metrics (say every 5 seconds)
- Specify that both Nomad-host and Nomad-node metrics should be published (that is, made available to outside services like Prometheus)
- Specify that the metrics are Prometheus-compatible.
These 3 important settings are defined in the telemetry stanza of the nomad.conf.hcl. A sample extract of this file that defines these 3 settings is shown below:
telemetry {
 collection_interval = "5s",
 publish_allocation_metrics = true,
 publish_node_metrics = true,
 prometheus_metrics = true
}
Prometheus
The metrics generated from Nomad now need to be available to Prometheus for monitoring and analysis. Note that Nomad itself has some internal monitoring and even data-presentation capability, but is nowhere near the full-featured solution offered by Prometheus.
The first step is to install Prometheus, integrate it into your Nomad cluster, and then configure it to access and import the metric endpoints you defined above. Read this guide to find out how to do all these. And if you are not familiar with all the Prometheus components, first read about them here.
So why would we use Prometheus and not another monitoring service? Good question. Some important factors that tilt the answer to Prometheus as an excellent monitoring solution are listed below, and examined in more depth in this post:
- Prometheus is open-source and has a large, active community that actively supports it and creates new plugins and integrations with almost all platforms – including, of course, Nomad.
- Outage detection: also related to the above point. Since Prometheus knows what it should be monitoring, outages are very quickly detected when the request fails.
- Low load on the servers and services being monitored: Prometheus typically places a near-insignificant load on the system it is installed in. One way it does this is because Prometheus metrics are stored in memory as they are generated and only converted into a readable format when requested. This uses up fewer resources, compared to first converting every metric into a string to send as soon as it’s created (as you would for a service like Graphite). Also, metrics are batched and sent all at once via HTTP, so the per-metric load is lower than sending the equivalent, even by UDP.
- Service discovery: this is the big one. Prometheus can track new nodes and services. So whenever a new node is created in our cluster (such as when a node or a Docker container dies and a new one is created), Prometheus can automatically detect it and send a notification to this effect. Read more about service discovery here.
As a quick illustration: say your Prometheus installation is using the Consul Service Directory to discover services running on Nomad. Prometheus can be set up to query the Consul Service Directory and then scrape the required Nomad metrics periodically by adding the YAML configuration below into the main Prometheus configuration file:
- consul_sd_configs:
  - server: localhost:8400
  job_name: mngt_consul_service
  relabel_configs:
  - action: keep
    regex: management-service
    source_labels:
    - __meta_consul_service
A few more points of interest in Prometheus:
- The number of seconds between when Prometheus scrapes the predefined metrics controls the granularity of the time-series database. This gap is defined in the Prometheus configuration file as the scrape_interval parameter, which by default is set to 60 seconds. If you use this parameter, you should set this value to the same as or less than the collection_interval parameter that you set earlier in the nomad.conf.hcl (Nomad config file).
- ‘Targets’ are the nodes that will be affected by each Prometheus job. Targets are set in the scrape_configs section. Each job has its name and a set of labels that can help filter, categorize, and make it easier to identify the target. And one job can have multiple targets.
- Related to the above: Understand which jobs to run on all nodes, and which should only run on a subset of your nodes. For example, you should create a job that scrapes and keeps track of the nomad.client.uptime metric in ALL your targets/ nodes, since it is important to know the uptime for all nodes. But for another job set up to scrape the nomad.client.host.disk.used metric, you can set this job to run only on the nodes you suspect are likely to have a lot of read-write disk activity.
- Prometheus also contains Alertmanager, the alert-handling engine. Although important, it is beyond our scope for now. Still, you should at least familiarize yourself with what Alertmanager is and how it works at a basic level. You can also check out the top 5 Alertmanager Gotchas here.
- Prometheus is great at collecting and analyzing numerical metrics like CPU usage, memory and disk usage, uptime, network statistics, etc. However, it is not suitable for non-numerical metrics such as system logs. Although it features a web-based output, Prometheus is not meant for visualization, presentation, and dashboarding of those collected metrics. Hence we need Grafana.
Grafana
Just like Prometheus, Grafana is open-source. It is widely used for data visualization due to its ability to display a wide range of data from multiple sources. Prometheus and Grafana work very well together and are typically used in combination.
To set up and connect Grafana to Prometheus, follow the instructions on the Prometheus site. You can also leverage Integrate.io to easily build data pipelines that feed metrics and other data into your Prometheus and Grafana setup, enabling seamless connectivity across your entire data infrastructure.
Grafana also includes a range of templates and dashboards, so you do not have to do everything from scratch.
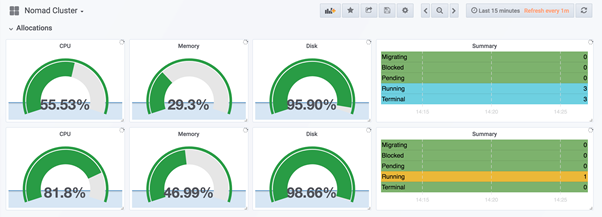
So what will we include in our dashboards? First, of course, are all the metrics that Prometheus collected from Nomad. It is a good idea to create a dashboard for each of the important visualizations that you want to be able to see quickly – for example, a dashboard/view for all the CPU+memory+disk utilization of your nodes, another to view all uptime across your nodes, and so on. A sample screenshot of each of these is shown below (taken from the Grafana website):
The dashboard below illustrating CPU+memory+disk utilization for 3 nodes:
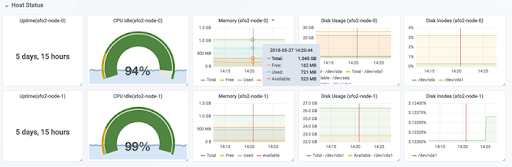
The dashboard below illustrates Uptime for 2 nodes:
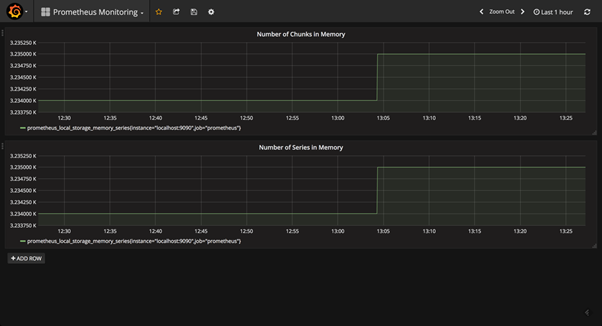
Also, since Prometheus stores data in memory, you can build a Grafana panel to monitor the Prometheus server itself, using the prometheus_local_storage_memory_chunks and prometheus_local_storage_memory_series metrics. You can check the screenshot below:
Conclusion
You now have a pretty good overview of how to set up Prometheus and Grafana to monitor Nomad clusters. What we outlined here is the 'hard way' of doing it. But it's important to realize that there is a way to avoid all this hassle by using MetricFire's Hosted Graphite solution.
With this solution, you do not have to worry about Prometheus installation and configuration. You can easily use the tried and true Graphite to make your monitoring easier. You will find you can just plug and play your way into setting up your metrics for monitoring.
If you're interested in trying it out for yourself, sign up for our Hosted Graphite free trial. You can also sign up for a demo, and we can have a no-obligation chat about the best Graphite monitoring solutions for you.


