Table of Contents
Great systems are not just built. They are monitored.
MetricFire runs Graphite and Grafana as a fully managed service for growing engineering teams, taking care of storage, scaling, and version updates so your team doesn't have to. Plans start at $19/month, billed per metric namespace rather than per host, and include engineer-staffed support. Integrations work natively with Heroku, AWS, Azure, and GCP, and data is stored with 3× redundancy in SOC2- and ISO:27001-certified data centres.
https://mobilunity.com/blog/aws-cloudtrail-vs-aws-cloudwatch/Out of more than 100 services that Amazon Web Services (AWS) provides, Amazon CloudWatch was one of the earliest services provided by AWS. CloudWatch was announced on May 17th, 2009, and it was the 7th service released after S3, SQS, SimpleDB, EBS, EC2, and EMR.
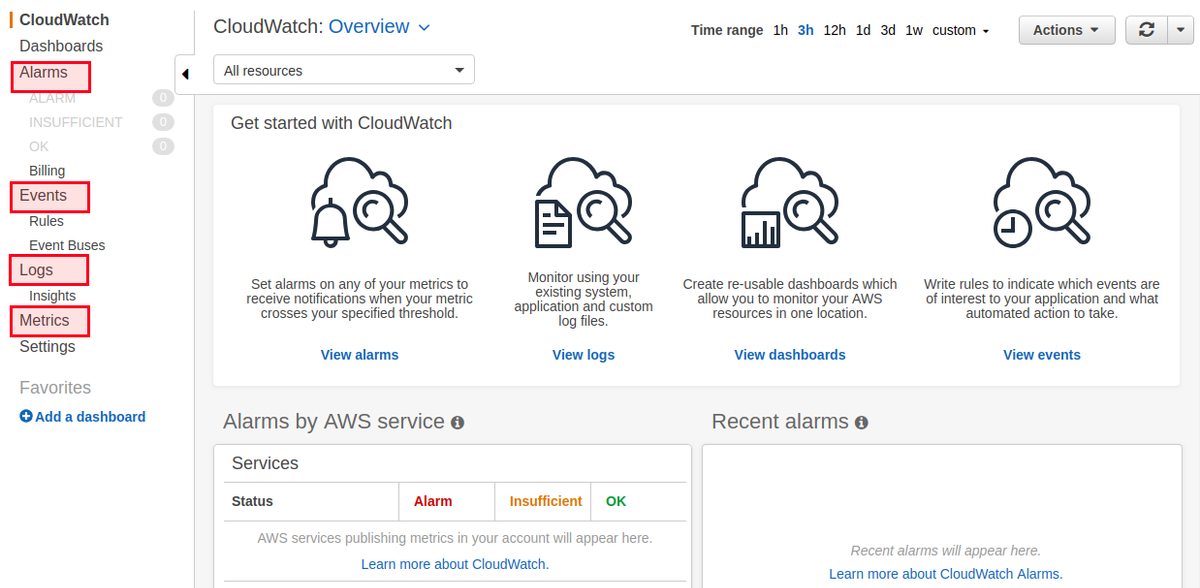
AWS CloudWatch is a suite of tools that encompasses a wide range of cloud resources, including collecting logs and metrics, monitoring, visualization and alerting, and automated action in response to operational health changes. CloudWatch is an excellent tool because it allows you to go beyond monitoring into observability.
You can pipe AWS CloudWatch data directly in MetricFire's dashboards. Check it out with a free trial and get your data visualized as soon as possible.
Key Takeaways
- Observability is a crucial aspect of cloud computing and modern software engineering. It goes beyond monitoring and focuses on understanding the internal states of a system based on its external outputs.
- CloudWatch provides four main features: Alarms (configurable actions based on conditions), Events (real-time streams describing changes in AWS resources), Logs (centralized log storage and analysis), and Metrics (time-ordered data points published to CloudWatch).
- Alarms allow you to take action based on specific conditions, such as reaching a threshold and can trigger notifications via AWS Simple Notification Service (SNS).
- CloudWatch Events provides continuous streams of system events, offering a comprehensive view of your systems and enabling you to respond to changes proactively.
- CloudWatch Logs centralizes logs from various AWS resources and services, making it easier to monitor, query, and analyze logs.
Introduction to Observability
For some time now, observability has played a crucial role in the cloud computing and modern software engineering ecosystems. The word is no longer just a simple buzzword, and Amazon has adapted to this by adding the tools and means to do proactive monitoring.
Indeed, you can have your monitoring set in place, but you may not have an observable system.
If you are new to observability, think of it as a measure of how well the internal states of a system can be inferred from knowledge of its external outputs. In simpler words, monitoring is about the symptoms of a problem, and observability is about the (possible) root causes of it.
You can also think of observability as "the white box monitoring". In this type of monitoring, logs, metrics, and traces are the pillars of observability.
In this blog post, we will explore the basics of CloudWatch, examine some of its use cases, and delve into its core concepts. To do this, we will focus on 4 main features that this service offers:
- Alarms
- Events
- Logs
- Metrics
CloudWatch Alarms
Before diving into specific CloudWatch features like Alarms, it’s helpful to understand how CloudWatch compares to other AWS services designed for monitoring and auditing. For example, AWS CloudTrail vs Amazon CloudWatch is a common topic for teams trying to decide how to track resource activity versus performance metrics. While CloudWatch is built for observability and operational health, CloudTrail is focused on compliance and auditability through event logging.
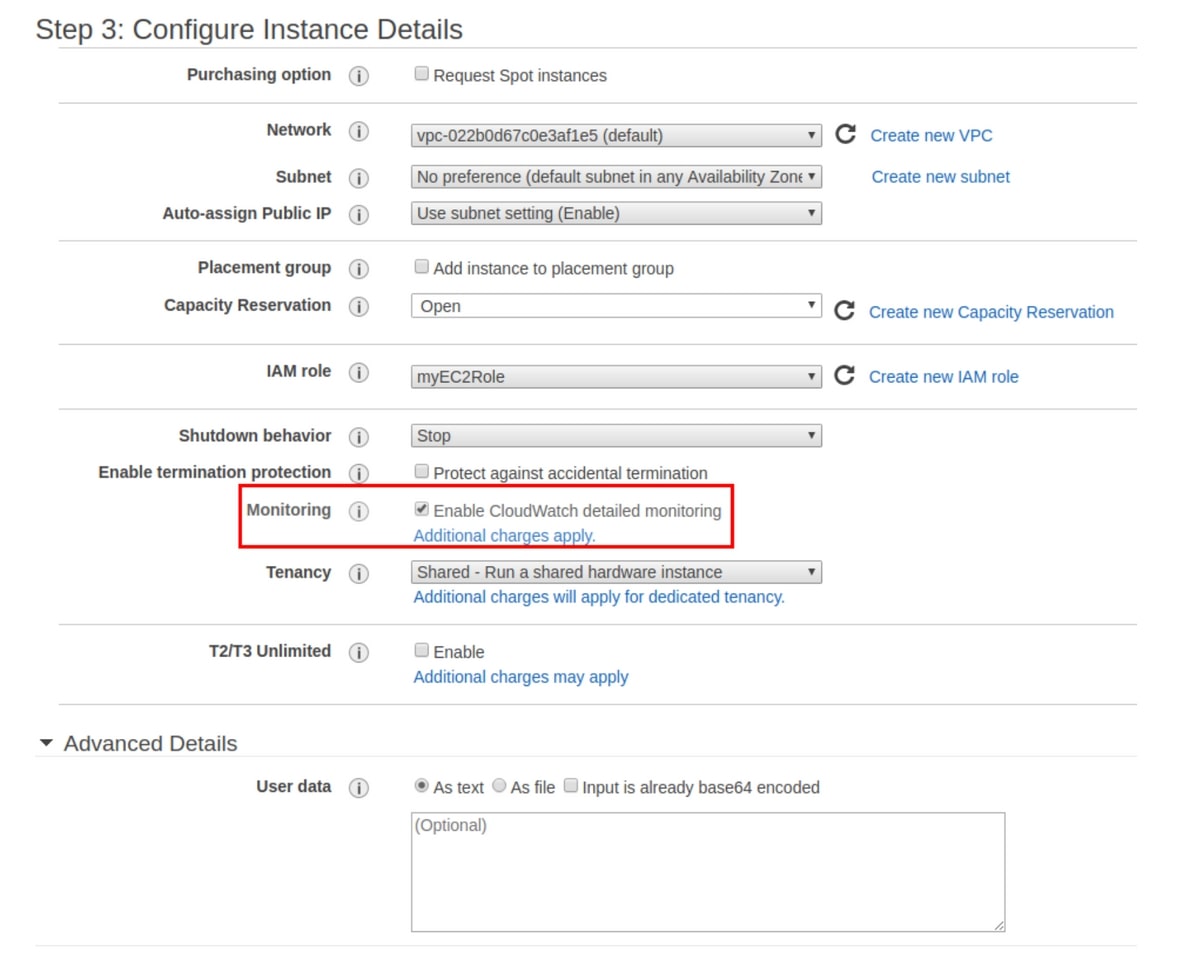
You can configure alarms to initiate an action when a condition is satisfied, like reaching a pre-configured threshold. To better understand this, let's create an Elastic Computing Cloud (EC2) machine. We don't need a production instance, since either nano or micro instances can be used.
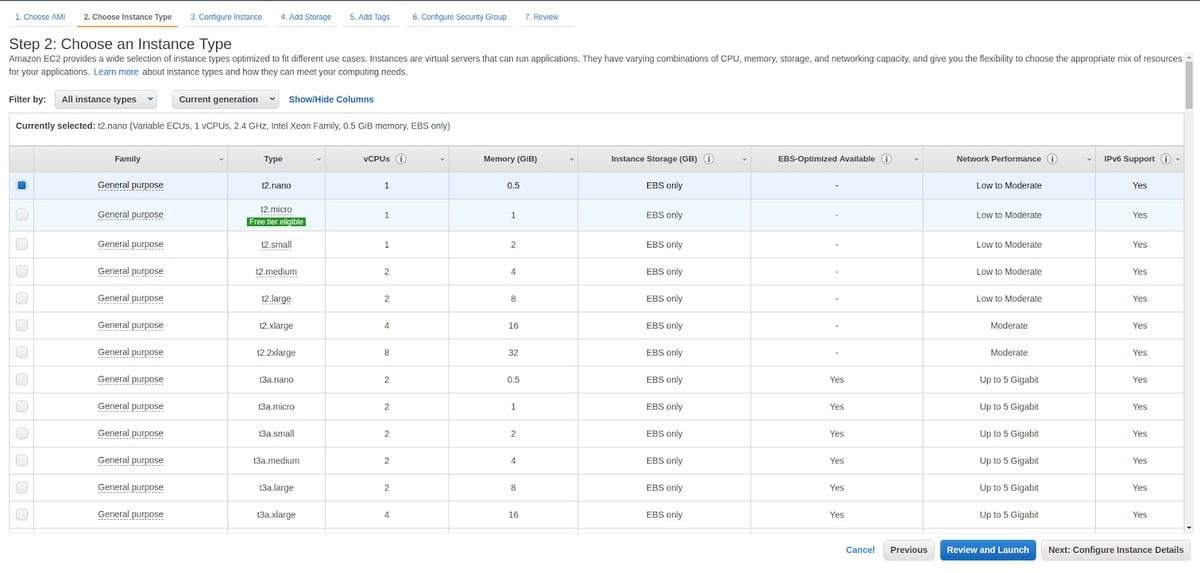
When creating this instance, ensure that you enable CloudWatch detailed monitoring, which will make data available in one-minute intervals for an additional cost. The standard monitoring is free, but it takes 5 minutes to deliver data to CloudWatch.
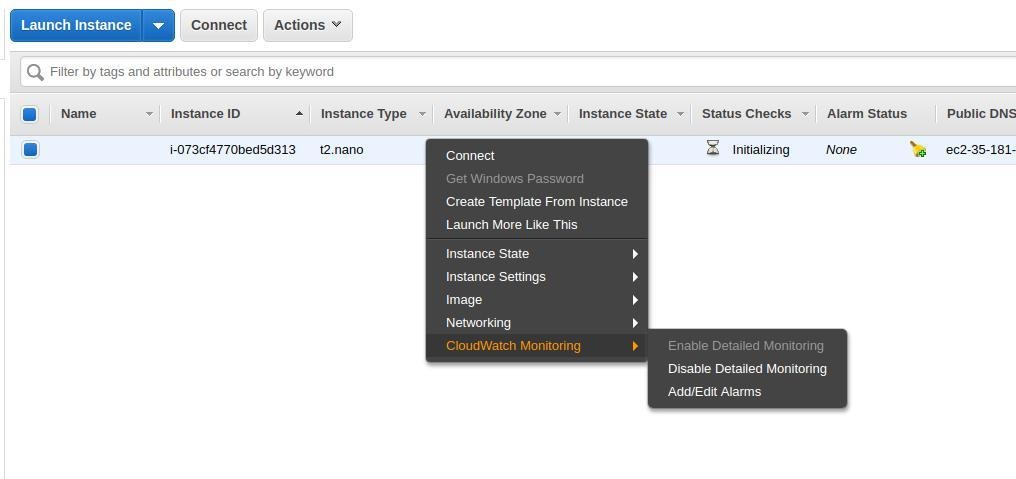
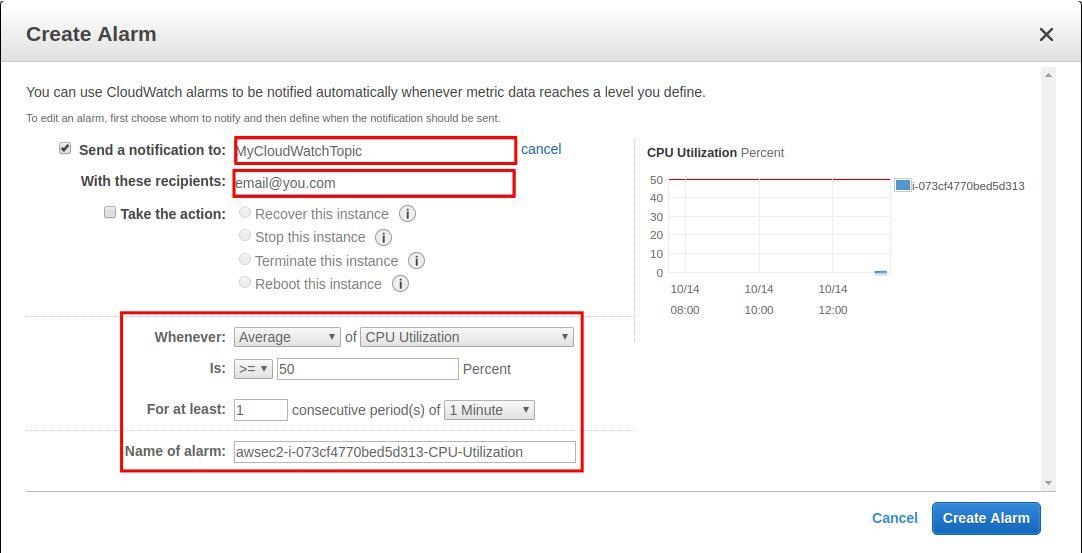
After creating the EC2 instance, you can use the EC2 machine to set up an alarm. First, click ‘Edit’, and then ‘Add alarm’.
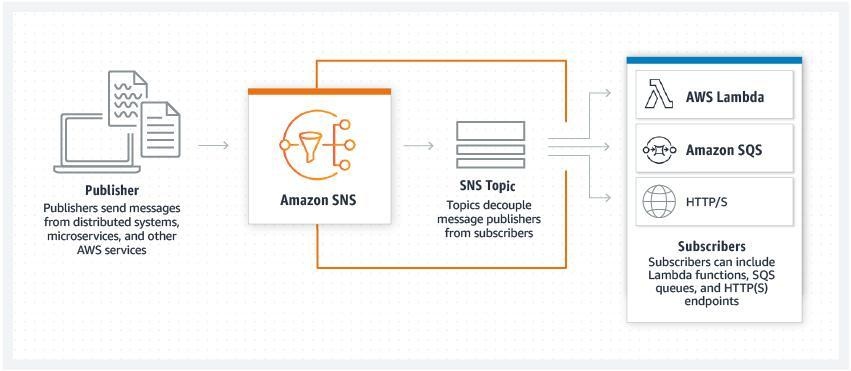
At this step, there is an important concept to understand: alarms are managed by AWS CloudWatch, but in most use cases, you will be notified by something like an email when your alarm is active. This feature is managed by AWS Simple Notification Service or SNS. SNS is a low-cost messaging and notification service that lets you decouple publishers from subscribers. In our case, SNS will be used to listen to CloudWatch alarms and send an email when an alarm is active.
We can create an SNS topic from the EC2 alarm configuration window, or use the SNS administration dashboard. Say we want CloudWatch to send us an email when the average CPU utilization of our EC2 instance reaches 50% or more for at least a period of one minute. This can be easily configured from the EC2 console. You can also set up an action that will be triggered once the same conditions are fulfilled. Don't forget to confirm your email subscription to the topic.
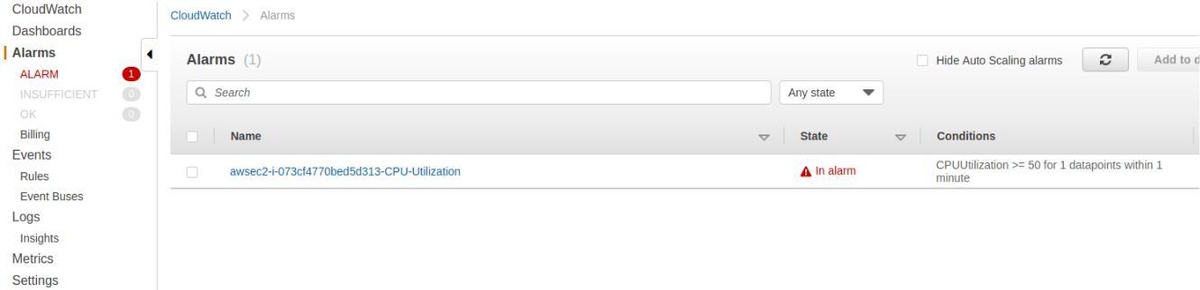
To test this out, we are going to stress our EC2 CPU and see the resulting alarm and notification from CloudWatch. The tool used here is called stress. To spawn 500 workers spinning on sqrt() with a timeout of 600 seconds, we can use this command:
stress --cpu 500 --timeout 600
After some minutes, you will be able to see that the alarm is active, and if you confirm your subscription to the topic we created above, you will also receive an email.
We have seen how to push an email notification when a condition is fulfilled, but you can also set up other actions to trigger methods like auto-scaling.
You are receiving this email because your Amazon CloudWatch Alarm "awsec2-i-073cf4770bed5d313-CPU-Utilization" in the EU (Paris) region has entered the ALARM state, because "Threshold Crossed: 1 datapoint [71.6666666666667 (14/10/19 14:00:00)] was greater than or equal to the threshold (50.0)." at "Monday 14 October, 2019 14:01:56 UTC".
CloudWatch Events
If you need a near real-time stream that describes changes to your AWS resources, Events is what you're looking for. Events make CloudWatch aware of your operational changes as they happen, and they respond by taking action.
Events vs. Alarms
You can create an alarm on any of the AWS resources you use, and you will receive a notification once a threshold is reached. Events are continuously recorded over time. This continuity is the main difference between events and alarms.
CloudWatch Events are a stream of system events that provide a comprehensive view of your systems. Meanwhile, alarms are generally used when you know the metrics you are measuring.
Suppose you are running a streaming service like Netflix with millions of viewers worldwide. You will never get a complete view of your system loads and operational changes as they occur if you only use alarms.
CloudWatch Events Basics
There are three concepts you should be familiar with when setting up a CloudWatch Event stream:
- Events: Each resource has a list of events generated by AWS when a state change occurs. In our example, we learned how to trigger events when an EC2 instance state changes.
- Targets: A target receives events (in JSON format) when the event is triggered.
- Rules: When an event is triggered or a state changes (and only when this change matches a rule that the user pre-configured), the event is transmitted from the event source to the target for processing.
These are some of the target services offered by AWS CloudWatch:
- Amazon EC2 instances
- Log groups in Amazon CloudWatch Logs
- AWS Batch jobs
- AWS Lambda functions
- Amazon ECS tasks
- Amazon SNS topics
- Amazon SQS queues
- Amazon Kinesis Data Streams
You can even configure the default event bus of another AWS account as a target.
Creating Events and Rules
In the first part of this blog post, we created an EC2 machine. We will now use it to demonstrate how events can be streamed continuously, containing data about the instance state. We will also show how events can call a target as soon as a change occurs.
Go to the AWS CloudWatch console, click on ‘Events’, and create a new rule:
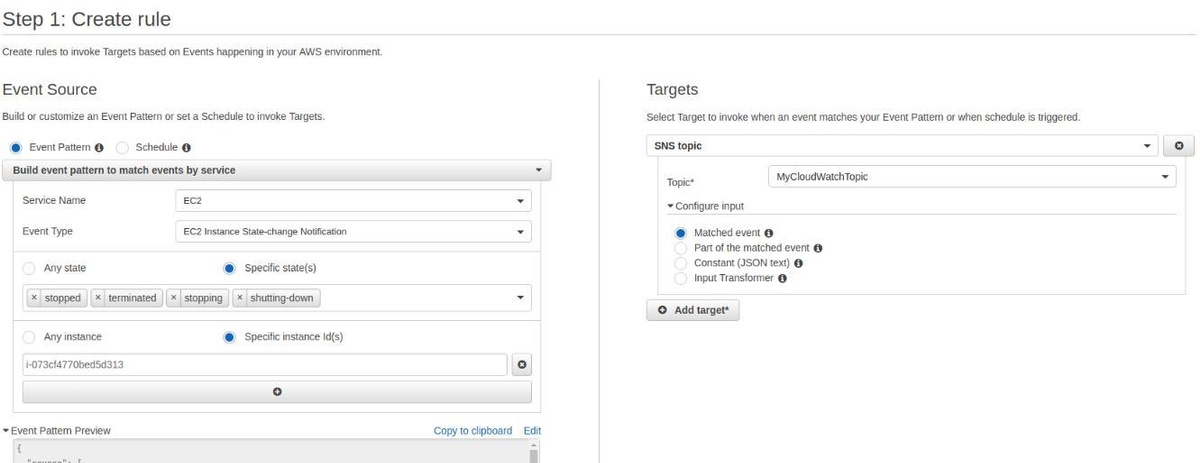
We can configure an event pattern to match any state change of an EC2 service and specify a single instance (using its ID). On the target, we can set up the same SNS topic to which we already subscribed by email. This guarantees that when an instance state is "stopped", "terminated", "stopping", or "shutting-down", we will receive an email.
Let's trigger the event by stopping the instance:
aws ec2 stop-instances --instance-ids <instance_id>
When the instance stops, you should receive two emails. One with the state "stopping" and another email when the instance is completely stopped:
{
  }
  "version":"0",
  "id":"2d2fa149-b1b6-23ad-27cd-15fdc00d4ff2",
  "detail-type":"EC2 Instance State-change Notification",
  "source":"aws.ec2",
  "account":"998335703874",
  "time":"2019-10-14T14:06:15Z",
  "region":"eu-west-3",
  "resources":[
     "arn:aws:ec2:eu-west-3:998335703874:instance/i-073cf4770bed5d313"
  ],
  "detail":{
    "instance-id":"i-073cf4770bed5d313",
    "state":"stopped"
  }
You can implement several use cases using the different configurations that CloudWatch offers. For instance, you can add AWS Lambda Function to process, transform, and analyze the data sent when a change occurs. This allows you to specify and trigger custom actions. You can also connect your SNS to Slack team chat and publish alarms to the same SNS, etc.
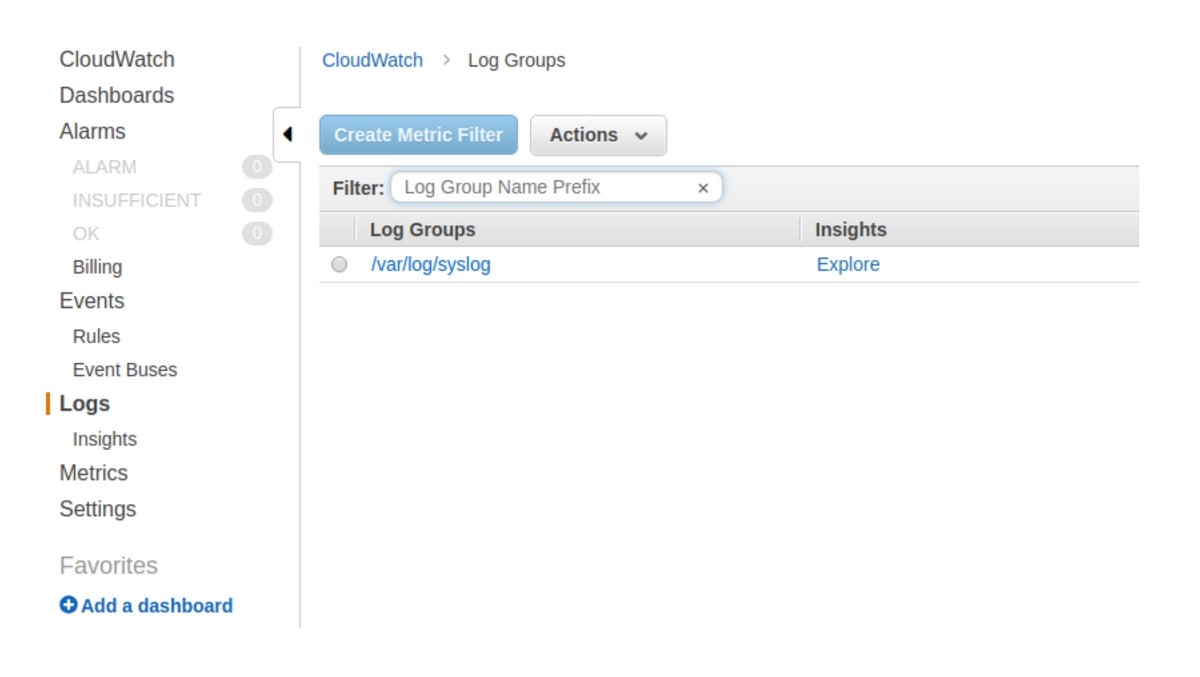
CloudWatch Logs
Just like metrics, logs are crucial for gaining more control and observability over your systems. You can use CloudWatch to monitor, store, access, query, analyze, and visualize your logs. CloudWatch centralizes the logs from all of the resources and AWS services you use in a scalable service. For example, you can store your web application access logs and adjust their retention period to 10 years. You can also store your system logs, which is ideal when you don't want to retain logs on the host machine, or when your infrastructure is immutable.
The Twelve-Factor App and CloudWatch
"Treat logs as event streams." This is one of the principles of the twelve-factor app developed by Heroku:
Logs are the stream of aggregated, time-ordered events collected from the output streams of all running processes and backing services. Logs in their raw form are typically a text format with one event per line (though backtraces from exceptions may span multiple lines). Logs have no fixed beginning or end, but flow continuously as long as the app is operating.
When examining the philosophy of AWS CloudWatch Logs, it is beneficial to implement this principle by treating logs as event streams.
Using CloudWatch Logs Agent
We want to create a stream of our system logs (syslogs) using CloudWatch Logs, so we need to install and configure an agent on our EC2 machine.
curl https://s3.amazonaws.com/aws-cloudwatch/downloads/latest/awslogs-agent-setup.py -O
sudo python ./awslogs-agent-setup.py --region eu-west-3
Once the installation is completed, an interactive setup will start:
Step 3 of 5: Configuring AWS CLI ...
AWS Access Key ID [None]: xxxxxxxxxxxxxx
AWS Secret Access Key [None]: xxxxxxxxxxxxxxxxxxxxxxxxxx
Default region name [eu-west-3]:
Default output format [None]:
Step 4 of 5: Configuring the CloudWatch Logs Agent ...
Path of log file to upload [/var/log/syslog]:
Destination Log Group name [/var/log/syslog]:
Make sure to configure the IAM credentials that have the ability to execute at least these actions:
- logs:CreateLogGroup
- logs:CreateLogStream
- logs:PutLogEvents
- logs:DescribeLogStreams
Alternatively, attach this policy to the role you will use:
{
  "Version": "2012-10-17",
  "Statement": [
    {
      "Effect": "Allow",
      "Action": [
        "logs:CreateLogGroup",
        "logs:CreateLogStream",
        "logs:PutLogEvents",
        "logs:DescribeLogStreams"
    ],
      "Resource": [
         "arn:aws:logs:*:*:*"
    ]
  }
 ]
}
A few seconds after finishing the above configurations, you will be able to see your syslogs:
CloudWatch Insights
Using Insights Explorer, you have the ability to query your log stream. These are some useful examples:
1. 25 most recently added log events:
fields @timestamp, @message
sort @timestamp desc
limit 20
2. Number of exceptions logged every 5 minutes:
filter @message like /Exception/
stats count(*) as exceptionCount by bin(5m)
sort exceptionCount desc
3. List of log events that are not exceptions:
fields @message
filter @message not like /Exception/
4. View Lambda latency statistics for 5-minute intervals:
filter @type = "REPORT"
stats avg(@duration), max(@duration), min(@duration) by bin(5m)
5. VPC top 10-byte transfers by source and destination IP addresses:
stats sum(bytes) as bytesTransferred by srcAddr, dstAddr
sort bytesTransferred desc
limit 10
CloudWatch Logs Subscriptions
This feature allows you to subscribe to another service like AWS Lambda. A good use case is when you need to ETL (extract, transform, and load) your logs data from AWS CloudWatch to another datastore. You may also need to use a full-text search engine - this is when you can use subscriptions to send logs to Amazon Elasticsearch Service (AES)
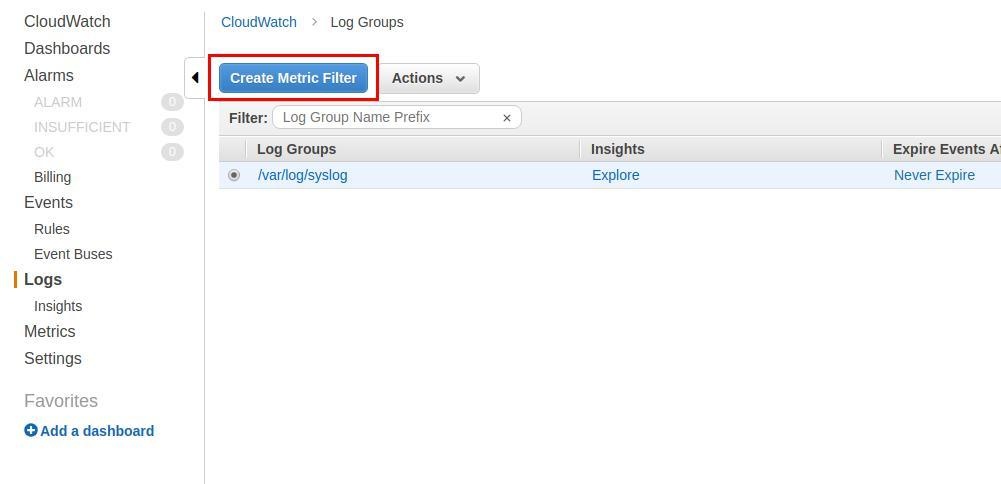
CloudWatch Metric Filter
Using the CloudWatch console, you can also create a filter to extract custom text from your logs, as shown in the next section.
CloudWatch Metrics
A metric is a time-ordered set of data points that are published to CloudWatch. We will walk you through creating custom metrics and discuss AWS observable metrics.
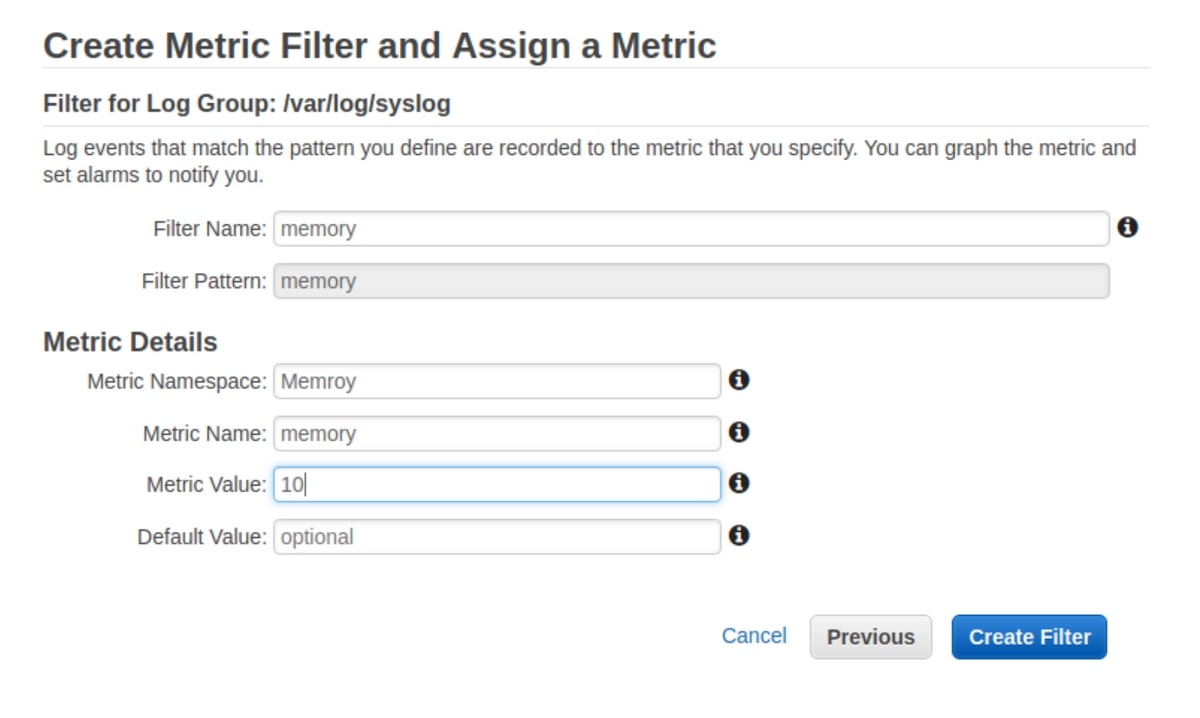
Custom Metrics
Adding on to the last example, say you want to group all of the log lines containing the word "kernel", or you want to grep the word "memory". Let's do this using the "Create Metric Filter" from before.
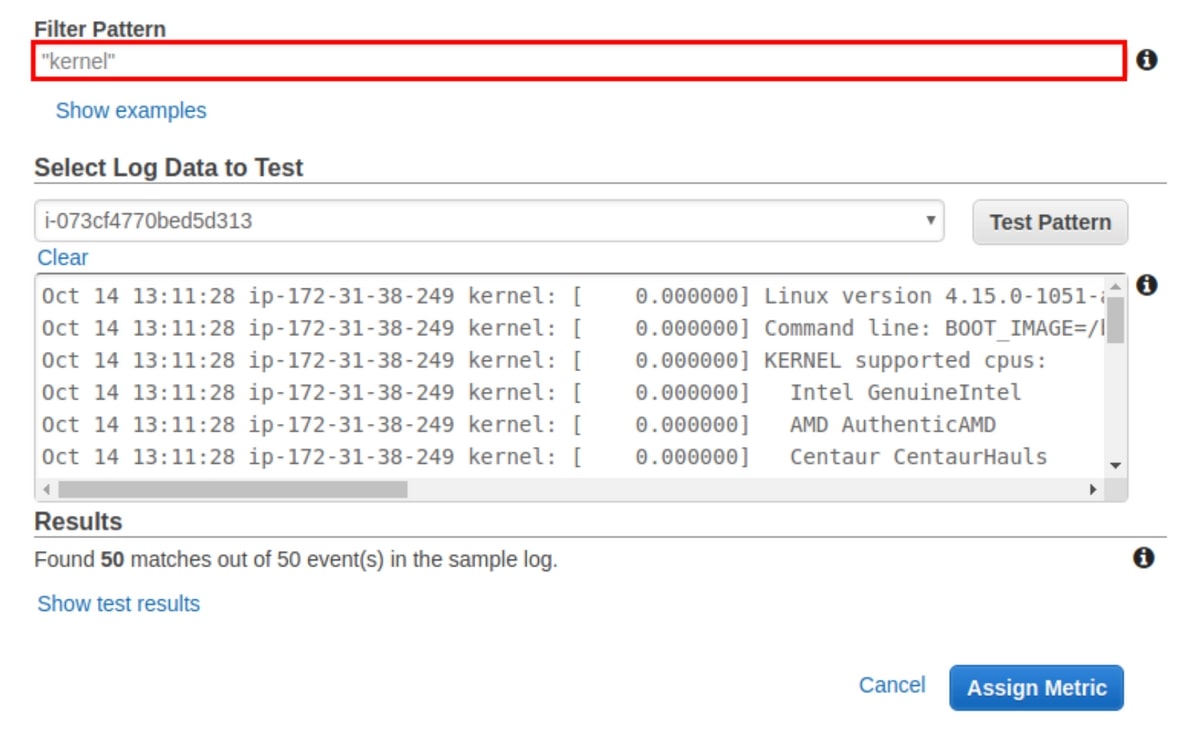
Note: this example is using a simple pattern, but AWS lets you use more advanced patterns for complicated use cases. Regardless of whether your pattern is complex or simple, you will be able to assign it, then visualize it once chosen.
In this practical example, we filter the word "memory" from the syslog stream we set up before. To verify that everything is working well, we are going to load-test the memory.
stress --vm 10 --timeout 200
---
stress: info: [12302] dispatching hogs: 0 cpu, 0 io, 10 vm, 0 hdd
stress: FAIL: [12306] (494) hogvm malloc failed: Cannot allocate memory
Since we are using a nanomachine, it's obvious that the memory will not support this kind of stress test; however, this is a good exercise to check and visualise the logs. First of all, we can see the memory fault here:
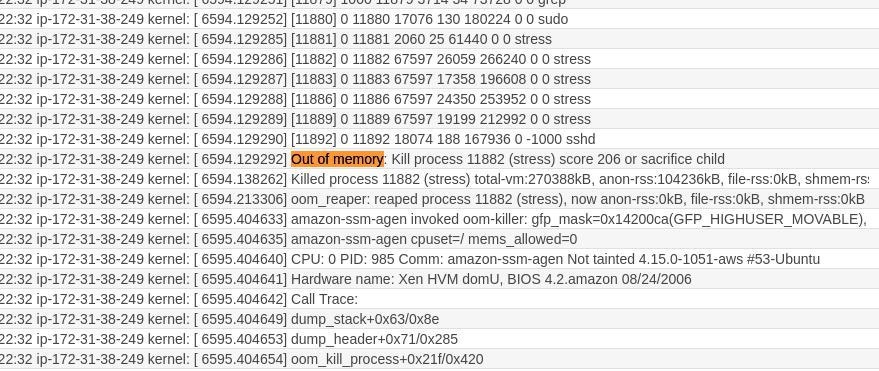
At the same time, with the right configurations, we can visualize the "memory" word count in the log stream and thus monitor the health of the EC2 instance memory.
AWS Standard Metrics
AWS also publishes metrics configured by default. When you visit the Metrics dashboard, you can view the available metrics that are part of the AWS namespace. You can create different namespaces for your custom metrics, and it’s recommended if you want to isolate your metrics in a separate container. If you manage many applications at the same time, you don't want to see metrics from different apps aggregated in the same feeds.
Given that most AWS services publish metrics, you have numerous possibilities to utilise CloudWatch effectively. These are some common examples:
- Monitoring API Execution with Amazon CloudWatch by aggregating IntegrationLatency, Latency, CacheHitCount, and CacheMissCount metrics
- Monitoring AWS CodeBuild by counting the number of attempted, successful, and failed builds and using metrics like BuildDuration, FailedBuilds, and QueuedDuration
- Monitoring Amazon DocumentDB Metrics (disk usage, replication lag, CPU usage, disk queue depth, and more); DocumentDB publishes many metrics like BackupRetentionPeriodStorageUsed, BufferCacheHitRatio, CPUUtilization, DatabaseConnections, DBInstanceReplicaLag, DBClusterReplicaLagMaximum and more.
Building Better Observable Systems
Alarms, events, logs, and metrics--coupled with other AWS services--give you the flexibility you need to build an efficient monitoring and observability system that works for you. You may have various sources of information and data that should be collected and analysed to gain a comprehensive view of your systems. AWS CloudWatch can help you. Using the built-in features in CloudWatch, you can collect and aggregate a maximum of data, and organise and visualise it using the various tools CloudWatch offers.
If you're using AWS CloudWatch to collect metrics on your infrastructure but are looking for a more customizable alerting and data observability platform for aggregation, check out our MetricFire free trial. There is also more information on AWS and MetricFire compatibility in our documentation. You can also book a demo and talk to us directly about how to make AWS CloudWatch compatible with MetricFire.