
Table of Contents
Great systems are not just built. They are monitored.
MetricFire runs Graphite and Grafana as a fully managed service for growing engineering teams, taking care of storage, scaling, and version updates so your team doesn't have to. Plans start at $19/month, billed per metric namespace rather than per host, and include engineer-staffed support. Integrations work natively with Heroku, AWS, Azure, and GCP, and data is stored with 3× redundancy in SOC2- and ISO:27001-certified data centres.
Introduction
To understand why Graphite metrics delay occurs, we must first know what Graphite is. Graphite is an open-source tool used to track the performance of websites, applications, and network servers. It makes it simple to monitor, store, retrieve, and visualize numeric time-series data.
While Graphite does make it easier to render graphs on-demand, the struggle of dealing with large amounts of data with minimum delay is real.
Key Takeaways
In this article, we will be covering four possible reasons for such delays and how to fix them.
- Intentional Delay on Graphics
- Graphite Version
- Caching
- Carbon Hashing & Go-Carbon
If you’re looking for a jumpstart, check out MetricFire. It offers Hosted Graphite and Hosted Grafana for a more cloud-centric approach. In case, you’re wondering which one to choose, check out our detailed comparison between the two. To learn more, book a demo, or sign on to the free trial today!
This article assumes some basic familiarity with Graphite. If you’re just starting your journey with this open-source tool, a quick read on Graphite Architecture is recommended.
Intentional delay in Graphics
If you’re experiencing a slight gap, the first step would be to check your time settings. Graphite metrics come with a default delay time of 60 seconds for caching the metrics. Under this category, we will be discussing two methods to change this intentional Graphite metrics delay as per your application requirements.
Method 1 - User-Interface:
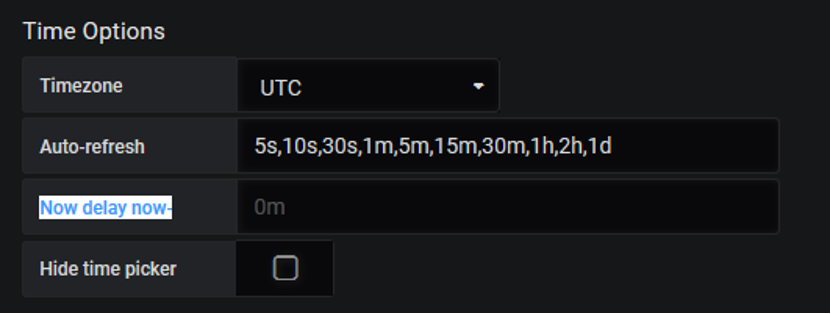
To change this deliberate delay, go to Settings->General->Time Options in your web application. Enter your customized value corresponding to the “Now Delay now” textbox as shown below.
To explore more about a cluster configuration and its default settings, visit the Official Documentation (Page 23).
Method 2 - Editing the local_settings.py:
This can alternatively be achieved by editing local_settings.py in the web app’s settings.py module from where Graphite’s web runtime configuration is loaded. This file would look something like this. The default path of the file is.
/opt/graphite/webapp/graphite/local_settings.py
In case you changed your path in the past, echo your GRAPHITE_SETTINGS_MODULE environment variable for more information about the current file location.
Tip: If you’re planning to move your file, you can do so by symlinking to this path and setting the aforementioned variable.
In local_settings.py, you’ll see a field called DEFAULT_CACHE_POLICY.
It should be located around line 70 in the default code. It is a list of tuples specifying minimum query time ranges. These tuples are then mapped to the cache duration for the results. This is done in order to cache larger queries for longer periods. An example configuration is shown below. All times are in seconds.
DEFAULT_CACHE_POLICY = [(0,60), # default is 60 seconds
(7200,120), # >=2 hour queries are cached 2 minutes
(21600,180)] # >=6 hour queries are cached 3 minutes
This piece of code signifies that the default cache time is 60 seconds for any query between 0 seconds to 2 hours. For a query ranging from 2 hours to 6 hours, the time is set to 2 minutes and for greater than 6 hours, it is 3 minutes.
If you leave the field empty or undefined, the queries will be cached according to the DEFAULT_CACHE_DURATION which again is set to have an initial value of 60 seconds. To learn more about the parameters defined in the local_settings.py and their initial layout, visit this documentation provided by Graphite.
Graphite version
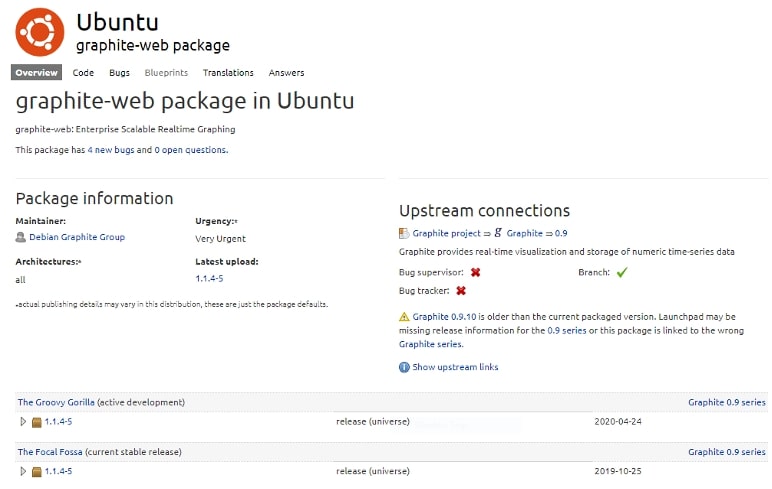
Graphite Metrics delays are often associated with the version of Graphite Web Application currently installed on your system. To check for the latest uploads (Ubuntu), visit the launchpad’s official page (snippet shown below).
These delays seem to be correlated with Graphite Version 0.9.12. If you’re using 0.9.12, it is recommended to replace your util.py file with this GitHub file patched for caching bugs. It helps avoid graphite metrics delay while rendering the graphs. The default location of the util.py file is
/usr/lib/python2.7/dist-packages/graphite/util.py
Make sure to back up your original file for future use. Ensure that you restart Apache after the replacement.
If it still does not fix the delay, the problem might be due to various other reasons and not Graphite. To verify your installation and version details, visit here for a detailed explanation.
Caching
When rendering large amounts of requests per minute, performance becomes an issue. This problem seems to be quite transparent as the web application is CPU-bound. Increasing the number of requests rendering only adds to the bottleneck resulting in graphite metrics delay.
This operation becomes expensive when different users across the server issue identical requests and each time a browser is loaded, the same number of requests just add to the stack.
The quickest way to take off this load from Graphite is to render each graph only once and then serve a copy of it to every subsequent user. There is a service for just that - Memcached.
What is Memcached?
Memcached is a caching mechanism that stores key-value pairs just like an ordinary hash table. This network service is proven to be beneficial because expensive queries such as rendering a graph can now be stored and retrieved at a much faster rate thereby reducing the overall delay.
Of course, we do not want our dashboard to return the same stale graphs for eternity.
For the same reason, fortunately, Memcached can be configured to expire the cached graphs after a short period. Even these few seconds count towards reducing the burden since duplicate requests seem to be a mundane thing.
How to enable Memcache Options?
To enable your Memcached Options, go to your local_settings.py file. If you’re not sure where to find it, revisit the heading Intentional Delay (Method 2) of this blog post or click this link. This file is about 400 lines long. Depending on the version you are using, at line 60, you will find Memcache settings as shown below.
#memcache settings
MEMCACHE_HOSTS = []
DEFAULT_CACHE_DURATION = 60 #cached for one minute by default
LOG_CACHE_PERFORMANCE = False
Note: (dependant on version no.) You may see MEMCACHE_HOSTS on line 61 which has a default as shown below. DEFAULT_CACHE_DURATION on line 68. LOG_CACHE_PERFORMANCE on line 38 and is default set to "true".
The variable MEMCACHE_OPTIONS is set to {} or { 'socket_timeout': 0.5 } by default. The available options for this parameter depend on the Memcached implementation and the Django version you are currently using. For Django version 1.10 or earlier, this option is used only for pylibmc. Starting from 1.11, it can be used for both python-memcached and pylibmc.
Your cache settings should look like this for a Memcached running on Localhost (127.0.0.1), Port 11211 using the python-memcached binding.
CACHES = {
    'default': {
        'BACKEND': 'django.core.cache.backends.memcached.MemcachedCache',
        'LOCATION': '127.0.0.1:11211',
    }
}
The second parameter to be set is MEMCACHE_HOSTS which may have an initial value of []. This option enables you to cache rendered images and calculated targets. In the case of multiple hosts, provide a list of values separated by a comma. For instance:
MEMCACHE_HOSTS = ['10.10.10.10:11211', '10.10.10.11:11211', '10.10.10.12:11211']
Note: If you happen to run a cluster of Graphite Webapps, each web app should have the same set of values assigned to this parameter to avoid unnecessary cache misses.
In case you get server errors by adding the above lines of code, verify your installation of Memcached and the permissions of the package as well.
If you are still getting errors, it is best to check out Common Graphite Issues.
Carbon Hashing & Go-Carbon
The earlier version of Graphite only supported carbon_ch hashing which led to a great time difference between the arrival and retrieval of metrics when working with large amounts of data. Thanks to the active open-source community of Graphite, we now have merged repositories providing support for fnv1a_ch hashing as well.
If you’re using a Graphite version 0.9.x or older, it’ll be a good idea to switch to this merged repository. The older repository resulted in a cache miss upon using a hashing algorithm other than carbon_ch, hence contributing to an additional graphite metrics delay.
Change the default Hashing Algorithm
In case you’re using the latest version and still getting issues due to Carbon, you could try a different Hashing Algorithm such as fnv1a_ch which supports the Fowler-Noll-Vo Hash Function.
To edit your hashing choices, go to local_settings.py. Around line 350, you will see a variable named CARBONLINK_HASHING_TYPE which has a default value of carbon_ch. Change it to fnv1a_ch like this:
CARBONLINK_HASHING_TYPE = 'fnv1a_ch'
For more settings including timeout options for the Carbon cache or adding multiple hosts if your application runs on more than one Carbon cache, it is advisable to visit the Graphite documentation dedicated to this very purpose.
Go-Carbon
Another solution could be to replace the default carbon with go-carbon, a Golang implementation of Carbon. It has proven to be faster than the traditional implementation.
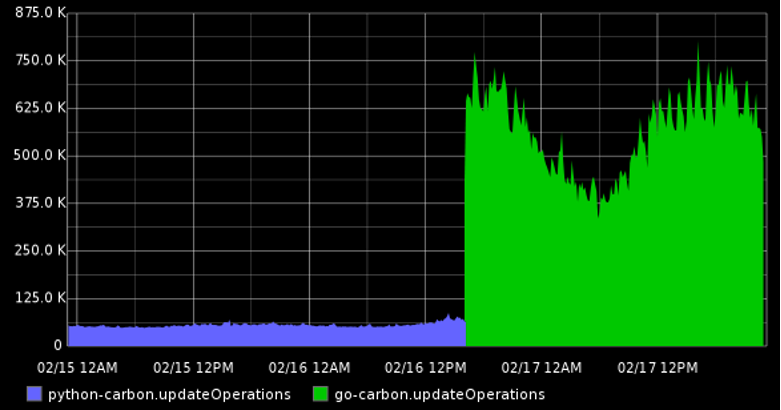
A comparison between the default-carbon (implemented in Python) and go-carbon on a server having a load of up to 900 thousand metrics/minute (shown above).
To download the repository, click here
Conclusion
To summarize this article, we explored four different possibilities of Graphite metrics delay and how to deal with each one of them. If you’re still unsure about this open-source tool and looking to set up your dashboards with minimal configuration, do try out MetricFire and select a date and time to talk to our experts to gain in-depth insights into your environments.
Why wait when you can sign up for a free trial and even book a free demo session today?


