
Table of Contents
Great systems are not just built. They are monitored.
MetricFire runs Graphite and Grafana as a fully managed service for growing engineering teams, taking care of storage, scaling, and version updates so your team doesn't have to. Plans start at $19/month, billed per metric namespace rather than per host, and include engineer-staffed support. Integrations work natively with Heroku, AWS, Azure, and GCP, and data is stored with 3× redundancy in SOC2- and ISO:27001-certified data centres.
What is Prometheus - Introduction
In recent times, Prometheus has become the standard for application monitoring in the tech space. But what exactly is Prometheus? Over the course of this article, we’ll touch on various subtopics to help answer this question, ranging from where it all started, to its architecture and how exactly it does monitoring. We'll address the various possible integrations/tools that can be used alongside Prometheus, and why Prometheus is a great tool for monitoring these platforms and applications.
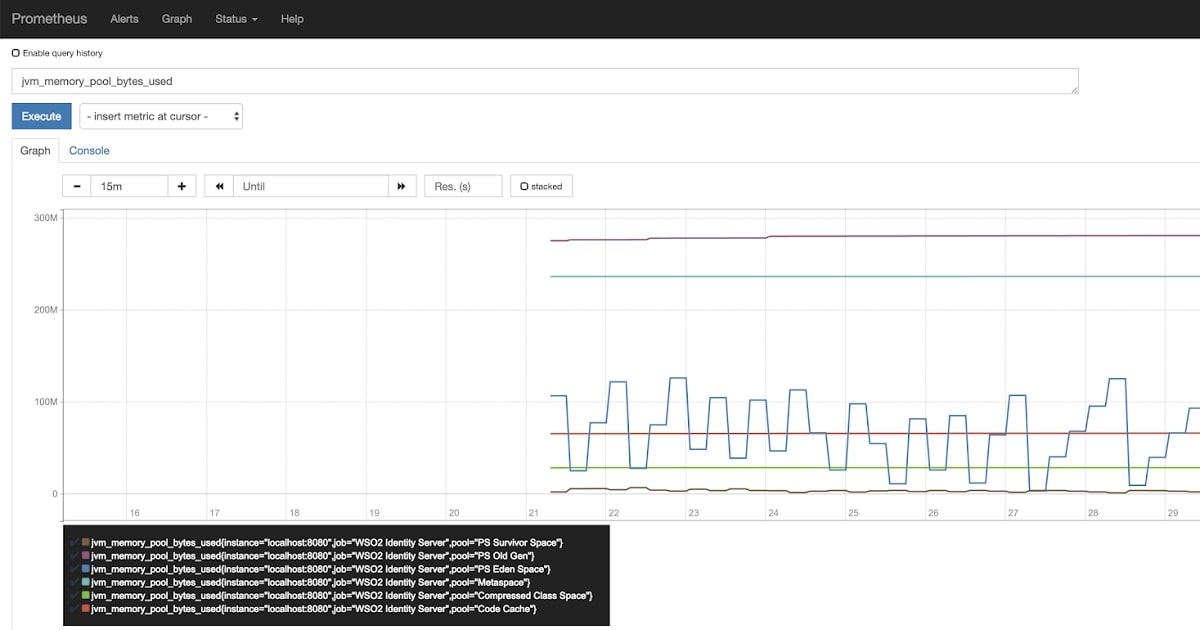
To start, this is what bare-bones Prometheus looks like - it's called the Prometheus Expression Browser:
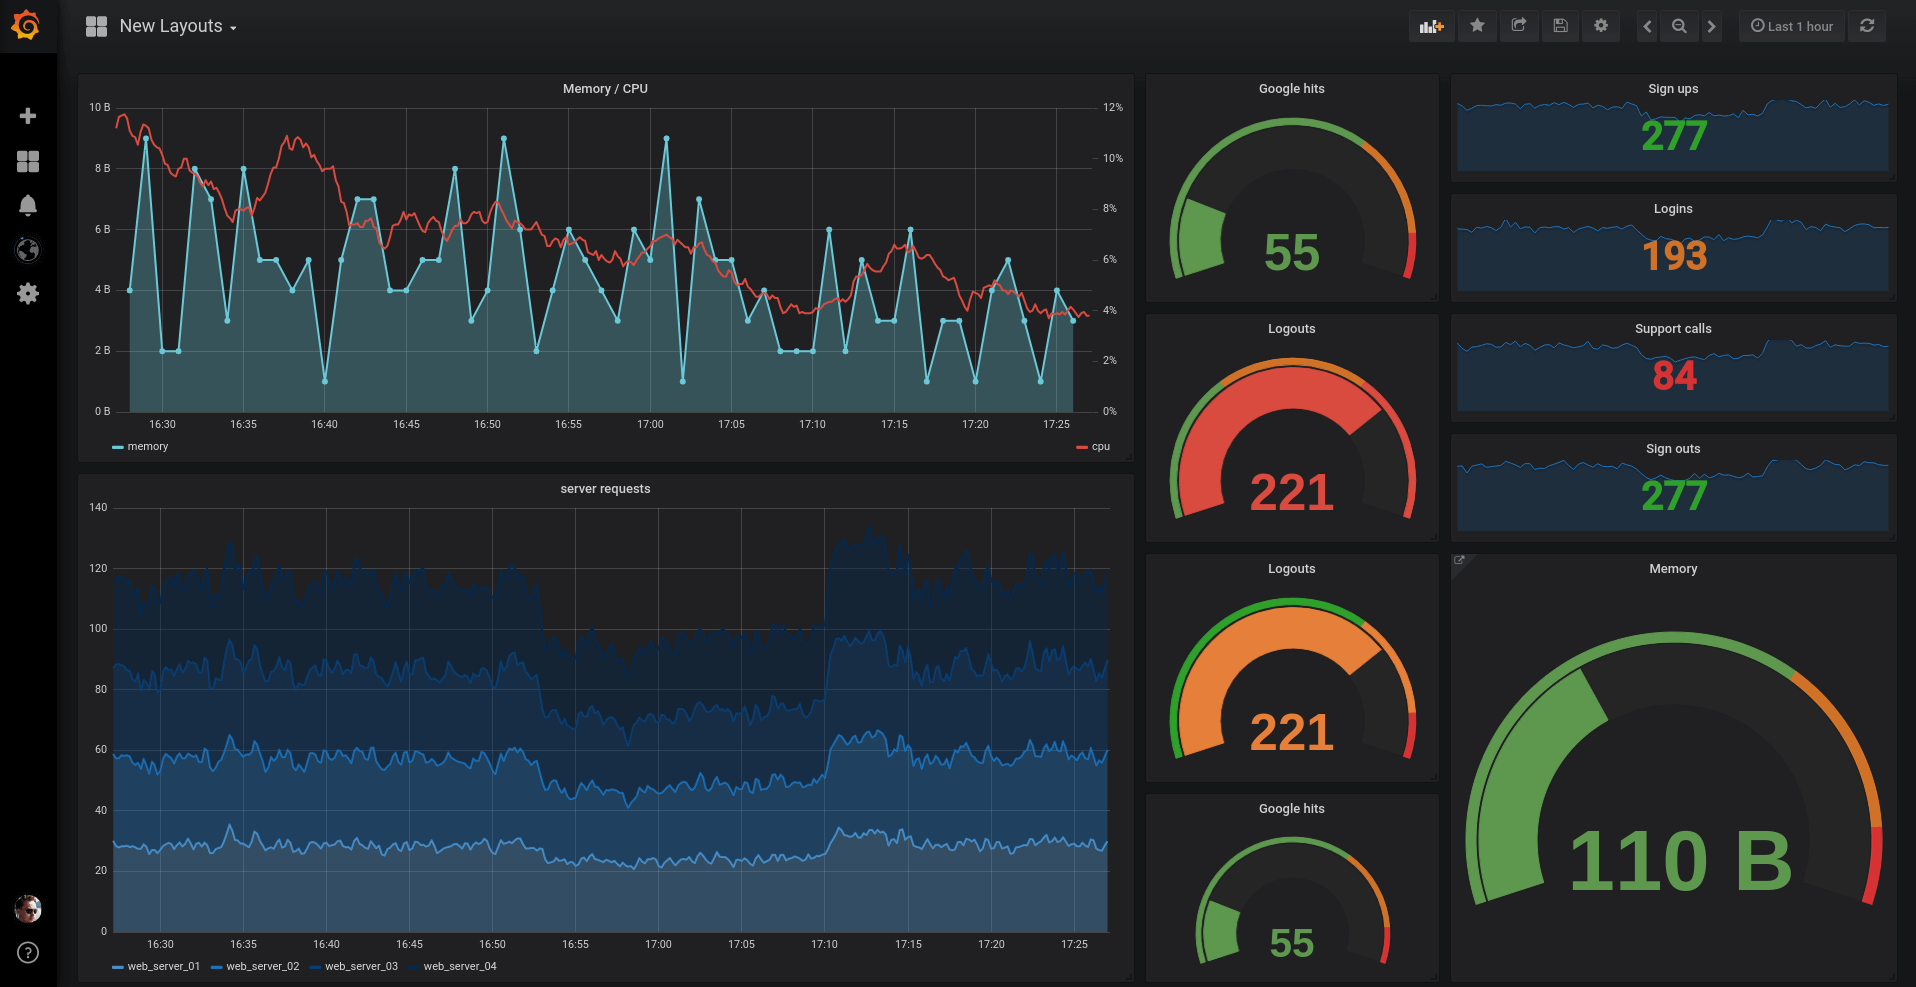
However, Prometheus is usually used along side Grafana. Grafana is a visualization tool that pulls Prometheus metrics and makes it easier to monitor. So often, when people talk about their Prometheus monitoring, especially when it comes to the visualizations, it looks like this:
MetricFire is a Hosted Prometheus platform - so if you want to check out Prometheus for yourself, you can sign up for the MetricFire free trial! You can send metrics in to the MetricFire platform and visualize them in Grafana dashboards.
What is Prometheus - The History
Prometheus was started at SoundCloud in 2012 as an open source project, after discovering that the metrics and monitoring tools they used at the time (StatsD and Graphite) were not sufficient for their monitoring needs. Gathering inspiration from the monitoring tool Borgmon (which was used at Google at the time), they identified specific needs crucial for their monitoring purposes.
For example, they needed a multi-dimensional data model, operational simplicity, scalable data collection, and a powerful query language. They built Prometheus to encompass all these features into a single tool. The resulting tool grew so successful that it was accepted into the CloudNative Computing Foundation in 2016 as its second incubated project, behind Kubernetes.
What is Prometheus - Architecture
Prometheus is composed of multiple components, each of them providing a specific function, vital to Prometheus’ broader monitoring and alerting mission. These components include:
- The Prometheus Server: This is the brain of the system. It collects metrics in the form of time series data from nodes and stores them. The process of collecting metrics is referred to as scraping.
Prometheus metrics are stored in the time series format, which is basically a sequence of data points taken at successive equally spaced points in time (usually in milliseconds). Metrics can then be uniquely identified and queried using the metric name or a combination of the metric name and optional key-value pairs called labels. Using labels enables you to differentiate or aggregate certain characteristics of a metric which you want measured separately from the metric as a whole. This in turn creates a whole new time series identified by a combination of the metric name and the label.
For example, say you want a way to track the number of http requests for various pages in your application, according to their path. One way to do this is to create multiple metrics, each corresponding to each path, for example http_requests_login_total, http_requests_logout_total, http_requests_adduser_total, http_requests_comment_total to track http requests to the login page, logout page, addUser page and comment page respectively. However, in a situation where you need to query for the total http requests from your application, this becomes cumbersome because you would then have to know each of the paths in your app, and query for all their metrics. However, with labels, you could set up a single metric, say http_requests_total and add a “path” label to it, for example, http_requests_total{path="/login"}. This would allow you to query for the total requests by simply omitting the “path” label from the query, or query for the requests to a certain page by simply adding the path to that page in the format described above.
For more information about querying the Prometheus server, check out our intro to PromQL here.
The Prometheus server actively pulls (scrapes) metrics from applications it monitors at intervals (scrape interval) as opposed to other tools like Graphite which passively wait for the applications to push their metrics. This model relieves clients of most of the workload, since the Prometheus server does all the heavy lifting. All they have to do is expose their metrics in a way that the Prometheus server can access. They do this by exposing an HTTP endpoint, usually /metrics, which returns the full list of metrics (with accompanying label sets) and their values.
- Client Libraries and Exporters: Earlier, I mentioned clients simply have to expose their metrics for Prometheus to scrape, but this data has to be in a format that Prometheus understands. Prometheus stores data in a time series format, and only accepts data of that form. Hence, the metrics exposed by clients have to be in this format for Prometheus to scrape. However, time series formatted metrics do not typically spring forth from applications; usually, instrumentation that produces these types of metrics would have to be manually added. This can be done in two ways, depending on whether you control and can modify the source code for the application whose metrics you want sent to Prometheus.
In the case where you control the source code, with very few lines of code, you can define and add your desired metrics using Prometheus’ client libraries in a process called direct instrumentation. Client libraries handle all the essential details, such as bookkeeping or thread-safety, and sends out your metrics in a format that can be directly scraped by Prometheus, leaving the user with very little to do. Most libraries also provide certain metrics such as CPU usage and garbage collection statistics out of the box depending on the runtime environment and the library being used.
In the case where you have no control over the source code, direct instrumentation is not an option. Take for example, you want some metric information about the Linux kernel. Although the kernel would likely have some mechanism to output metric information, it's highly unlikely that this data would be in a format that can be understood and scraped by Prometheus. But we can’t use client libraries in this case to export the metrics because we have no access to the source code for the linux kernel. In this case, we use exporters. Exporters are pieces of software that you can deploy alongside applications whose metrics you’re interested in and you can find more about them in this MetricFire article.
- Push Gateway: What if you have short lived or batch jobs whose lifespan is shorter than the scrape interval? That is, your job starts running and completes before Prometheus has a chance to scrape metrics. How then do you collect metrics for such jobs? The Push Gateway, baby! The Prometheus Push Gateway exists solely to allow short lived jobs to expose their metrics to Prometheus. Since these kinds of jobs may not exist long enough for Prometheus to scrape them, they can instead push their metrics to a Push Gateway, which acts as kind of a metric cache, holding them long enough so they can be scraped by Prometheus. See this MetricFire blog article on how to use a Push Gateway.
- Alertmanager: Although Prometheus is best known for its metric collection, all that data would be useless if it does not prompt action. The Prometheus Alertmanager allows you to define your own alerts on the collected metrics, so that you can be notified in case of any abnormalities or discrepancies in the data collected. The Alertmanager can be configured to group certain alerts of the same type, suppress certain alerts based on other alerts. For example, an alert is firing indicating that a cluster is down - based on this, Alertmanager can be configured to suppress all other alerts coming from that cluster, and many other advanced use cases. Using various available integrations, the alert manager can be used to send alerts directly via SMS, email, Slack, PagerDuty, etc.
- Visualization: The metrics collected by Prometheus are stored locally in a time series database. With the help of the Prometheus Query Language (PromQL), a user can select and aggregate existing time series data in real time. The result of this can either be shown as graphs or tabular data in the Prometheus Expression Browser or be used to feed an external visualization integration via the use of an HTTP API. The external integration of choice for Prometheus visualization would be Grafana.
However, as Prometheus remains an open source project, you would manually have to set up each of these components, and maintain them to ensure they provide the value described above. To try out a cloud hosted version of Prometheus reach out to the MetricFire team today for a demo, or try it out for yourself on a free trial.
What is Prometheus - Use cases
Prometheus has gained a reputation as the de facto monitoring software in recent times. Its ease of use, versatility and literally endless integration options make it a favorite in the monitoring and alerting community. It fits well with IoT, cloud monitoring and literally any other monitoring use case you could think of. However, one situation Prometheus where Prometheus doesn't thrive is in a push based metric collection use case. There are some workarounds, as you can see in our article Monitoring a Python Web App with Prometheus.
Although it has the Pushgateway to handle pushed metrics, the Pushgateway is not capable of converting Prometheus into a push-based monitoring system. Its sole purpose is to serve as some sort of metric cache for short lived jobs as explained above. Apart from this, I’d say Prometheus would handle pretty much anything you throw at it, and thrive while doing it.
What is Hosted Prometheus by MetricFire
Prometheus is an incredibly powerful application, but it does entail a fair amount of installation and configuration to get it up and running. Also, given that Prometheus is open source in nature, you would probably have to handle maintenance and updates manually - you'll need to have a dedicated team of engineers to handle this.
All that extra operating cost completely goes away when you switch to a hosted version of Prometheus, like the one offered by MetricFire. With no maintenance to worry about, you can easily use and scale Prometheus right off the bat. And with the MetricFire team handling all updates behind the scenes, you can be rest assured that you’ll always have the most recent version of Prometheus each time you log in. Take our Hosted Prometheus offering for a spin today, with a free trial or speak to us for a demo.


