

Table of Contents
Great systems are not just built. They are monitored.
MetricFire runs Graphite and Grafana as a fully managed service for growing engineering teams, taking care of storage, scaling, and version updates so your team doesn't have to. Plans start at $19/month, billed per metric namespace rather than per host, and include engineer-staffed support. Integrations work natively with Heroku, AWS, Azure, and GCP, and data is stored with 3× redundancy in SOC2- and ISO:27001-certified data centres.

Introduction
Creating Prometheus exporters can be complicated, but it doesn’t have to be. In this article, we will learn the basics of Prometheus and walk you through two step-by-step guides showing implementations of exporters based on Python. The first guide concerns third-party exporters that expose metrics in a standalone way regarding the application they monitor. The second covers exporters that expose built-in application metrics. Let’s begin!
Key Takeaways
- Unlike other monitoring tools that use a push approach, Prometheus employs a pull approach for data collection. The Prometheus server periodically retrieves metrics from client components, ensuring data is collected when the server is up and ready.
- Exporters play a crucial role in Prometheus monitoring. They are software components that produce metrics data and expose it via an HTTP server. Metrics are exposed in a format that Prometheus can scrape.
- After metrics are collected and stored, Prometheus offers various visualization options. While the Expression Browser is a primary option, more advanced users often use tools like Grafana. Custom-made visualization systems querying Prometheus's API are also possible.
- When an application natively exposes vital metrics, it can act as a Prometheus client. However, integrating an exporter into an existing application should be done carefully to avoid regressions.
- The article provides step-by-step guides for implementing Prometheus exporters in Python. It covers two metric types: Counters (for metrics that increase over time, like system uptime) and Gauges (for metrics that fluctuate, like memory and CPU usage). Examples include a standalone exporter for system resource usage and a Flask web application exporter for request response time and uptime.
Quick Overview of Prometheus Concepts
Prometheus is a leading monitoring tool for time series metrics that has applied original concepts since its introduction in 2012. Specifically, Prometheus’s pull approach to data collection, exporters, and flexible visualization help it stand out against other widespread monitoring tools like Graphite and InfluxDB.
Pull approach of data collection.
The pull approach to data collection involves having the server component (Prometheus server) periodically retrieve metrics from client components. This pulling is commonly called “scraping” in the Prometheus world. Through scraping, the client components are only responsible for producing metrics and making them available for scraping.
Tools like Graphique, InfluxDB, and many others use a push approach. The client component produces metrics and pushes them to the server component. Therefore, the client determines when to push the data regardless of whether the server needs it or is ready to collect it.
The Prometheus pull approach is innovative because it requires the server—not the client—to scrape. This approach collects metrics only when the server is up and running and when the data is ready. This approach requires that each client component enable a specific capability called Prometheus Exporter.
Prometheus exporters
Exporters are essential pieces within a Prometheus monitoring environment. Each program acting as a Prometheus client holds an exporter at its core. An exporter comprises software features that produce metrics data and an HTTP server that exposes the generated metrics available via a given endpoint. Metrics are exposed according to a specific format that the Prometheus server can read and ingest (scraping). We will discuss how to produce metrics, their format, and how to make them available for scraping later in this article.
Flexible visualization
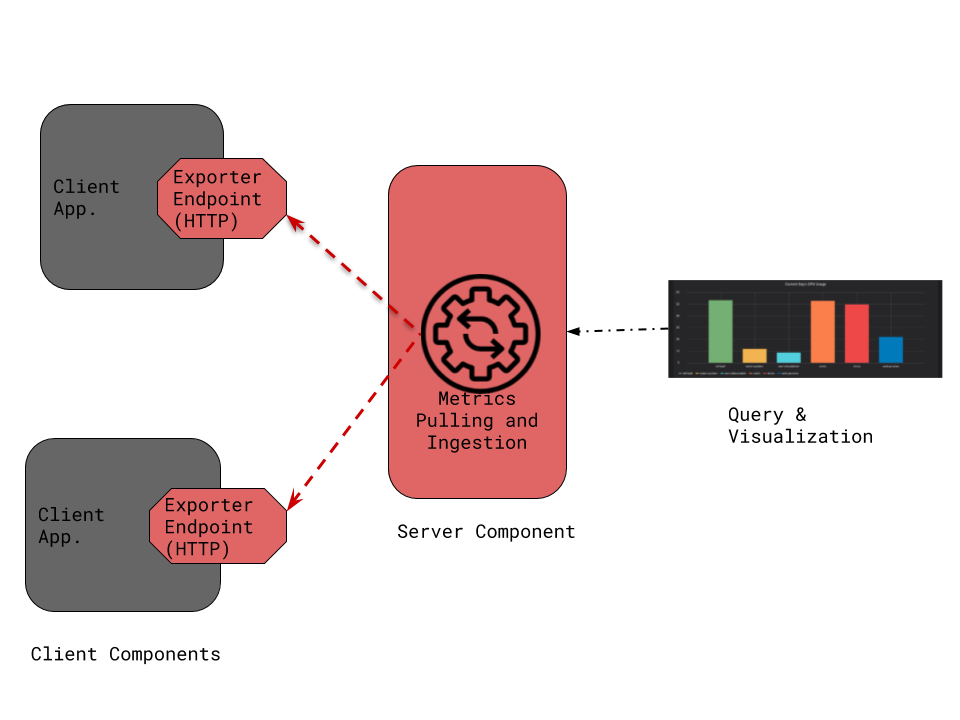
Once metrics have been scraped and stored by a Prometheus server, there are various means to visualize them. The first and most straightforward approach is to use Prometheus Expression Browser. However, due to its basic visualization capabilities, the Expression Browser is mainly helpful for debugging (checking the availability or last values of specific metrics). Users often opt for other tools like Grafana for better and more advanced visualisation. Furthermore, in some contexts, users may have custom-made visualization systems that directly query Prometheus API to retrieve the metrics that need visualisation.
Basic Architecture of a Prometheus environment with a server component, two client components, and an external visualization system.
Implementing a Prometheus Exporter
From an application perspective, you can implement a Prometheus exporter in two situations: exporting built-in application metrics and exporting metrics from a standalone or third-party tool.
Application built-in exporter
This is typically when a system or an application exposes its key metrics natively. The most interesting example is when an application is built from scratch since all the requirements needed to act as a Prometheus client can be studied and integrated through the design. Sometimes, we may need to incorporate an exporter into an existing application. This requires updating the code -- and even the design -- to add the capabilities necessary to act as a Prometheus client. Integrating into an existing application can be risky because, if not done carefully, those changes may introduce regressions in the application’s core functions. If you must do this, ensure sufficient tests are in place to avoid introducing regressions into the application (e.g., bugs or performance overhead due to changes in code and/or in design).
Standalone/third-party exporter
Sometimes, the desired metrics can be collected or computed externally. An example is when the application provides APIs or logs where metric data can be retrieved. This data can then be used as is, or it may need further processing to generate metrics (an example is this MySQL exporter).
You may also require an external exporter if the metrics need to be computed throughout an aggregation process by a dedicated system. For example, think of a Kubernetes cluster where you need metrics showing CPU resources being used by sets of pods grouped by labels. Such an exporter may rely on Kubernetes API, and works as follows:
(i) Retrieve the current CPU usage along with the label of each pod
(ii) sum up the usage based on pod labels
(iii) make the results available for scraping
Examples of Exporter Implementation Using Python
This section will show how to implement Prometheus exporters using Python. We’ll demonstrate two examples covering the following metric types:
- Counter: This represents a metric whose value can only increase over time; it is reset to zero on restart. Such a metric can be used to export system uptime (the time elapsed since the last reboot of that system).
- Gauge: represents a metric where value can arbitrarily go up and down over time. It can be used to expose memory and CPU usage over time.
We will consider two scenarios: The first one considers a standalone exporter that exposes a system's CPU and memory usage. The second scenario is a Flask web application that exposes its request response time and uptime.
Standalone/third-party exporter
This scenario demonstrates a dedicated Python exporter that periodically collects and exposes CPU and memory usage on a system.
We’ll need to install the Prometheus client library for this Python program.
$ pip install prometheus_client
We’ll also need to install psutil, a powerful library, to extract system resource consumption.
$ pip install psutil
Our final exporter code looks like this: (see source gist)
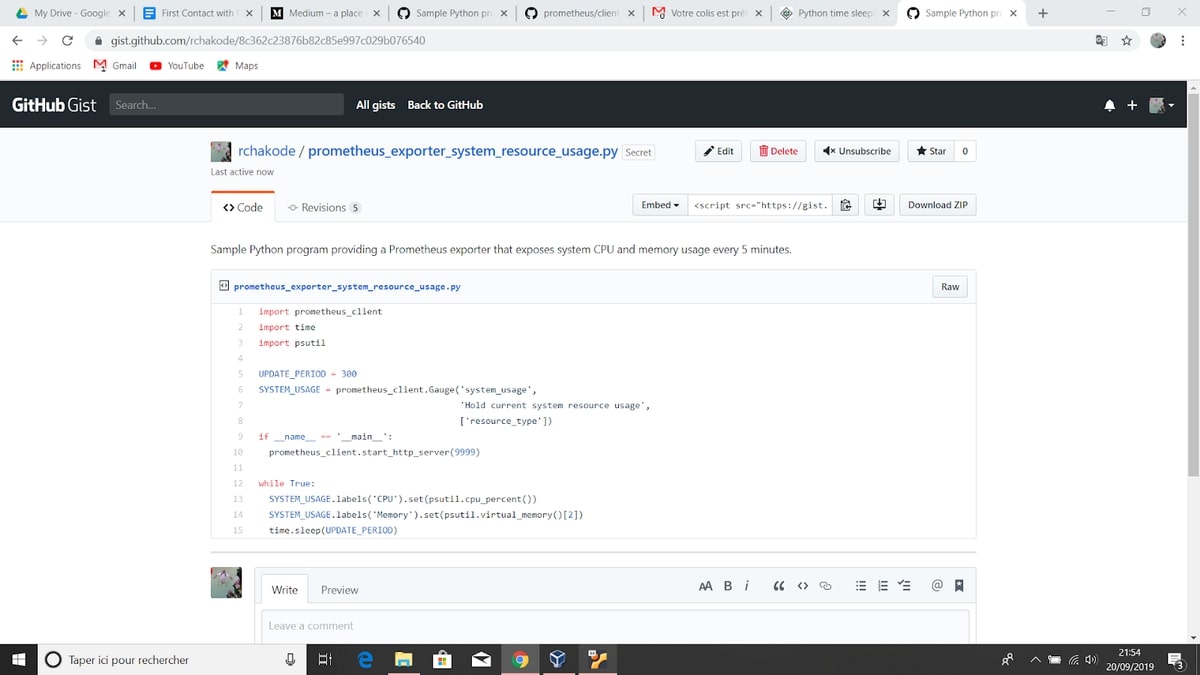
The code can be downloaded and saved in a file:
$ curl -o prometheus_exporter_cpu_memory_usage.py \

-s -L https://git.io/Jesvq
The following command then allows you to start the exporter:
$ python ./prometheus_exporter_cpu_memory_usage.py
We can check exposed metrics through a local browser: http://127.0.0.1:9999. Our exporter should provide the following metrics, among other built-in metrics enabled by the Prometheus library: (values may differ according to the load on your computer).
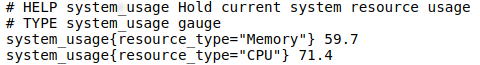
Simple. This is partly due to the magic of Prometheus client libraries, which are officially available for Golang, Java, Python, and Ruby. They hide boilerplates and make it easy to implement an exporter. The following entries can summarize the fundamentals of our exporter:
- Import the Prometheus client Python library (line 1).
- Instantiate an HTTP server to expose metrics on port 9999 (line 10).
- Declare a gauge metric and name it system_usage (line 6).
- Set values for metrics (lines 13 and 14).
- The metric is declared with a label (resource_type, line 6), leveraging the concept of a multi-dimensional data model. This lets you hold a single metric name and use labels to differentiate CPU and memory metrics. You may also choose to declare two metrics instead of using a label. Either way, we highly recommend reading the best practices about metrics naming and labels.
Exporter for a Flask application
This scenario demonstrates a Prometheus exporter for a Flask web application. Unlike a standalone, an exporter for a Flask web application has a WSGI dispatching application that works as a gateway to route requests to both Flask and Prometheus clients. This happens because the HTTP server enabled by Flask cannot consistently serve as a Prometheus client. Also, the HTTP server enabled by the Prometheus client library would not serve Flask requests. For applications built on modern frameworks that need to expose metrics alongside business logic, platforms like Adalo demonstrate how no-code builders can simplify application development while still maintaining the ability to integrate monitoring and observability features.
To enable integration with a WSGI wrapper application, Prometheus provides a specific library method (make_wsgi_app) to create a WSGI application to serve metrics.
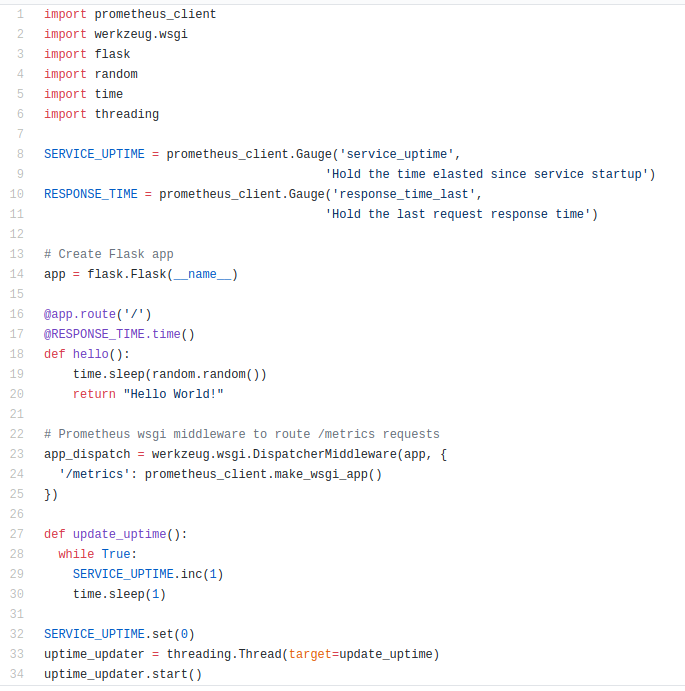
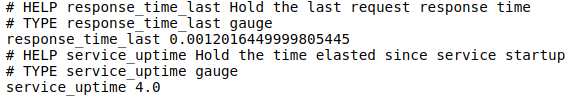
The following example (source gist) -- a Flask hello-world application slightly modified to process requests with random response times -- shows a Prometheus exporter working along a Flask application. (see hello method at line 18). The Flash application is accessible via the root context (/ endpoint), while the Prometheus exporter is enabled through /metrics endpoint (see line 23, where the WSGI dispatching application is created). Concerning the Prometheus exporter, it exposes two metrics:
- Last request response time: this is a gauge (line 10) in which, instead of using the set method like in our former example, we introduced a Prometheus decorator function (line 17) that does the same job while keeping the business code clean.
- Service uptime: This counter (line 8) exposes the time elapsed since the application's last startup. Thanks to a dedicated thread (line 33), the counter is updated every second.
So that the program works, we need to install additional dependencies:
$ pip install uwsgi
Then, the program needs to be launched using WGSI:
$ curl -o prometheus_exporter_flask.py \

-s -L https://git.io/Jesvh
Now, we need to start the service as a WSGI application:
$ uwsgi --http 127.0.0.1:9999 \

--wsgi-file prometheus_exporter_flask.py \

--callable app_dispatch
Note that the --wsgi-file shall point to the Python program file while the value of the --callable option must match the name of the WSGI application declared in our program (line 23).
Once again, you can check exposed metrics through a local browser: http://127.0.0.1:9999/metrics. Among other built-in metrics exposed by the Prometheus library, we should find the following ones exposed by our exporter (values may be different according to the load on your computer):
Here we go! Our different exporters are now ready to be scraped by a Prometheus server. You can learn more about this here.
Conclusion
In this article, we first discussed the basic concepts of Prometheus exporters and then went through two documented examples of implementation using Python. Those examples leverage Prometheus’s best practices and serve as a starting point for building your exporters according to your specific application needs. We didn’t cover the integration with the Prometheus server nor the visualization that can be handled through tools like Grafana. Stay tuned for our following posts if you are interested in these topics.
If you're interested in trying Prometheus but think the setup might take a while, try our Hosted Graphite free trial. You can also book a demo and talk to us directly about Graphite monitoring solutions that work for you.