
Table of Contents
Great systems are not just built. They are monitored.
MetricFire runs Graphite and Grafana as a fully managed service for small engineering teams, taking care of storage, scaling, and version updates so your team doesn't have to. Plans start at $19/month, billed per metric namespace rather than per host, and include engineer-staffed support. Integrations work natively with Heroku, AWS, Azure, and GCP, and data is stored with 3× redundancy in SOC2- and ISO:27001-certified data centres.
Introduction
This article is a full tutorial on HAProxy monitoring and the best tools to get it done right. We will be looking into how to collect HAProxy metrics using a collectd daemon, push them into Graphite and visualize them in Grafana.
To follow the steps in this blog, sign up for the MetricFire free trial, where you can use Graphite and Grafana directly on our platform. MetricFire is a hosted Graphite and Grafana service, where we do the setup and management of these open-source tools so you don’t have to.
Key Takeaways
- HAProxy is a popular load balancer for HTTP and TCP applications, used by high-traffic websites like Airbnb, Instagram, and Reddit.
- Effective monitoring infrastructure is crucial for DevOps teams managing HAProxy to monitor traffic, response times, and other metrics.
- To enable HAProxy to emit metrics, you can configure it to use a stats socket or a stats page. Access to the stats page should be restricted due to its potential impact on infrastructure.
- Collectd, a lightweight daemon written in C, can be used to poll HAProxy metrics and push them to a custom source like Graphite.
- Configuring Collectd to poll HAProxy metrics involves defining a plugin configuration section in Collectd's configuration file.
- Collectd can also push metrics to Hosted Graphite using the Write Graphite plugin, which requires specifying the Graphite host, port, and prefix.
- Collectd HAProxy Plugin supports various metrics, including connection rate, request rate, response codes, error rates, queue statistics, and more.
Introduction to HAProxy
HAProxy is one of the most popular load balancers for HTTP and TCP applications. Along with load balancing, it comes with various features such as health checks, Web Application Firewall (WAF) capabilities, bot protection, and DDoS protection.
HAProxy is highly performant and hence it’s used as a load balancer for high-traffic websites serving millions of requests per second such as Airbnb, Instagram, and Reddit. It is imperative that DevOps teams for such websites need highly efficient monitoring infrastructure to monitor the traffic, response times, and various other metrics related to HAProxy.
In this article, we will be running a simple Node.js application, scale it to run multiple instances and finally load balance it behind HAProxy.
Enabling HAProxy to emit metrics
In its default configuration, HAProxy does not emit metrics that can be pushed to Graphite. This is obviously a big blocker for doing HAProxy monitoring. Hence, it's important to configure HAProxy to enable a stats socket through which metrics related to HAProxy can be read by other applications.
Enabling the stats socket is as simple as adding the following line in the global section of the HAProxy configuration (by default located at /etc/haproxy/haproxy.cfg)
global
	stats socket /run/haproxy/haproxy.sock
If required, we can also enable the stats page through the following configuration. However, keep in mind that the stats page allows the user to disable and enable backends and hence can cause major changes to the infrastructure. Therefore, its access should be highly restricted.
listen stats :1936
    mode http
    stats enable
    stats hide-version
    stats realm Haproxy\ Statistics
    stats uri /
    stats auth Username:Password
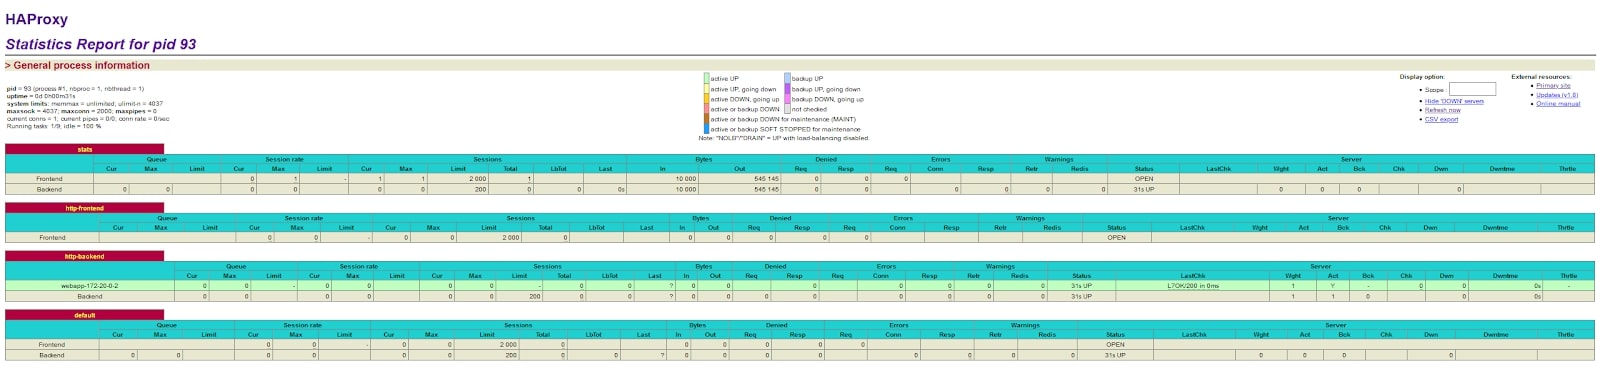
HAProxy Stats Page
Verify HAProxy Socket Metrics
Once the HAProxy stats socket has been enabled, make sure to reload the configuration using “sudo service haproxy reload”. If you are serving a very high-traffic website, we recommend running this command only during planned downtime to avoid any potential disruption to the live traffic.
Once the HAProxy configuration has been reloaded, run the following command on the HAProxy server to verify its emitting metrics.
echo "show stat" | nc -U /var/run/haproxy.sock
It should produce a similar output as below:
# pxname,svname,qcur,qmax,scur,smax,slim,stot,bin,bout,dreq,dresp,ereq,econ,eresp,wretr,wredis,status,weight,act,bck,chkfail,chkdown,lastchg,downtime,qlimit,pid,iid,sid,throttle,lbtot,tracked,type,rate,rate_lim,rate_max,check_status,check_code,check_duration,hrsp_1xx,hrsp_2xx,hrsp_3xx,hrsp_4xx,hrsp_5xx,hrsp_other,hanafail,req_rate,req_rate_max,req_tot,cli_abrt,srv_abrt,comp_in,comp_out,comp_byp,comp_rsp,lastsess,last_chk,last_agt,qtime,ctime,rtime,ttime,agent_status,agent_code,agent_duration,check_desc,agent_desc,check_rise,check_fall,check_health,agent_rise,agent_fall,agent_health,addr,cookie,mode,algo,conn_rate,conn_rate_max,conn_tot,intercepted,dcon,dses,
stats,FRONTEND,,,0,1,2000,2,4402,261854,0,0,0,,,,,OPEN,,,,,,,,,1,2,0,,,,0,0,0,1,,,,0,12,0,1,0,0,,0,5,13,,,0,0,0,0,,,,,,,,,,,,,,,,,,,,,http,,0,1,2,12,0,0,
stats,BACKEND,0,0,0,0,200,0,4402,261854,0,0,,0,0,0,0,UP,0,0,0,,0,721,,,1,2,0,,0,,1,0,,0,,,,0,0,0,0,0,0,,,,0,0,0,0,0,0,0,689,,,0,0,0,5,,,,,,,,,,,,,,http,roundrobin,,,,,,,
http-frontend,FRONTEND,,,0,1,2000,1,0,188,0,0,1,,,,,OPEN,,,,,,,,,1,3,0,,,,0,0,0,1,,,,0,0,0,1,0,0,,0,1,1,,,0,0,0,0,,,,,,,,,,,,,,,,,,,,,http,,0,1,1,0,0,0,
http-backend,webapp-172-18-0-2,0,0,0,0,,0,0,0,,0,,0,0,0,0,UP,1,1,0,0,0,721,0,,1,4,1,,0,,2,0,,0,L7OK,200,0,0,0,0,0,0,0,,,,,0,0,,,,,-1,OK,,0,0,0,0,,,,Layer7 check passed,,2,3,4,,,,172.18.0.2:3000,,http,,,,,,,,
http-backend,BACKEND,0,0,0,0,200,0,0,0,0,0,,0,0,0,0,UP,1,1,0,,0,721,0,,1,4,0,,0,,1,0,,0,,,,0,0,0,0,0,0,,,,0,0,0,0,0,0,0,-1,,,0,0,0,0,,,,,,,,,,,,,SRV_ID,http,roundrobin,,,,,,,
default,FRONTEND,,,0,0,2000,0,0,0,0,0,0,,,,,OPEN,,,,,,,,,1,5,0,,,,0,0,0,0,,,,0,0,0,0,0,0,,0,0,0,,,0,0,0,0,,,,,,,,,,,,,,,,,,,,,http,,0,0,0,0,0,0,
default,BACKEND,0,0,0,0,200,0,0,0,0,0,,0,0,0,0,UP,0,0,0,,0,721,,,1,5,0,,0,,1,0,,0,,,,0,0,0,0,0,0,,,,0,0,0,0,0,0,0,-1,,,0,0,0,0,,,,,,,,,,,,,,http,roundrobin,,,,,,,
Introduction to collectd
Now that we have enabled HAProxy to emit stats, it’s time to read them and push them onto Graphite. For this, we need some sort of agent that polls HAProxy to collect stats and push it to Graphite. For this purpose, we are going to use collectd.
Collectd is a very lightweight daemon written in C which runs on the server, polls the systems such as HAProxy for metrics, and pushes it to a custom source such as Graphite. In this case, we will be using collectd to poll the HAProxy metrics and push them out to Hosted Graphite instances.
Configuring collectd to poll HAProxy
Collectd comes out of the box with various plugins to collect metrics from CPU, file system, network interface, memory, etc. In order to poll the metrics from HAProxy, collectd offers custom HAProxy plugins to poll metrics from HAProxy. Setting up this plugin is as simple as defining a Plugin configuration section for collectd and specifying the host and port where HAProxy is emitting its stats.
<Plugin "python">
	ModulePath "/usr/share/collectd/collectd-haproxy"

	Import "haproxy"

	<Module "haproxy">
    	Socket "/var/run/haproxy.sock"
    	Interval 10
    	ProxyMonitor "http-backend"
    	ProxyMonitor "backend"
    	EnhancedMetrics 'True'
    	</Module>
</Plugin>
Configure collectd to push metrics to Hosted Graphite
Now that collectd is configured to read metrics from HAProxy, we will configure it to push the same metrics to Hosted Graphite. Collectd comes with an out-of-the-box plugin called Write Graphite which allows us to push the metrics to any running Graphite instance including Hosted Graphite. Configuring this plugin is as simple as defining a plugin section with the following configuration:
LoadPlugin write_graphite

<Plugin "write_graphite">
    	<Carbon>
            	Host "carbon.hostedgraphite.com”
            	Port "2003"
            	Prefix "your-api-key.collectd."
    	</Carbon>
</Plugin>
Make sure to check out our dedicated collectd documentation page through which you can download a configuration file for collectd, prefilled with your Hosted Graphite account details.
At this point, the collectd should be successfully sending metrics to Hosted Graphite. You can verify the same by visiting Hosted Graphite and browsing to Metrics->Account Diagnostics page.
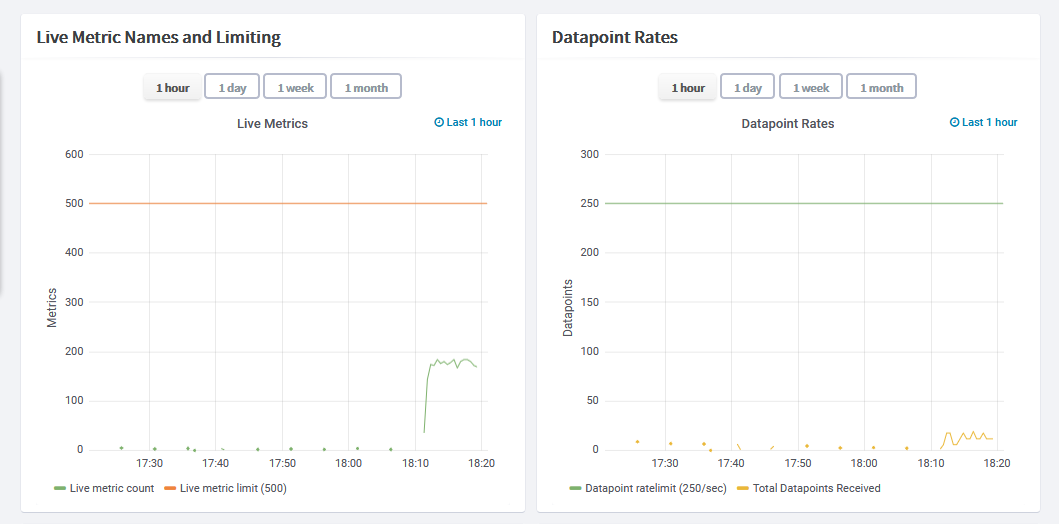
If you are unable to view these metrics in your case, double-check the configuration provided in the collect configuration and make sure that the outbound port 2003 is not blocked by a firewall configuration. If this still doesn’t help, reach out to Hosted Graphite support through the chat bubble in the Hosted Graphite window.
Plotting the metrics on Hosted Grafana
Now let’s plot these metrics into visualizations for our Hosted Grafana application - the final step in getting our HAProxy monitoring set up! Hosted Grafana is built on top of Grafana and provides us the ability to create beautiful graphs and visualizations such as gauges, bar graphs, and various other types of visualizations. It can hook into various types of data sources such as Graphite, InfluxDb, MySQL, and Elasticsearch. On top of all, it also provides alerting capabilities as well.
So, let’s log in to Hosted Graphite at https://www.hostedgraphite.com/app and browse to Dashboards -> Grafana to open the Hosted Grafana application page.
Since Hosted Grafana is part of MetricFire’s offering itself, the datasource connection between Grafana and Graphite would have been automatically done for us.
Grafana comes with a lot of pre-built dashboards as part of its Grafana dashboards library. We can either download one of the prebuilt dashboards for HAProxy monitoring or create one from scratch. In this case, we downloaded a pre-built dashboard and customized according to our needs.
Here is what it looks like:
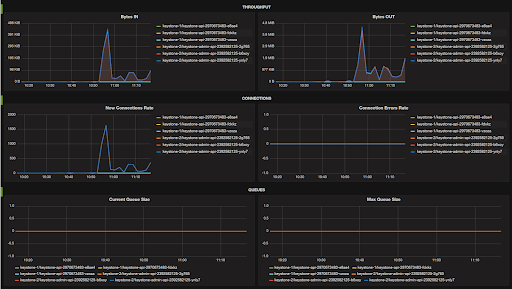
Hosted Grafana is a very powerful visualization tool built over Grafana. It allows you to create your own visualizations as well as set up alerts whenever a metric value crosses a certain threshold.
Check out our article Grafana Dashboards from Basic to Advanced to learn how to set up Grafana alerts, and build custom dashboards.
You can also create other types of visualizations based on the metrics exposed by HAProxy. Have a look at the article Our Favorite Grafana Dashboards to create some of the more advanced dashboards.
List of Metrics supported by collectd HAProxy Plugin
Collectd HAProxy supports many different types of metrics. Here is the list of metrics supported:
- Connection Rate
- Cumulative Requests
- Idle Percentage
- Current Sessions
- Session Rate
- Bytes out
- Bytes In
- Session Time Average
- Request Rate
- Session Rate
- Response 2xx
- Response 4xx
- Response 5xx
- Error Requests
- Denied Requests
- Error Connection
- Denied Response
- Current Queue
- Queue Time Average
- Response Time Average
- Error Response
- Retries
- Redispatched
- Max Connections
- Max connection Rate
- Max Session Rate
- Max SSL Connections
- Max Pipes
- Run Queue
- Piped Used
- Uptime Seconds
- Current Connections
- Current SSL Connections
- Failed Checks
- Downtime
- Response 1xx
- Response 3xx
- Queue Max
- Queue Limit
- Session Rate Limit
- Session Rate Max
- Session Total
- Session Limit
- Session Max
- Throttle
- Connect Time Average
- Active Servers
- Backup Servers
- Health check duration
- Last Session
- Connection Rate
Conclusion
In this article, we had a full tutorial on HAProxy monitoring. We looked at how we can collect HAProxy metrics using collectd and push them to Hosted Graphite and Hosted Grafana. This allows us to monitor HAProxy load balancer metrics.
Sign up here for a free trial of our Hosted Graphite and Grafana offerings. Also, if you have any questions about our products, or about how MetricFire can help your company, talk to us directly by booking a demo.


