


Table of Contents
Great systems are not just built. They are monitored.
MetricFire runs Graphite and Grafana as a fully managed service for growing engineering teams, taking care of storage, scaling, and version updates so your team doesn't have to. Plans start at $19/month, billed per metric namespace rather than per host, and include engineer-staffed support. Integrations work natively with Heroku, AWS, Azure, and GCP, and data is stored with 3× redundancy in SOC2- and ISO:27001-certified data centres.
Introduction
Monitoring SNMP (Simple Network Management Protocol) devices is crucial for maintaining network health and security, enabling early detection of issues and proactive troubleshooting. Continuous monitoring ensures efficient resource utilization, minimizes downtime, and enhances overall network performance.
In this article, we'll detail how to use the Telegraf agent to collect SNMP (MIB) performance statistics that can be forwarded to a data source.
Getting Started with the Telegraf Agent
Telegraf is a plugin-driven server agent built on InfluxDB that collects and sends metrics/events from databases, systems, processes, devices, and applications. Telegraf is written in Go, compiles into a single binary with no external dependencies, and requires minimal memory footprint. It is compatible with many operating systems and has many helpful output plugins and input plugins for collecting and forwarding a wide variety of system performance metrics.
Install Telegraf (Linux/Redhat)
/etc/telegraf/wget https://dl.influxdata.com/telegraf/releases/telegraf_1.30.0-1_amd64.deb
sudo dpkg -i telegraf_1.30.0-1_amd64.deb
RedHat/CentOS
wget https://dl.influxdata.com/telegraf/releases/telegraf-1.30.0-1.x86_64.rpm
sudo yum localinstall telegraf-1.30.0-1.x86_64.rpm
Configure an Output
You can configure Telegraf to output to various sources, such as Kafka, Graphite, InfluxDB, Prometheus, SQL, NoSQL, and more.
In this example, we will configure telegraf with a Graphite output. If you're not currently hosting your data source, start a 14-day free trial with Hosted Graphite by MetricFire to follow these next steps.
A Hosted Graphite account will provide the data source, offer an alerting feature, and include Hosted Grafana as a visualization tool.
To configure the Graphite output, locate the downloaded telegraf configuration file at /etc/telegraf/telegraf.conf and open it in your preferred text editor. Then, you will need to make the following changes to the file:
First, uncomment the line:
[[outputs.graphite]]
Next, uncomment and edit the server line to:
servers = ["carbon.hostedgraphite.com:2003"]
Finally, uncomment and edit the prefix line to:
prefix = "<YOUR_API_KEY>.telegraf"
Configure Your Running Instance of SNMP
This article assumes that you already have SNMP installed on your networking device(s), but here is a quick guide to installing/configuring SNMP in a Linux environment (specifically Ubuntu):
Install SNMP, SNMP daemon, and the MIBs package downloader (for some basic MIBs):
sudo apt install -y snmp snmpd snmp-mibs-downloader
Modify/configure the SNMP.conf file, generally located at: /etc/snmp/snmpd.conf:
# Listen for connections from the local system only
agentAddress  udp:127.0.0.1:161

# System information
sysLocation    "Server Room"
sysContact     admin@example.com
sysName        MyComputer

# Access Control
rocommunity  public

# include all available OIDs
view all included .1
Then modify/configure the snmp.conf file, generally located at: /etc/snmp/snmp.conf:
mibs:

# expose basic MIBs
mibs +IF-MIB:HOST-RESOURCES-MIB:RFC1213-MIB:DISMAN-EVENT-MIB:DISMAN-SCHEDULE-MIB:TCP-MIB:UDP-MIB:SNMPv2-SMI:SNMPv2-TC:HOST-RESOURCES-TYPES

# optionally enable interfaces
interface eth0
- Start the SNMP service/daemon: sudo service snmpd restart
- If the instance is stuck or changes to the conf files are made, you probably need to kill running SNMP processes, then restart the SNMP daemon: sudo pkill snmpd
- See all available/exposed MIBs and OIDs: snmpwalk -v2c -c public localhost .1.3.6.1
- NOTE: In the next step, you will use this list to configure the Telegraf SNMP plugin. Since we use a Graphite output (as outlined above), you can only define MIBs with numeric values (integers/counters/etc.)
Configure the Telegraf SNMP Input Plugin:
Telegraf has many input plugins that can collect a wide range of data from many popular technologies and 3rd party sources. In this example, we'll demonstrate how to connect Telegraf to a local instance of SNMP.
All you need to do is search for the inputs.nginx section in your telegraf.conf file, uncomment the [[inputs.snmp]] line, and uncomment/configure the agent's line:
[[inputs.snmp]]
   agents = ["udp://127.0.0.1:161"]
Now, you must configure SNMP fields that map to the OIDs from your SNMP walk output and define metric names.
Below is an example of a basic configuration, but your setup will likely differ depending on the OIDs defined in your snmpwalk output:
[[inputs.snmp.field]]
  oid = "HOST-RESOURCES-MIB::hrSystemUptime.0"
  name = "hrSystemUptime"

[[inputs.snmp.field]]
  oid = "SNMPv2-MIB::sysUpTime.0"
  name = "sysUpTime"

[[inputs.snmp.field]]
  oid = "DISMAN-EVENT-MIB::sysUpTimeInstance"
  name = "sysUpTimeInstance"

[[inputs.snmp.field]]
  oid = "TCP-MIB::tcpActiveOpens.0"
  name = "tcpActiveOpens"

[[inputs.snmp.field]]
  oid = "UDP-MIB::udpInDatagrams.0"
  name = "udpInDatagrams"

[[inputs.snmp.field]]
  oid = "SNMPv2-MIB::sysORLastChange.0"
  name = "sysORLastChange"

[[inputs.snmp.field]]
  oid = "IF-MIB::ifIndex.1"
  name = "ifIndex"

[[inputs.snmp.field]]
  oid = "IF-MIB::ifType.1"
  name = "ifType"

[[inputs.snmp.field]]
  oid = "IF-MIB::ifMtu.1"
  name = "ifMtu"

[[inputs.snmp.field]]
  oid = "IF-MIB::ifSpeed.1"
  name = "ifSpeed"

[[inputs.snmp.field]]
  oid = "IF-MIB::ifAdminStatus.1"
  name = "ifAdminStatus"

[[inputs.snmp.field]]
  oid = "IF-MIB::ifOperStatus.1"
  name = "ifOperStatus"

[[inputs.snmp.field]]
  oid = "IF-MIB::ifLastChange.1"
  name = "ifLastChange"

[[inputs.snmp.field]]
  oid = "IF-MIB::ifInOctets.1"
  name = "ifInOctets"

[[inputs.snmp.field]]
  oid = "IF-MIB::ifInUcastPkts.1"
  name = "ifInUcastPkts"

[[inputs.snmp.field]]
  oid = "IF-MIB::ifInNUcastPkts.1"
  name = "ifInNUcastPkts"

[[inputs.snmp.field]]
  oid = "IF-MIB::ifInDiscards.1"
  name = "ifInDiscards"

[[inputs.snmp.field]]
  oid = "IF-MIB::ifInErrors.1"
  name = "ifInErrors"

[[inputs.snmp.field]]
  oid = "IF-MIB::ifInUnknownProtos.1"
  name = "ifInUnknownProtos"

[[inputs.snmp.field]]
  oid = "IF-MIB::ifOutOctets.1"
  name = "ifOutOctets"

[[inputs.snmp.field]]
  oid = "IF-MIB::ifOutUcastPkts.1"
  name = "ifOutUcastPkts"

[[inputs.snmp.field]]
  oid = "IF-MIB::ifOutNUcastPkts.1"
  name = "ifOutNUcastPkts"

[[inputs.snmp.field]]
  oid = "IF-MIB::ifOutDiscards.1"
  name = "ifOutDiscards"

[[inputs.snmp.field]]
  oid = "IF-MIB::ifOutErrors.1"
  name = "ifOutErrors"

[[inputs.snmp.field]]
  oid = "IF-MIB::ifOutQLen.1"
  name = "ifOutQLen"

[[inputs.snmp.field]]
  oid = "SNMPv2-MIB::sysServices.0"
  name = "sysServices"

[[inputs.snmp.field]]
  oid = "SNMPv2-MIB::snmpOutGenErrs.0"
  name = "snmpOutGenErrs"

[[inputs.snmp.field]]
  oid = "RFC1213-MIB::ipForwarding.0"
  name = "ipForwarding"

[[inputs.snmp.field]]
  oid = "RFC1213-MIB::ipInAddrErrors.0"
  name = "ipInAddrErrors"

[[inputs.snmp.field]]
  oid = "HOST-RESOURCES-MIB::hrMemorySize.0"
  name = "hrMemorySize"

[[inputs.snmp.field]]
  oid = "HOST-RESOURCES-MIB::hrStorageUsed.53"
  name = "hrStorageUsed"

[[inputs.snmp.field]]
  oid = "HOST-RESOURCES-MIB::hrDeviceStatus.196608"
  name = "hrDeviceStatus"
Save the file, and now you can manually run Telegraf using the following command to see if there are any configuration errors in the output:
telegraf --config telegraf.confWith the above configuration, Telegraf forwarded 32 metrics to the configured data source; this is what they look like in the Graphite format:
telegraf.<host>.127_0_0_1.snmp.hrDeviceStatus
telegraf.<host>.127_0_0_1.snmp.hrMemorySize
telegraf.<host>.127_0_0_1.snmp.hrStorageUsed
telegraf.<host>.127_0_0_1.snmp.hrSystemUptime
telegraf.<host>.127_0_0_1.snmp.ifAdminStatus
telegraf.<host>.127_0_0_1.snmp.ifInDiscards
telegraf.<host>.127_0_0_1.snmp.ifInErrors
telegraf.<host>.127_0_0_1.snmp.ifInNUcastPkts
telegraf.<host>.127_0_0_1.snmp.ifInOctets
telegraf.<host>.127_0_0_1.snmp.ifInUcastPkts
telegraf.<host>.127_0_0_1.snmp.ifInUnknownProtos
telegraf.<host>.127_0_0_1.snmp.ifIndex
telegraf.<host>.127_0_0_1.snmp.ifLastChange
telegraf.<host>.127_0_0_1.snmp.ifMtu
telegraf.<host>.127_0_0_1.snmp.ifOperStatus
telegraf.<host>.127_0_0_1.snmp.ifOutDiscards
telegraf.<host>.127_0_0_1.snmp.ifOutErrors
telegraf.<host>.127_0_0_1.snmp.ifOutNUcastPkts
telegraf.<host>.127_0_0_1.snmp.ifOutOctets
telegraf.<host>.127_0_0_1.snmp.ifOutQLen
telegraf.<host>.127_0_0_1.snmp.ifOutUcastPkts
telegraf.<host>.127_0_0_1.snmp.ifSpeed
telegraf.<host>.127_0_0_1.snmp.ifType
telegraf.<host>.127_0_0_1.snmp.ipForwarding
telegraf.<host>.127_0_0_1.snmp.ipInAddrErrors
telegraf.<host>.127_0_0_1.snmp.snmpOutGenErrs
telegraf.<host>.127_0_0_1.snmp.sysORLastChange
telegraf.<host>.127_0_0_1.snmp.sysServices
telegraf.<host>.127_0_0_1.snmp.sysUpTime
telegraf.<host>.127_0_0_1.snmp.sysUpTimeInstance
telegraf.<host>.127_0_0_1.snmp.tcpActiveOpens
telegraf.<host>.127_0_0_1.snmp.udpInDatagrams
The official GitHub repository contains additional configuration options and a complete list of metrics the SNMP plugin returns.
Use Hosted Graphite by MetricFire to Create Custom Dashboards and Alerts
MetricFire is a monitoring platform that enables you to gather, visualize, and analyze metrics and data from servers, databases, networks, devices, and applications. Using MetricFire, you can effortlessly identify problems and optimize resources within your infrastructure. Hosted Graphite by MetricFire removes the burden of self-hosting your monitoring solution, allowing you more time and freedom to work on your most important tasks.
Once you have signed up for a Hosted Graphite account and used the above steps to configure your server with the Telegraf Agent, metrics will be forwarded, timestamped, and aggregated into the Hosted Graphite backend.
- Metrics will be sent and stored in the Graphite format of: metric.name.path <numeric-value> <unix-timestamp>
- The dot notation format provides a tree-like data structure and makes it efficient to query
- Metrics are stored in your Hosted Graphite account for two years, and you can use them to create custom Alerts and Grafana dashboards.
Build Dashboards in Hosted Graphite's Hosted Grafana
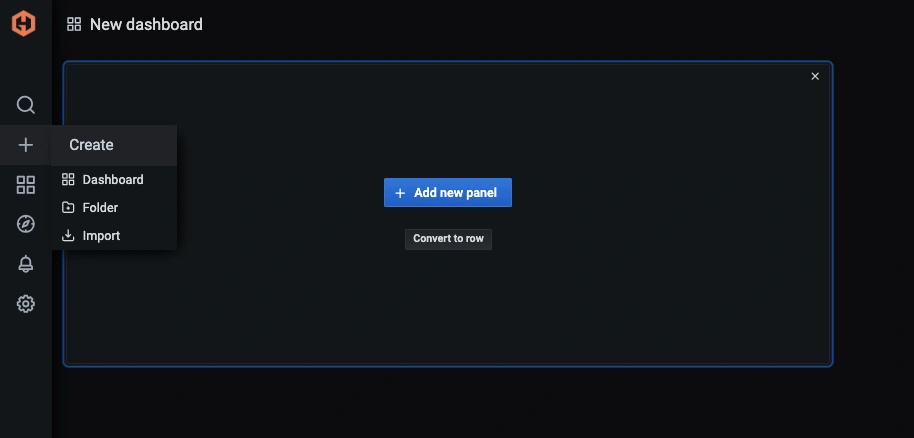
In the Hosted Graphite UI, navigate to Dashboards => Primary Dashboards and select the + button to create a new panel:
Then you can use the query UI to select a graphite metric path (the default data source will be the hosted graphite backend if you are accessing Grafana through your Hosted Graphite account):
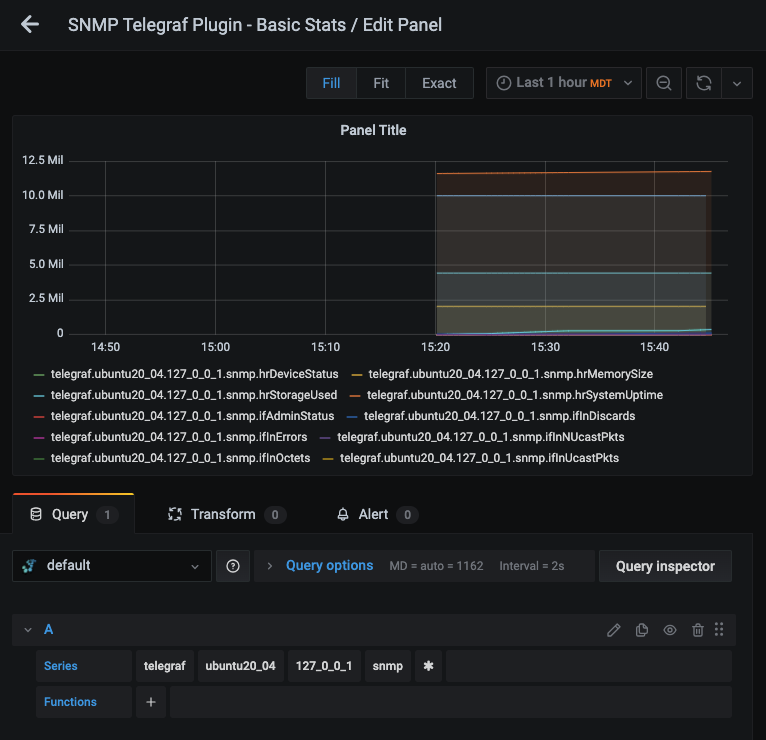
The Hosted Graphite datasource also supports wildcard (*) searching to grab all metrics that match a specified path.
Now you can apply Graphite functions to these metrics, like aliasByNode(), to reformat the metric names on the graph:
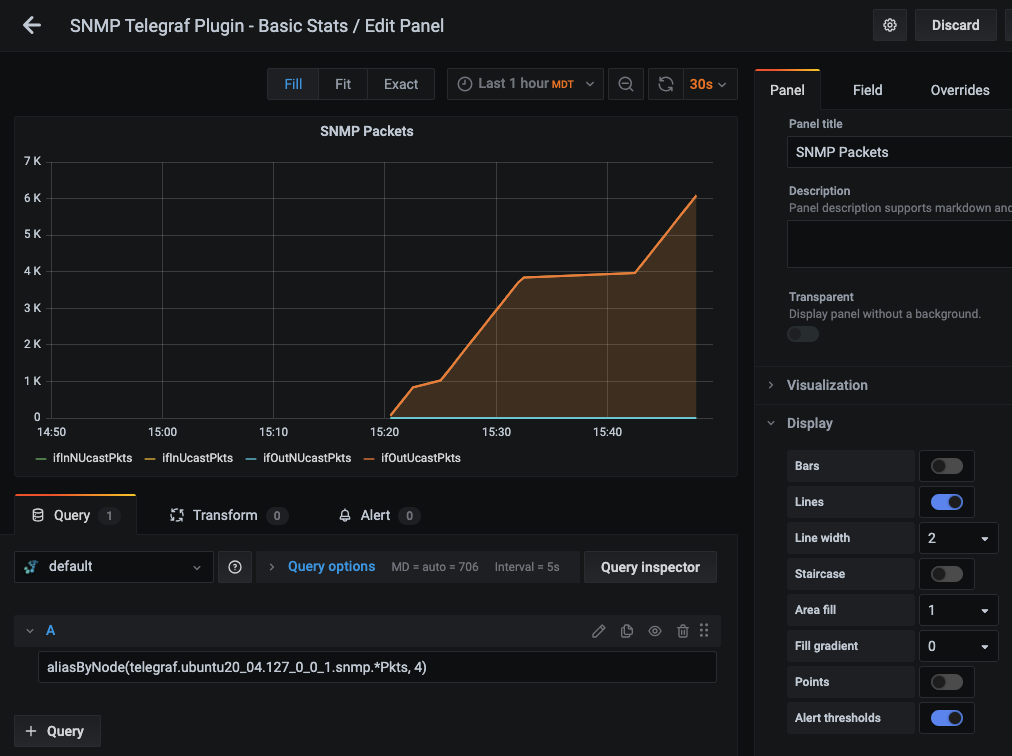
Grafana has many additional options to apply different visualizations, modify the display, set units of measurement, and some more advanced features like configuring dashboard variables and event annotations.
See the Hosted Graphite dashboard docs for more details.
Creating Graphite Alerts
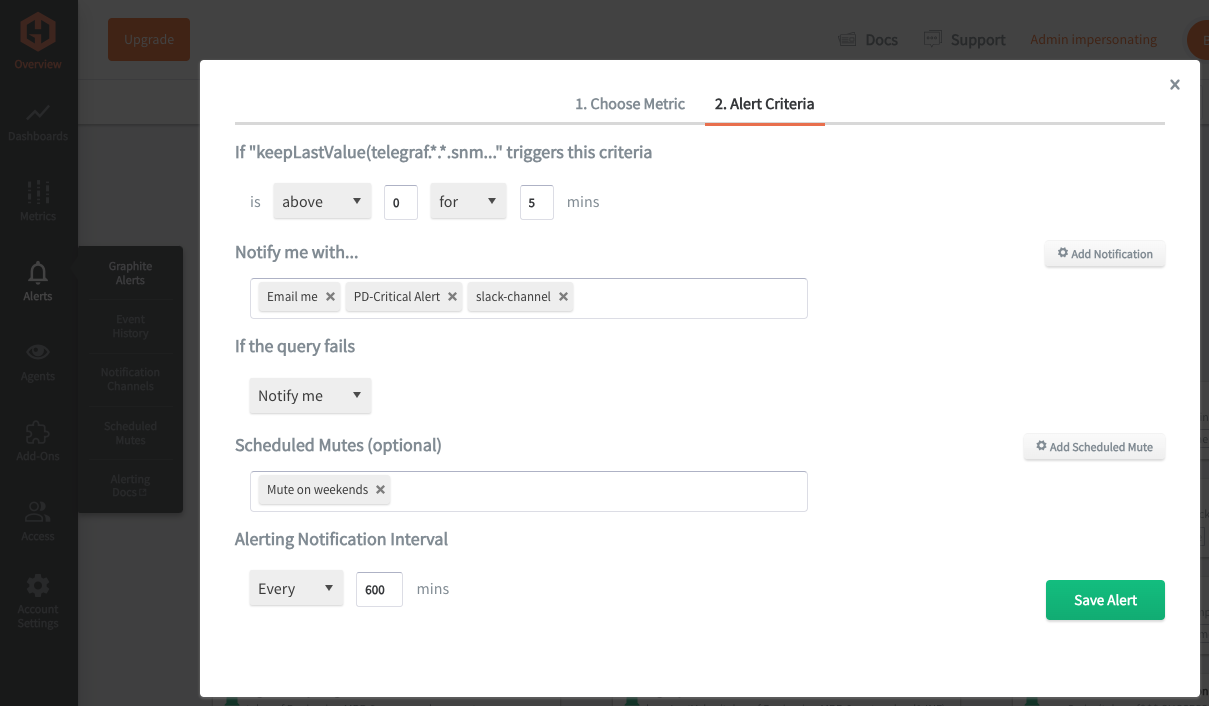
In the Hosted Graphite UI, navigate to Alerts => Graphite Alerts to create a new alert. Name the alert, add a query to the alerting metric field, and add a description of what this alert is:
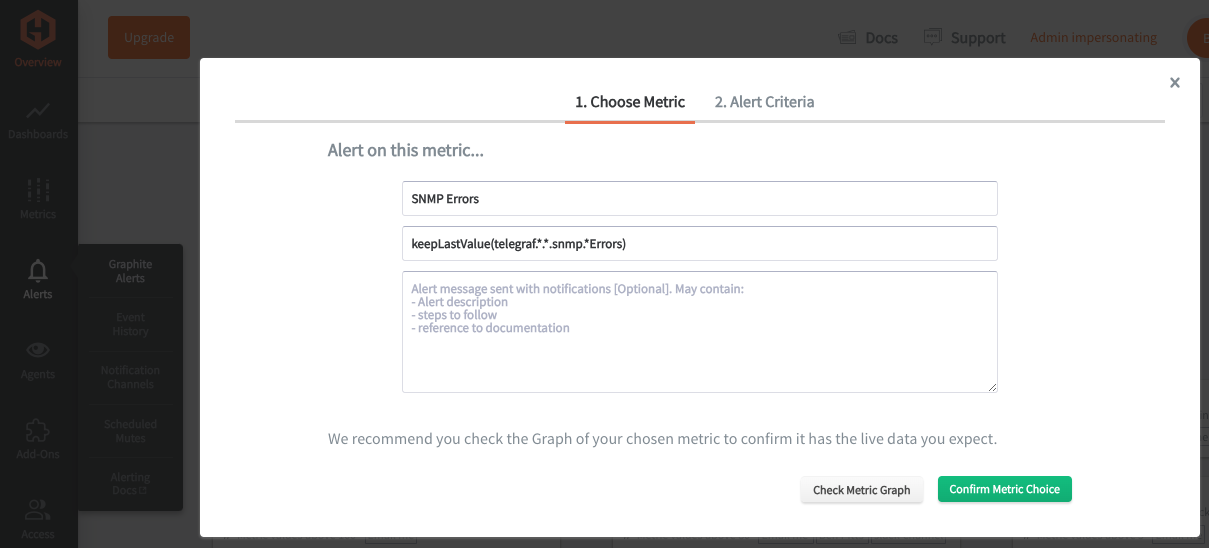
Then, select the Alert Criteria tab to set a threshold and select a notification channel. The default notification channel is the email you used to sign up for the Hosted Graphite account. Still, you can easily configure channels for Slack, PagerDuty, Microsoft Teams, OpsGenie, custom webhooks and more. See the Hosted Graphite docs for more details on notification channels:
Conclusion
Monitoring SNMP is a best business practice as it allows for proactive identification of network issues, optimization of performance, minimization of downtime, and assurance of the security and stability of the IT infrastructure.
Sign up for the free trial and experiment with monitoring your infrastructure today. You can also book a demo and talk to the MetricFire team directly about your monitoring needs.


