


Table of Contents
Great systems are not just built. They are monitored.
MetricFire runs Graphite and Grafana as a fully managed service for growing engineering teams, taking care of storage, scaling, and version updates so your team doesn't have to. Plans start at $19/month, billed per metric namespace rather than per host, and include engineer-staffed support. Integrations work natively with Heroku, AWS, Azure, and GCP, and data is stored with 3× redundancy in SOC2- and ISO:27001-certified data centres.
Introduction
Running applications on Heroku abstracts away much of the infrastructure management, but it does not remove the need to understand how your application behaves in production. Metrics, logs, and events are still critical for troubleshooting issues, validating performance, and making informed scaling decisions. Visualization plays an important role in turning that raw operational data into something teams can quickly interpret and act on.
This article walks through how monitoring and visualization work on Heroku, what you get from Heroku’s built in tooling, and how third party monitoring tools like Hosted Graphite and Grafana can extend those capabilities. The goal is not to replace Heroku’s tools, but to complement them with deeper historical data, flexible dashboards, and more precise alerting.
This article will explore various dashboard options available on Heroku, with a special focus on Hosted Graphite and Grafana by MetricFire which specializes in monitoring systems. You can use our product with minimal configuration to gain in-depth insight into your environments. If you would like to learn more, please book a demo with us, or sign on to the free trial today.
Why Visualization Matters on Heroku
Heroku provides built in metrics and dashboards that offer a useful starting point for understanding application health. These tools are designed to give quick, high level insight into dyno usage, request behavior, and recent platform events, which works well for basic monitoring and day to day operations.
As applications grow, however, teams often need deeper visibility than aggregated, short lived metrics can provide. Comparing long term trends, monitoring specific services or endpoints, and creating custom dashboards and alerts requires more flexible data collection and visualization. The sections below walk through what Heroku offers out of the box and how Hosted Graphite extends those capabilities with richer metrics, longer retention, and more customizable visualization.
What Heroku Provides Out of the Box
Heroku includes several built in tools that provide a baseline level of visibility for all applications.
Heroku Metrics and Application Dashboard
The Heroku Dashboard displays fixed charts for dyno usage, request throughput, response times, memory consumption, and platform events. It also surfaces recent deploys, configuration changes, restarts, and add on activity, which can help correlate behavior changes with operational actions. Metrics are presented with limited historical depth, are not customizable, and access to certain views depends on plan level.
Logs and Logplex
Heroku aggregates logs from applications, the routing layer, the platform, and attached add ons using Logplex. Logs can be viewed in the Heroku Dashboard or streamed in real time through the Heroku CLI. Log retention is limited, and logs are not designed for long term analysis or cross correlation without forwarding them to an external logging service.
Language Runtime Metrics
For supported runtimes such as Ruby, Node.js, Java, and Go, Heroku provides language specific runtime metrics including memory usage, garbage collection activity, heap statistics, and runtime latency. These metrics are useful for diagnosing runtime level performance issues but have limited retention and visualization options within the Heroku platform.
Where Heroku’s Built In Tools Fall Short
While Heroku’s native tooling is useful, it has some clear limitations:
- Metrics are largely aggregated and short lived
- Custom application metrics are not retained or visualized
- Alerting options are limited
- It is difficult to compare long term trends or correlate metrics across services
As applications grow, teams often need more detailed metrics, longer retention, and dashboards tailored to how their systems are designed.
Extending Heroku Monitoring with Hosted Graphite
Hosted Graphite by MetricFire integrates with Heroku as an add on to provide deeper and more flexible metrics monitoring than Heroku’s built in tooling. Heroku metrics are collected by consuming data from an application’s log stream, including router logs and runtime metrics emitted through Heroku’s log runtime, and then transformed into structured time series data. This approach allows Hosted Graphite to capture detailed operational metrics without requiring changes to your application or infrastructure.
In addition to Heroku generated metrics, Hosted Graphite can ingest custom metrics directly from your application code using common collectors and APIs, as well as metrics from supported Heroku add ons. These include services such as Heroku Postgres, Redis, and Kafka, along with metrics from external infrastructure or cloud providers like AWS, Azure, GCP, and more. All of these data sources are combined into a single monitoring environment.
Hosted Graphite stores metrics with long term retention, making it possible to analyze trends over weeks or months, compare historical behavior across deploys, and build dashboards that accurately reflect how your application operates in production. Features such as custom dashboards, flexible alerting, metric aggregation, APIs for automation, and built in integrations allow teams to tailor monitoring to their workflows while avoiding the limitations of short lived, aggregated platform metrics.
Installing the Hosted Graphite Add-on
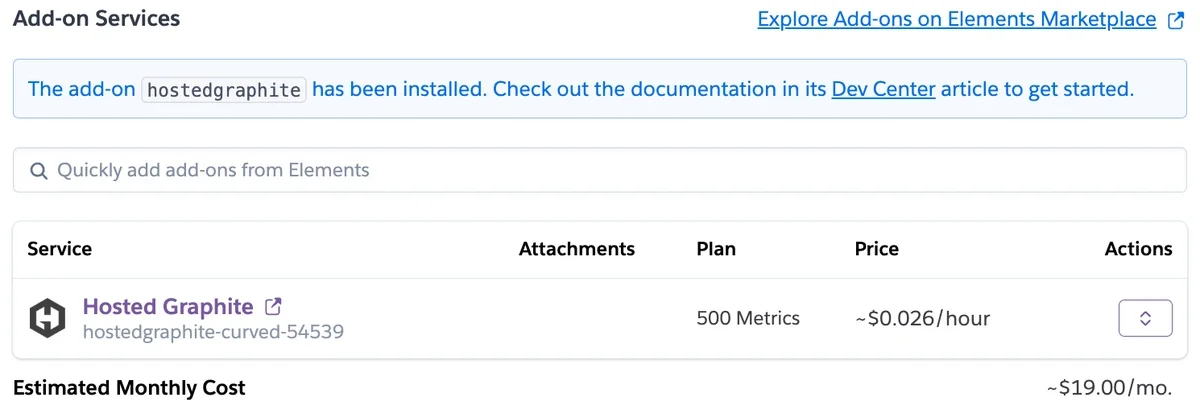
Installing the Hosted Graphite add on for Heroku is quick, inexpensive, and requires very little setup. You can provision it directly from the Heroku UI with a few clicks, or add it from the command line using the Heroku CLI: heroku addons:create hostedgraphite -a <app-name>
Once enabled, metrics begin flowing automatically, allowing you to start building custom dashboards and alerts right away!
Understanding Heroku Metrics in Hosted Graphite
When Hosted Graphite is connected to a Heroku application, metrics are derived from the application’s log stream and runtime output, then converted into structured Graphite time series. Each metric follows a predictable naming hierarchy, which makes it easy to query, aggregate, and visualize data in Grafana.
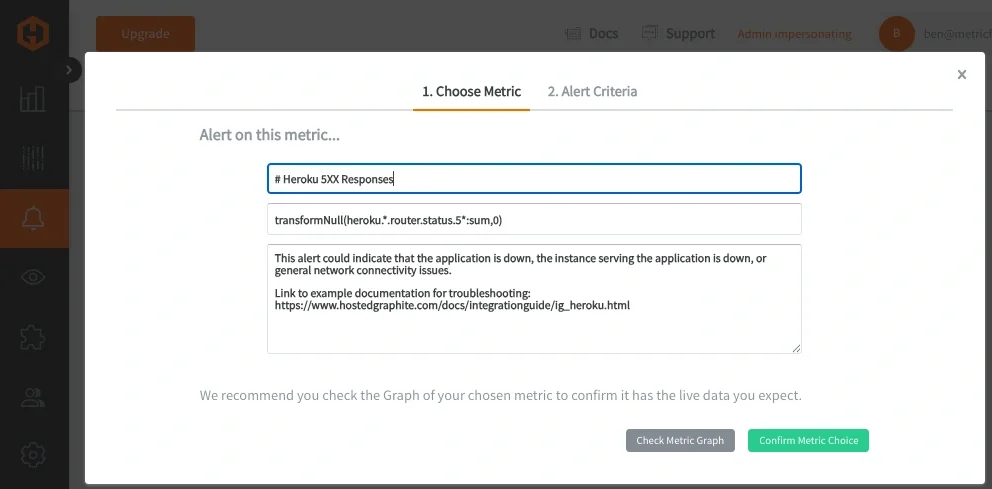
Router metrics capture how traffic flows through your application. These include request counts, response status codes, and service level timing information. For example, metrics such as heroku.<app>.router.status.200 or heroku.<app>.router.status.503 make it possible to track successful requests, client errors, and server errors independently. This allows teams to monitor error rates, detect failed requests, and alert on unhealthy behavior at the routing layer.
Dyno and process metrics provide insight into how individual dynos are behaving at runtime. Metrics like CPU load averages and memory usage are reported per dyno and process type, making it easier to understand resource pressure and scaling behavior. For example, metrics such as heroku.<app>.web.1.cpu.load_avg_1m or heroku.<app>.web.1.memory.memory_rss help identify sustained CPU load, memory growth, or swapping that could impact performance or stability.
Because these metrics are stored as native Graphite time series, they can be easily grouped, aggregated, and compared over time. Teams can build dashboards that show trends across all dynos, break metrics down by process type, or correlate router errors with resource usage, creating a clearer picture of how application behavior and infrastructure health are connected. For more information on how to understand your Heroku metrics, download our free Heroku Cheatsheet.
Visualizing Metrics with Grafana
Hosted Graphite converts Heroku application data into structured Graphite time series metrics by consuming an app’s log stream. Metrics emitted through router logs and runtime logs are parsed, normalized, and stored as Graphite metrics, making them easy to query and aggregate. This approach allows Heroku’s log based operational data to be explored as first class metrics rather than raw text.
Grafana sits on top of these Graphite metrics and provides a flexible interface for visualization. Teams can build dashboards that focus on specific services, endpoints, or features, combine application and infrastructure metrics in a single view, and drill into historical time ranges to investigate incidents or performance regressions. Because the underlying data is stored as time series metrics, Grafana queries remain fast and expressive even as data volume grows.
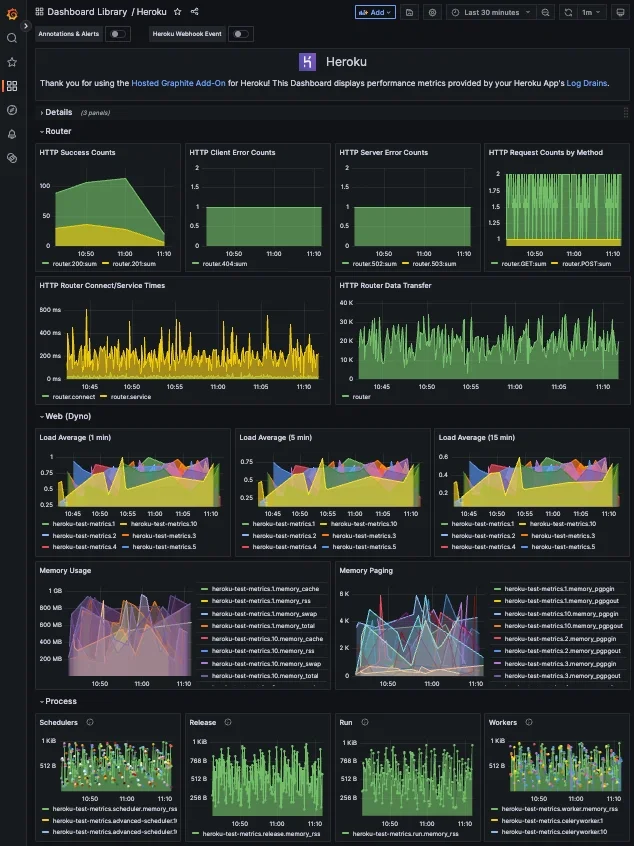
When using Hosted Graphite on Heroku, pre built Grafana dashboards are automatically created for common router, dyno, process, and add on metrics. These dashboards provide immediate visibility while still allowing full customization, making it easy to move from basic monitoring to deeper analysis as your needs evolve.
Alerting on What Actually Matters
Beyond visualization, Hosted Graphite provides metric based alerting. Alerts can be defined on any metric or group of metrics, allowing teams to detect issues such as:
- Increased latency on specific endpoints
- Elevated error rates
- Missing or stalled metrics
- Abnormal traffic patterns
Alerts can be routed to common notification channels including email, Slack, PagerDuty, Microsoft Teams, OpsGenie, or custom webhooks. This makes it easier to respond quickly without relying solely on manual dashboard checks.
Conclusion
Heroku’s built in tools provide a solid starting point for understanding application health, but they are intentionally lightweight. As applications mature, teams often need deeper visibility, longer retention, and more control over how metrics are visualized and alerted on.
By combining Heroku’s platform metrics with Hosted Graphite and Grafana, teams can build a monitoring setup that scales with their application. This approach keeps Heroku’s simplicity while adding the observability needed to operate production systems with confidence.
If you would like to learn more about it, please book a demo with us, or sign on to the free trial today. Grafana delivers automatic, real-time dashboards for Heroku, offering a comprehensive view of application performance, while Hosted Graphite allows for customized, in-depth metrics.


