
Table of Contents
Great systems are not just built. They are monitored.
MetricFire runs Graphite and Grafana as a fully managed service for growing engineering teams, taking care of storage, scaling, and version updates so your team doesn't have to. Plans start at $19/month, billed per metric namespace rather than per host, and include engineer-staffed support. Integrations work natively with Heroku, AWS, Azure, and GCP, and data is stored with 3× redundancy in SOC2- and ISO:27001-certified data centres.
Introduction
This article explores the efficient monitoring of Heroku Apps using MetricFire's HostedGraphite plugin and Grafana dashboards. By combining these tools, developers can gain valuable insights into their app's performance and resource utilization. This guide provides step-by-step instructions on setting up MetricFire, integrating StatsD, and creating comprehensive Grafana dashboards for effective monitoring and debugging.
Key Takeaways
-
How to monitor your Heroku App using MetricFire's HostedGraphite plugin and track app resources and custom metrics.
-
How to add StatsD to your app to monitor button interactions and capture important metrics.
-
How to visualize metrics on MetricFire's Grafana dashboards for comprehensive monitoring and debugging.
-
How to set up MetricFire on your Heroku App with a step-by-step guide and activate the Heroku Add-On.

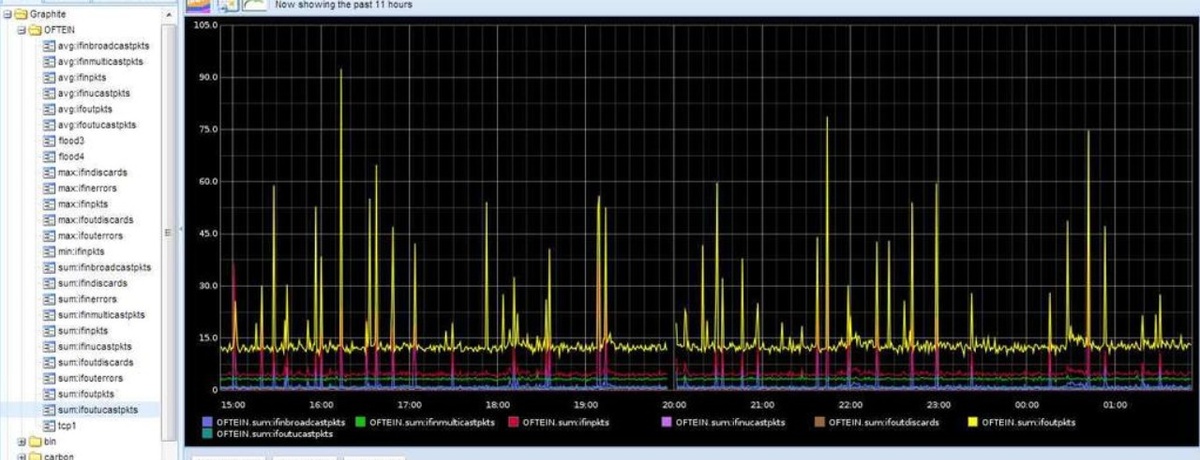
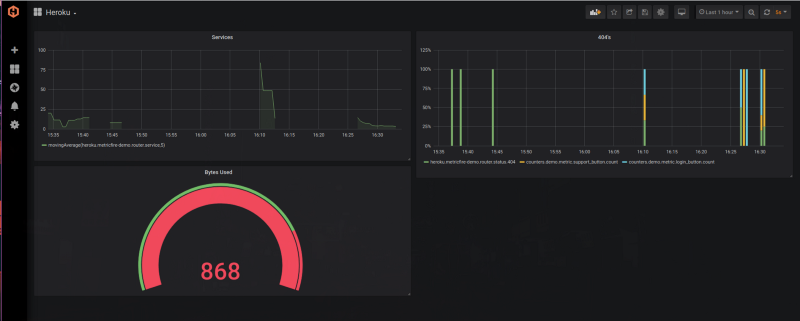
Today, we are monitoring a Heroku App using MetricFire's Heroku Plugin called HostedGraphite. On top of app metrics, we will also add StatsD to our Heroku App. We then will consolidate all those metrics onto our MetricFire's Grafana dashboards. This will let us track and gauge our Heroku's app resources and also the stats that we specify in the code. Our end result will look something like the image above.
Prerequisites
We will go over the setup process of MetricFire on our Heroku App. This assumes that you already have a Heroku App running along with the Heroku CLI. You can check out our StatsD article if you're not familiar with StatsD, as we will not be showing how to set up StatsD in this article. For using Grafana, you can check out our article on Grafana dashboards, from basic to advanced.
MetricFire
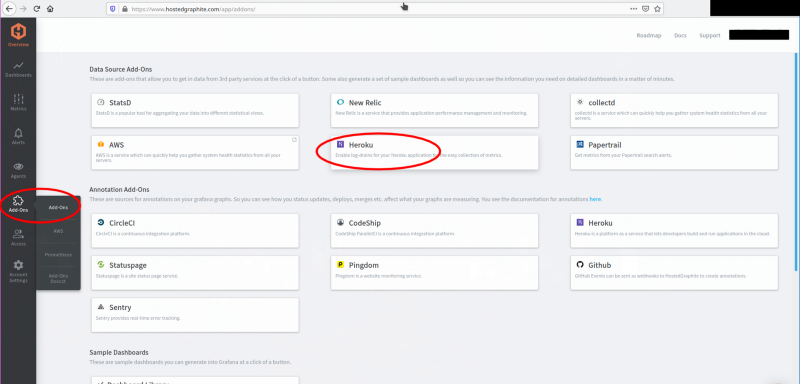
First, we will need a MetricFire account to get our API key for Heroku. If you are not a current customer, you can get a 14-day free trial in just a few minutes. Once you are logged in, we will go to Add-Ons > Add-Ons > Heroku, like in the image below.
MetricFire is pretty good at saving you time, they've already laid out the command that we need to run. You can see where to copy it in the image below.
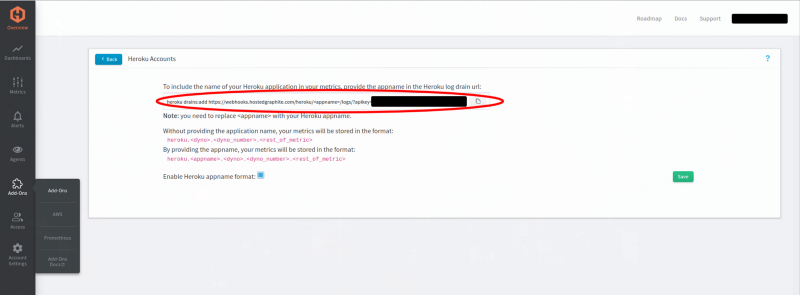
Note that the command requires you to enter your app name correctly, just replace <app_name> with your Heroku's app name when we run this command later.
Setting up Heroku Add-On
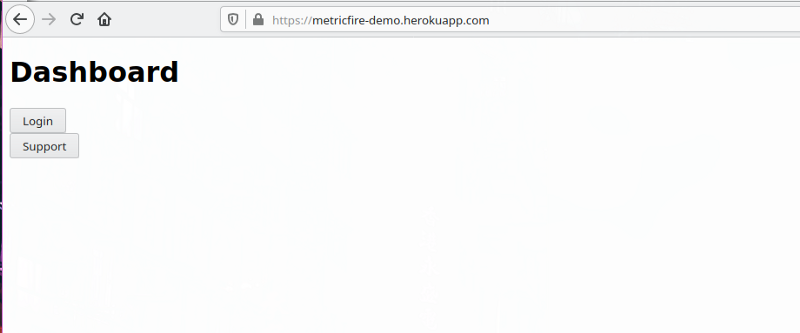
My simple Heroku app is running on Django. The code will be in Python, but you can apply the same concepts to any other framework in a different language. Here's a quick overview of my app:
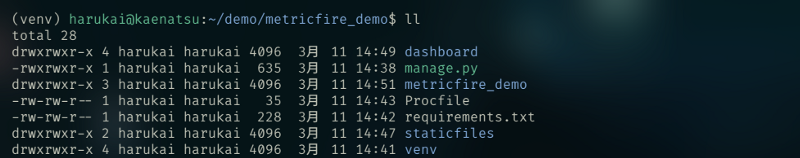
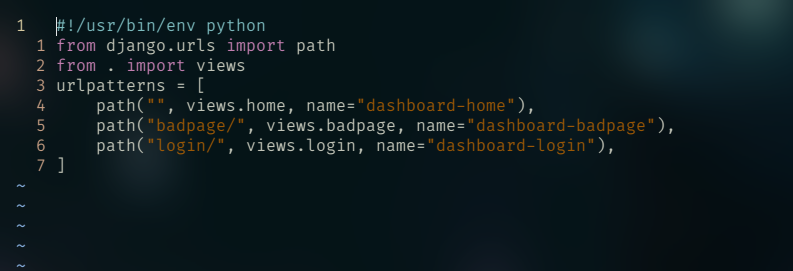
The layout should be simple enough to follow, and the image below is what it looks like on Heroku.
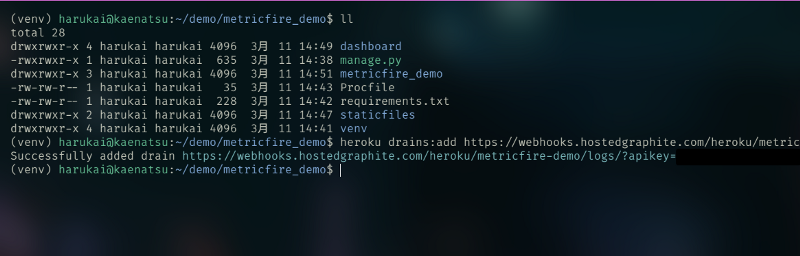
Now let's activate our Heroku Add-On with that command we got earlier from our MetricFire account. You can see the output in the image below.
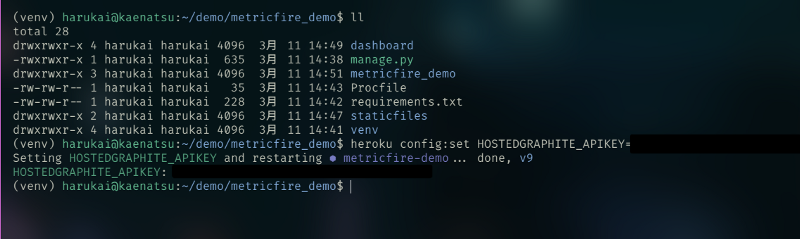
Next, we need to add our API key to our environment variables in Heroku. The key name will be HOSTEDGRAPHITE_APIKEY, you can also check the image below for the output. Run Heroku config:set HOSTEDGRAPHITE_APIKEY=YOUR_API_KEY.
Now our Heroku app should be sending metrics to our MetricFire account. Let's confirm those metrics from our Metric Treemap. From our dashboard, we go to Metrics > Metric Treemap as in the image below.
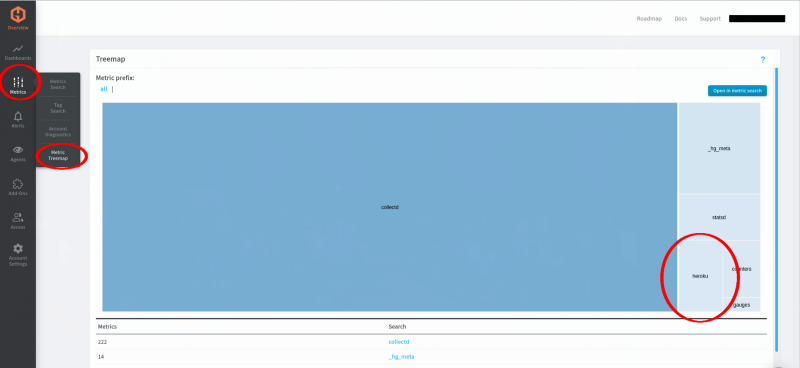
We can see that there is a Heroku section in the Treemap, which means our add-on on Heroku is working. Before setting up our Grafana graph, let's add StatsD on our app to track which button is being pressed at what time.
Implementing StatsD
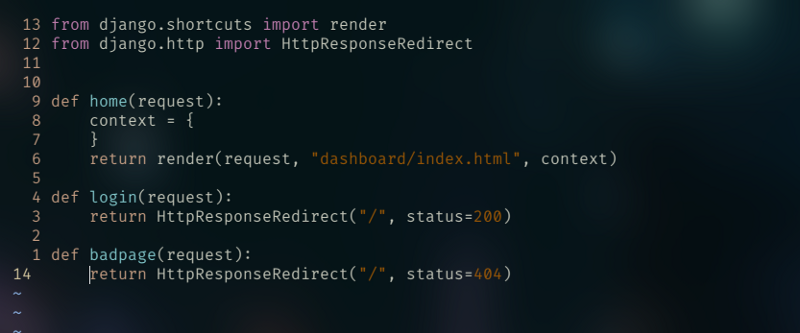
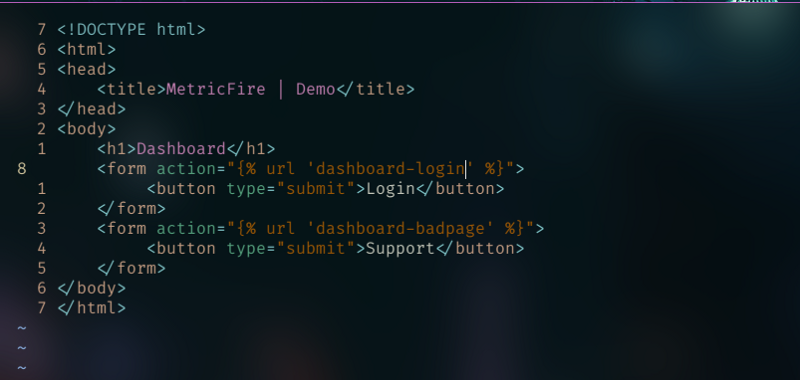
StatsD is implemented by adding code to our app's code. You can refer to the images above labeled "View: dashboard/views.py" and compare them with the image below to see where the StatsD code has been added.
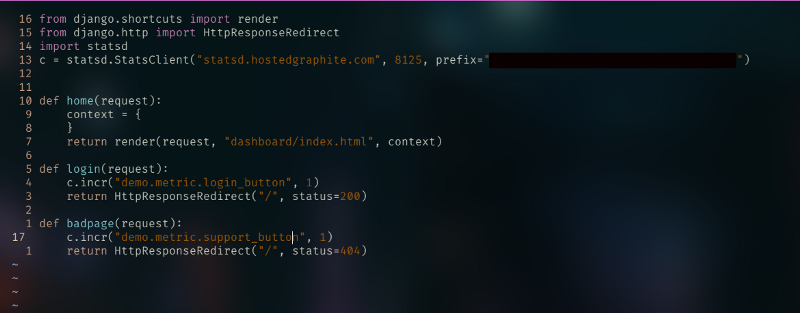
We are only going to add count metrics to our login and "support" buttons. As you can see in the image above, our support_button is actually leading to a bad page. This is to replicate a failure in a button, which will show up on our graph later.
Let's test our StatsD metrics by pressing those buttons on our app. After clicking those buttons, let's check out our Heroku logs to see if they actually did something.
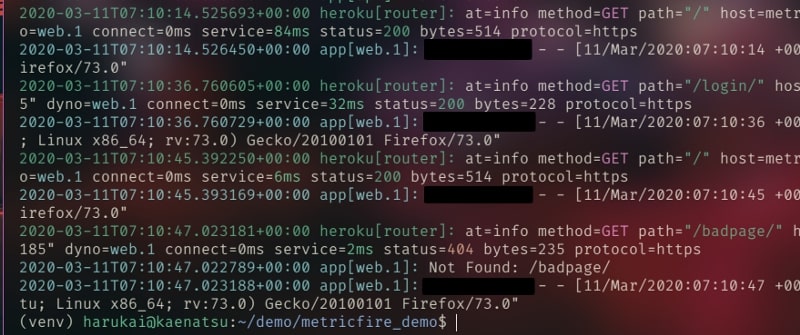
As you can see in the image above, our login button gives us a 200 response, and our "support" button gives us a 404 response. This is as expected from what we intended to set up. Next, we will check if those StatsD stats went to our MetricFire account. Go back to our MetricFire dashboard > Metrics > Metrics Treemap, and look for the "counters" box.
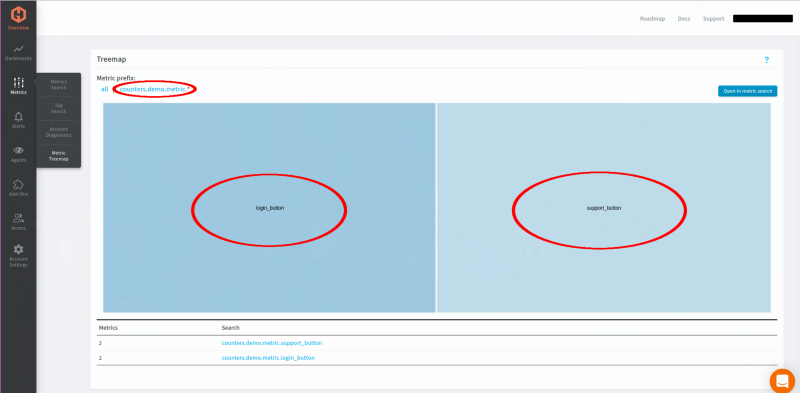
We can see that our login and support buttons are now sending StatsD metrics to our MetricFire account. Now that we have all the metrics we need, let's set up our Grafana dashboard on MetricFire.
Setting up a Grafana Dashboard on MetricFire
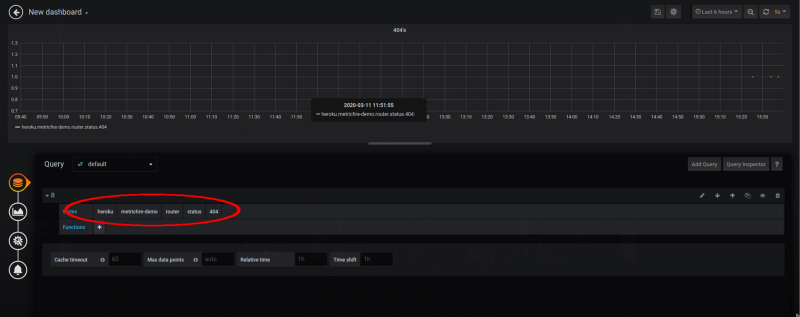
Let's add a new dashboard to Grafana on our MetricFire account. There are a few useful metrics to track. First, we will visualize the amount of 404 responses we get, like in the image below.
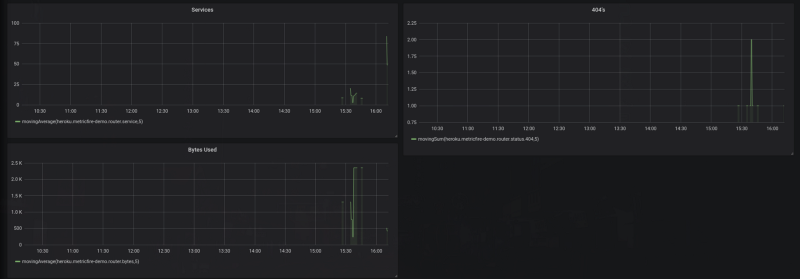
Next, we will visualize the number of services and the number of bytes used, like in the image below. Play around with the functions you can use to transform your metrics to produce a graph you'll like.
Next, we will add our StatsD metrics to our 404 panel. This is because we want to track the buttons we have on our page, and see which ones give a bad response. Check the image below on querying the StatsD metrics on our 404 panel.
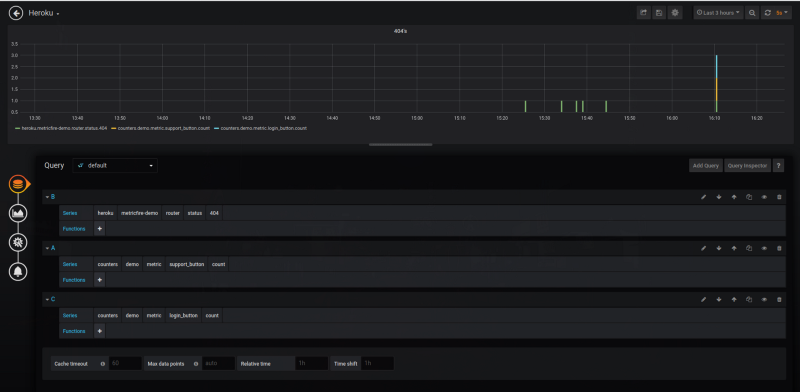
I have changed the visualizations to show bars: green is 404s, yellow is the login button, and blue is the support button. If our simple app was actually a site that is frequently used, we can now correlate which button is failing just by looking at the colors of the bars. Play around with the metrics, functions, and visualizations to create a dashboard that will be useful for maintenance and debugging.
Conclusion
In conclusion, monitoring a Heroku App using MetricFire's Heroku Plugin, HostedGraphite, along with StatsD integration offers a powerful solution for tracking app resources and custom metrics. By consolidating all the metrics onto MetricFire's Grafana dashboards, users can effectively monitor and gauge the performance of their Heroku app. The setup process, which requires a MetricFire account and the activation of the Heroku Add-On, is straightforward. With StatsD implemented in the app's code, specific button interactions can be monitored and analyzed. The Grafana dashboard provides visualizations of important metrics such as the number of 404 responses, services, and bytes used. Overall, this monitoring solution offers valuable insights for maintenance and debugging. Users can take advantage of MetricFire's free trial to explore the benefits and consider reaching out for further assistance tailored to their specific monitoring needs.
If you're interested in trying it out, get on to the MetricFire free trial and start sending metrics from your Heroku app. Also, reach out to us by booking a demo, and we can talk further about the monitoring you need for your company.