
Table of Contents
Great systems are not just built. They are monitored.
MetricFire runs Graphite and Grafana as a fully managed service for growing engineering teams, taking care of storage, scaling, and version updates so your team doesn't have to. Plans start at $19/month, billed per metric namespace rather than per host, and include engineer-staffed support. Integrations work natively with Heroku, AWS, Azure, and GCP, and data is stored with 3× redundancy in SOC2- and ISO:27001-certified data centres.
Introduction
Graphite is used by many organizations to track and visualize various metrics that their applications or servers send out. But what happens if there are too many of these metrics or the company doesn't want to use its human resources to monitor the behaviour of metrics constantly? In this article, we will use Hosted Graphite by MetricFire to learn about Graphite's ability to notify users about the abnormal behaviour of services or infrastructure in a timely manner.
MetricFire specializes in monitoring systems, with Hosted Graphite available on its platform. You can use our product with minimal configuration to gain in-depth insight into your environment. If you would like to learn more about it, please book a demo with us, or sign on for the free trial today.
Key Takeaways
- Hosted Graphite by MetricFire can track and notify users about abnormal behavior in metrics.
- Anomaly detection techniques include static thresholds and statistical methods.
- Statistical methods involve identifying outliers, shifts, and changes in value distribution.
- MetricFire's Hosted Graphite service offers flexible monitoring and alerting with various notification channels.
- The article provides a guide on setting up alerts in Hosted Graphite.
Anomaly detection techniques overview
Static thresholds
There are many ways to identify problems with applications or servers. One of them is static thresholds. This means that critical value checks are used for some metrics. For example, an alarm might come up for a certain percentage of server load or CPU usage, specific application errors, or the absence of any readings at all for a while.
But even if the thresholds are well-chosen, some of the problems can pass unnoticed, or alarms may not indicate real problems.
Depending on the metrics to which this anomaly detection technique is applied, this method has the following disadvantages:
- Seasonality: Static thresholds that are set on metrics that are seasonal can lead to false positives. For example, a decrease in user activity at night should not trigger an alert.
- Misinterpretation of the anomaly: Sometimes, what may appear to be an anomaly is not really an anomaly. Let's imagine a situation where on Monday, we had a failure, which led to a decrease in in-service performance. However, we may receive a warning about an abnormal increase in weekly metrics the following Monday.
Statistical methods - concepts
If the static threshold method doesn't suit you, you need to use statistical methods of anomaly detection. Statistical methods are used to find data points with outliers relative to some standard or typical data behaviour in time series. Many types of anomalies can be identified using statistical methods. We will consider the most significant ones:
Outliers. An outlier is an observation that lies abnormally far from the rest of a series of parallel observations. For example, you are monitoring the number of active users in your application. A sharp increase and then a decrease in the number of users in a short period of time, which looks like a spike on the graph, is an outlier.
Shifts. The behaviour of a metric characterized by a more or less long-term (seasonal) change is called a shift. An example of a shift could be a change in user activity during the night or a change in conversion rate before and after a customer acquisition campaign.
Changing the nature (distribution) of values. This type of anomaly may seem like an outlier, but its essence is a change in the behaviour of the metric. Let's say the normal (usual) CPU usage for our server is 10 to 20%. When we see on the graph that the processor load began to fluctuate sharply, for example, between 5 and 40%, this should be a cause for concern. This behaviour is called "changing the distribution of values".
Statistical methods - techniques
Now, let’s review the most popular statistical methods of anomaly detection.
Decomposition is a technique that deconstructs a time series into several components, each representing one of the underlying categories of patterns. The original time series is often split into three components:
- Seasonal: patterns that recur over a period of time.
- Trend: the main trend of the indicators.
- Random: also called “noise,” “irregular,” or “residual,” these are the remnants of the original time series after the seasonal and trend series have been removed.
ARIMA is a fairly simple method in design, but still effective enough to predict data and find anomalies. It is based on the approach that several points from the past generate a prediction of the next point with the addition of a certain random variable, which is usually white noise. ARIMA works by capturing three key aspects of the temporal information - Auto-Regression(AR), Integration(I), and Moving Average(MA).
- Auto-Regression - observations are regressed on their own lagged (i.e., prior) values.
- Integrated - data values are replaced by the difference between values.
- Moving Average - regression errors are dependent on lagged observations.
Exponential Smoothing - is a trendy set of techniques for forecasting time series. The most interesting techniques from the anomaly detection perspective are the Holt-Winters method. Holt-Winters methods model a time series in 3 ways – average, trend, and seasonality. An average is a value referenced upon, a trend is a general increase/decrease over time, and seasonality is a cyclical repeating pattern over a period.
Anomaly detection with Graphite
Now that we have reviewed techniques for detecting anomalies in applications or infrastructure, let's look at a tool we can use to manage your time-series data and implement warning systems.
MetricFire's service is a powerful monitoring system that allows collecting, storing, processing, visualizing, and also alerting for time-series data. It uses Graphite, a monitoring tool, that stores time-related data in an efficient way (through the Whisper database), and provides mathematical functions to sum, group, and scale stored data in real-time. It also uses Dashboards, a powerful visualization tool connected to Graphite that gives you instruments to build customized interactive dashboards and set alerts for specific events.
MetricFire’s Hosted Graphite service provides a flexible and efficient tool for working with alerts to timely detect abnormal behaviour of your service or infrastructure. Define the rules for triggering the alert, and you will be immediately notified of the event through the specified notification channel. The service supports the following notification channels: Email, PagerDuty, Slack, HipChat, OpsGenie, VictorOps, and Webhook.
Setting up alerts
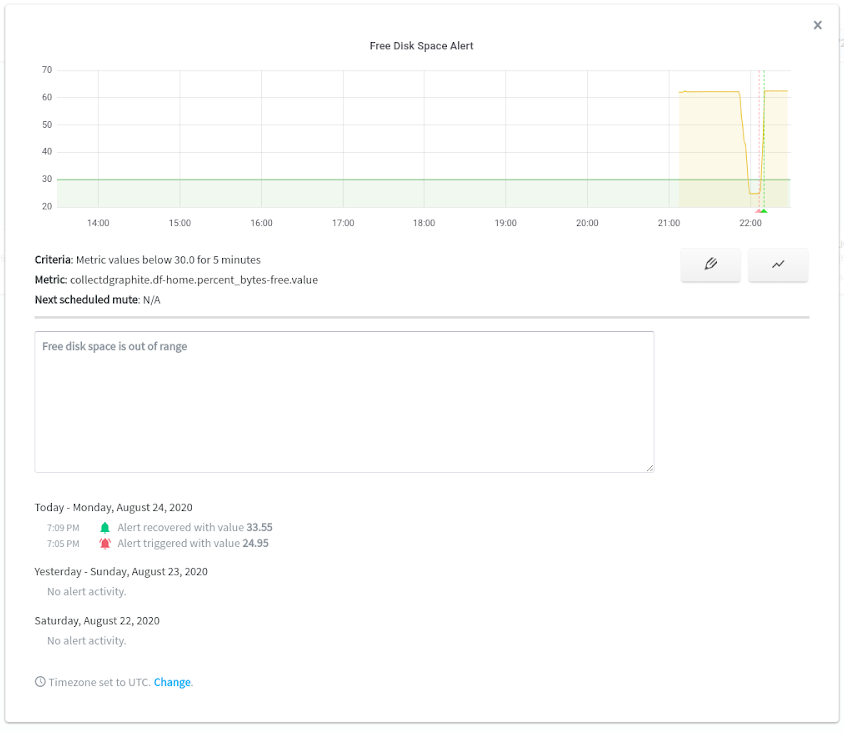
To get familiar with the process of creating alerts, we will create a straightforward dashboard that monitors the free disk space. The warning will be triggered if the average metric value is below 30 percent during the last 5 minutes. The notification channel will be via Email.
To get started, log in to the MetricFire free trial. Also, you need to install our Agent, as it is the simplest way to get your metrics into Hosted Graphite.
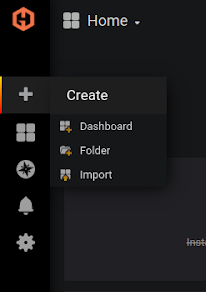
First of all, let’s create a new dashboard. Click on the “+” on the left, and choose “new dashboard”.
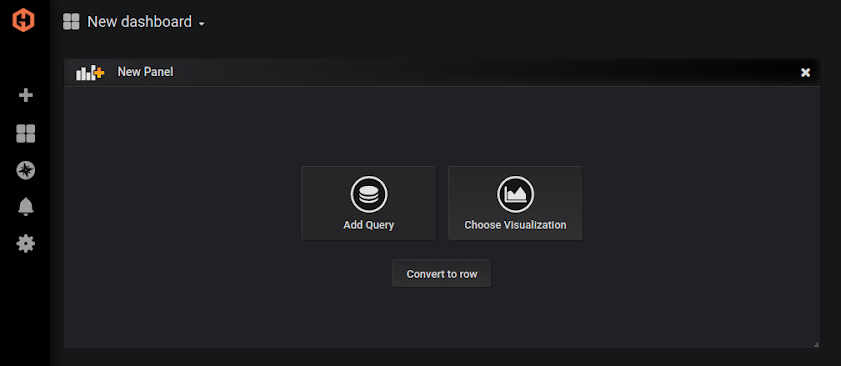
Then click to “Add Query”:
Our query has the following form:
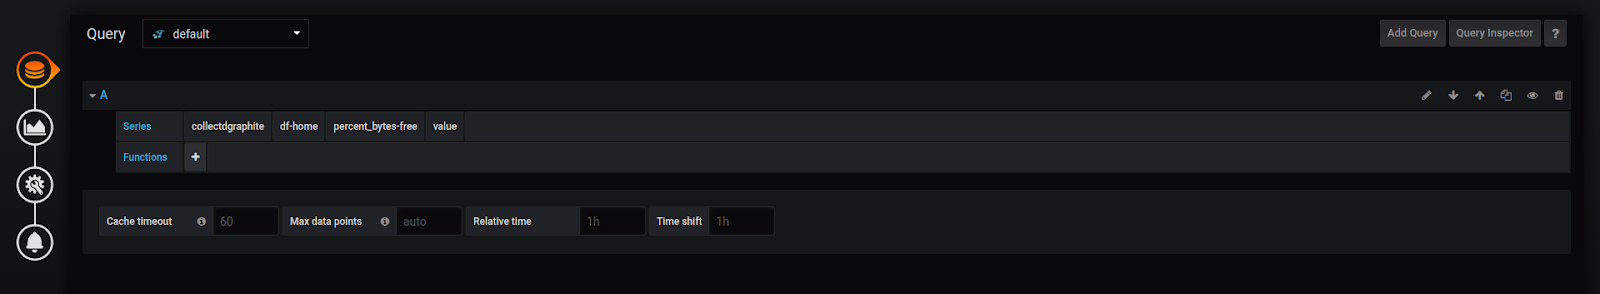
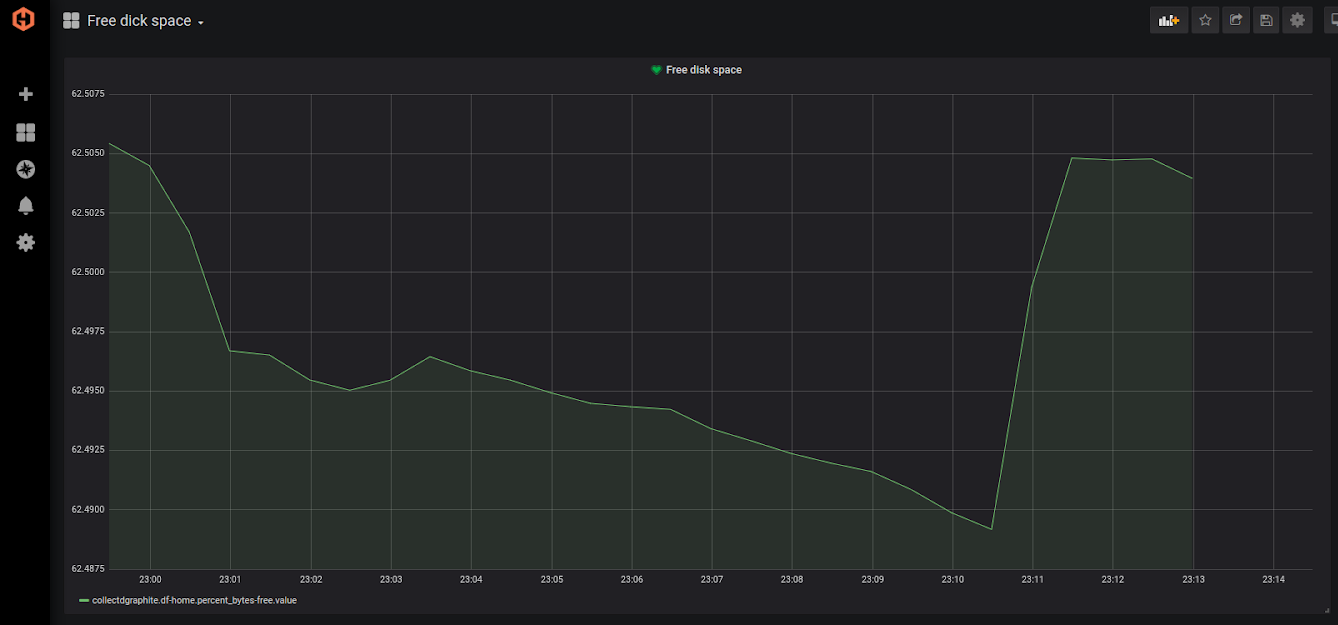
Basically, this is all you need to see: a graph that displays the change in free disk space in real-time. By going to the properties of the panel, you can enter its name.
The rule for the warning can be specified either during the creation of the panel or when changing it.
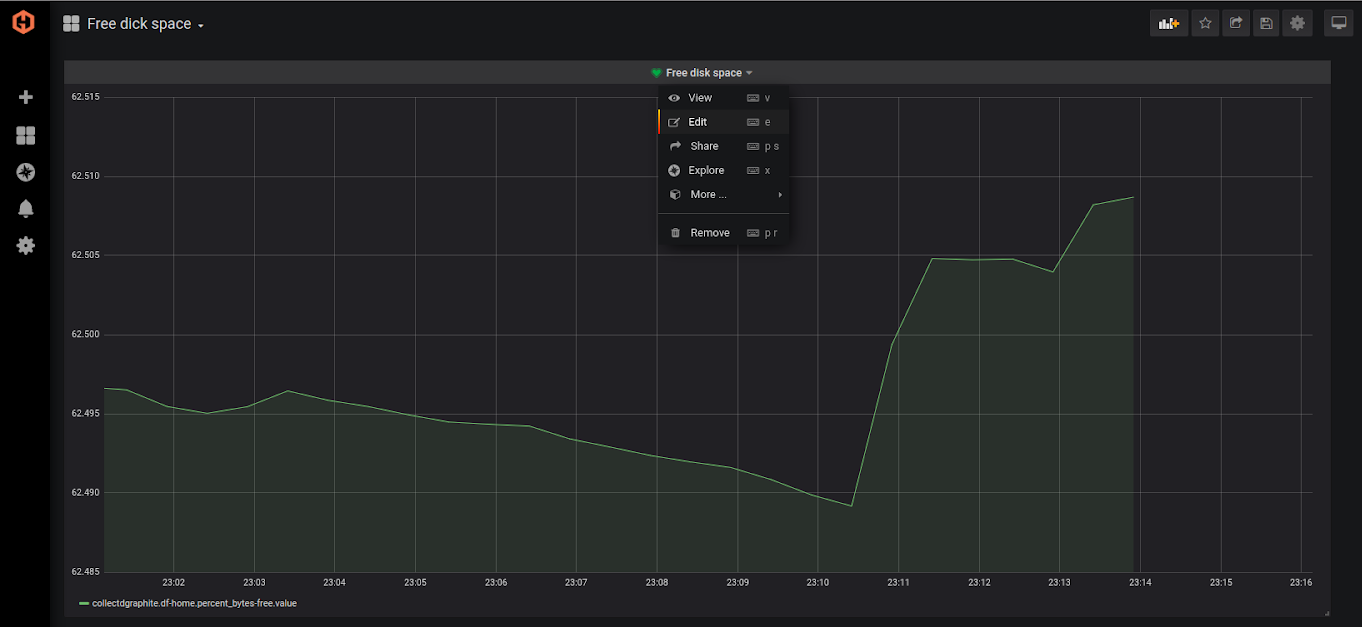
Сlick on the Alert button (the bottom button on the left panel), then click “Create Alert”.
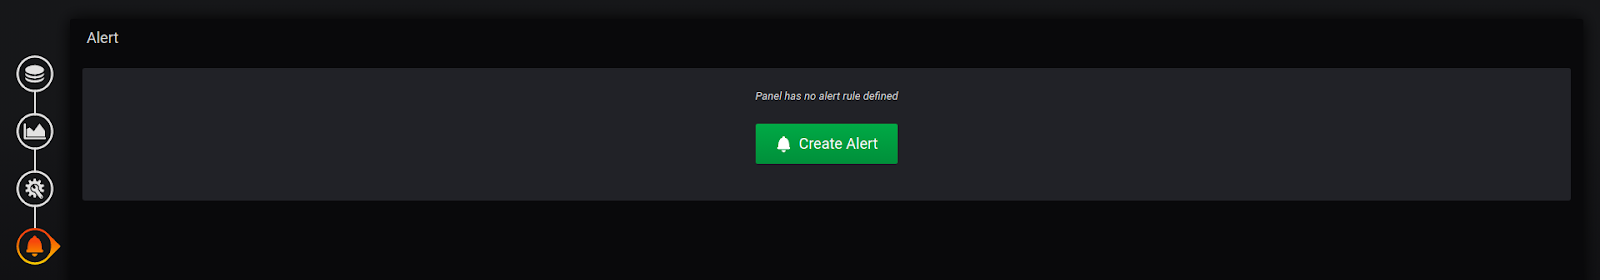
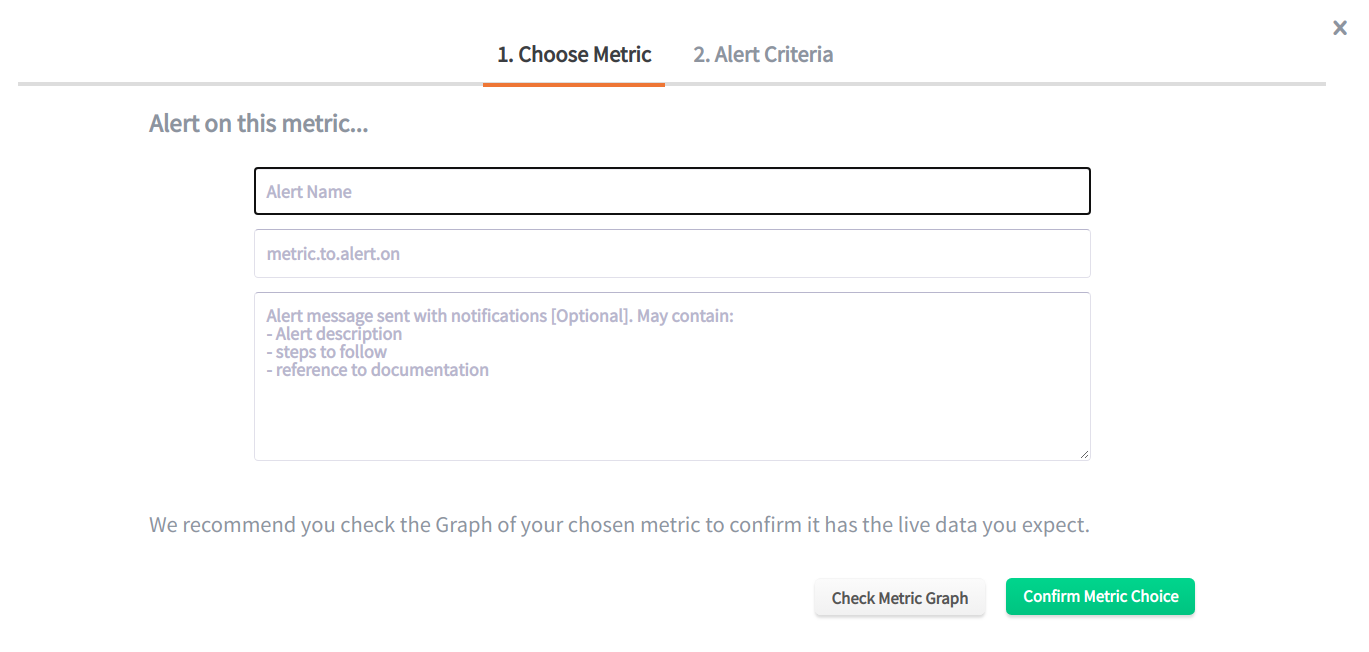
After that, we can configure the alert:
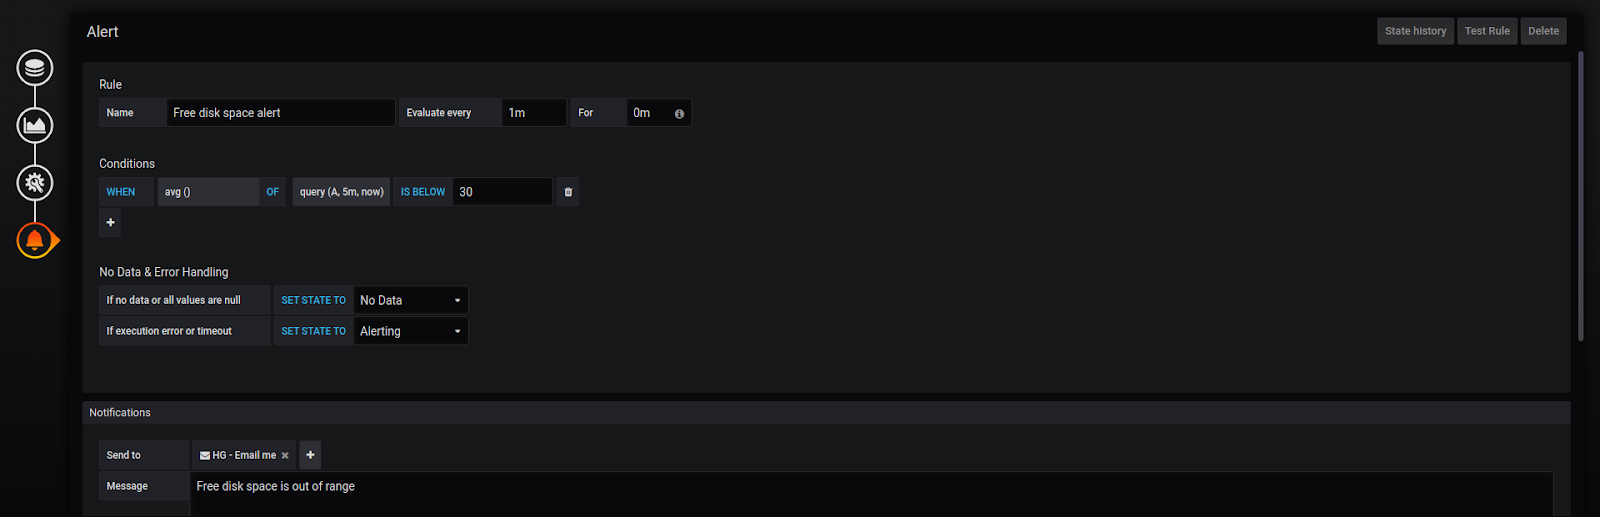
Enter the name of the rule. Then set the frequency for evaluation and define the conditions of the alert. As you can see the alert triggers if the average free disk space is below 30 percent for 5 minutes. Note that you can set more than one condition. For example, we can specify that the alert will be triggered if the average free disk space is below 30 percent during 5 minutes or the minimum of the metric is below 10 percent.
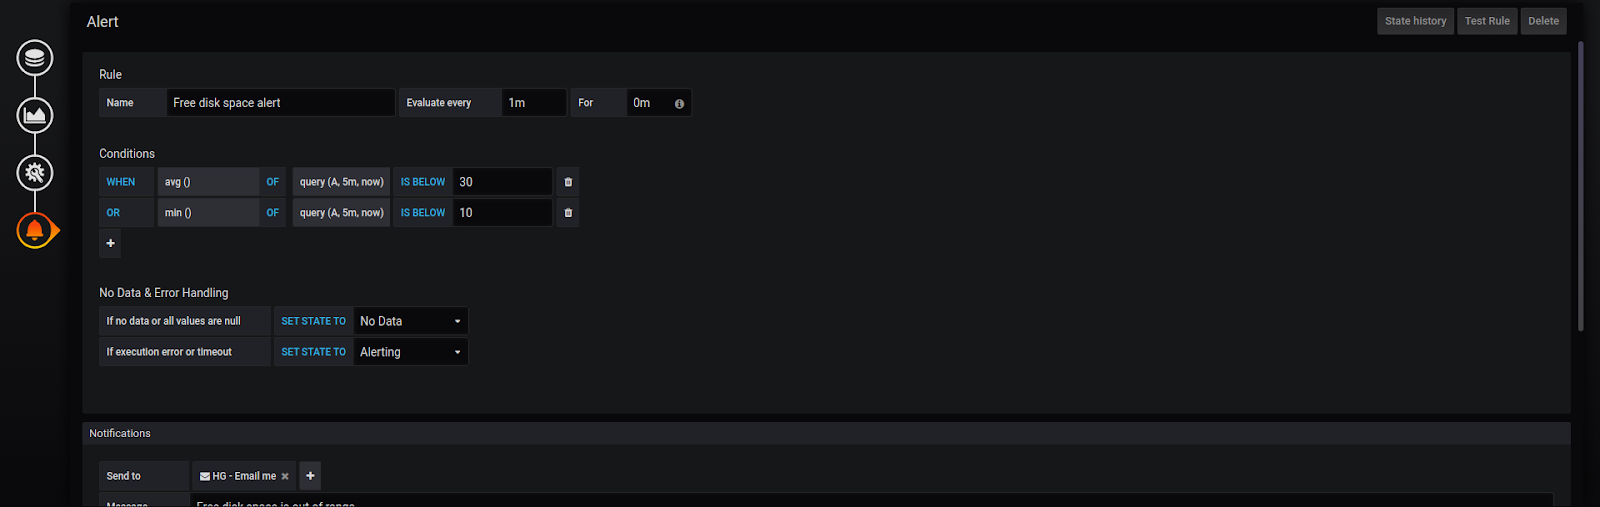
Also, there are many different functions for evaluation: count, sum, last, median, diff, min, max, etc. And you can set up alerts with other queries. Below the Conditions section, you can also set the behaviour of the alert when missing data or errors occur.
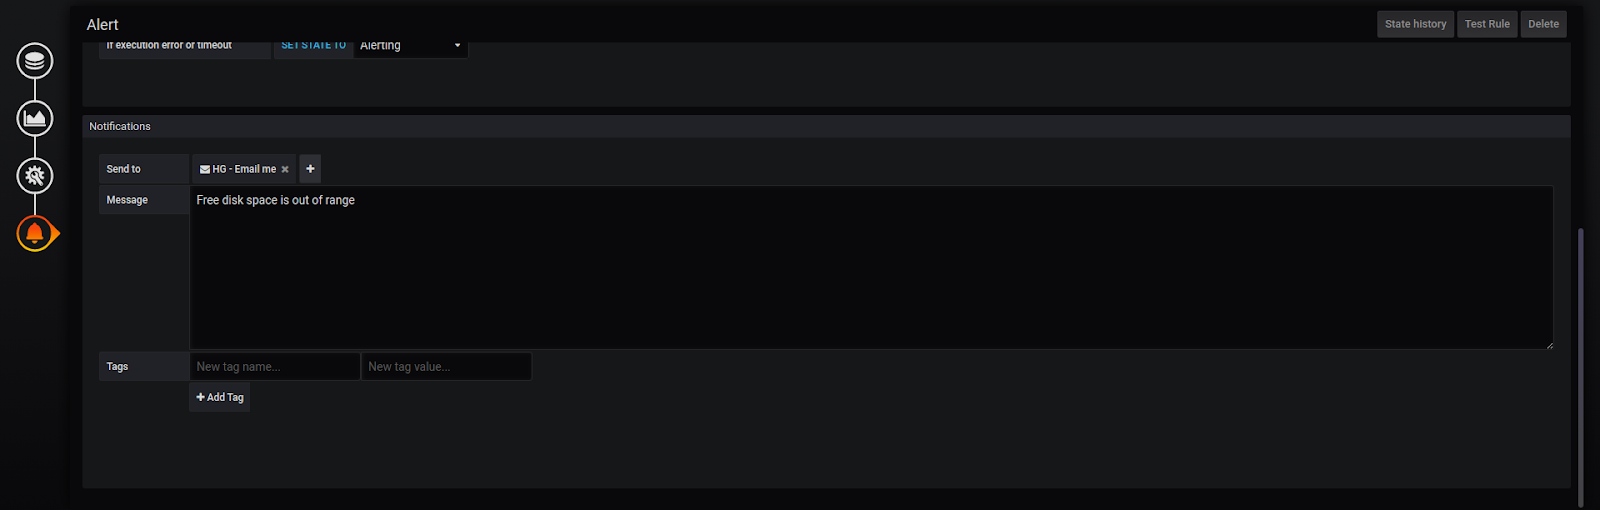
At the bottom of the page, you can see the Notification section. There we must specify the channel of notification and the message to the recipients. The trial version of MetricFire supports the predefined “HG-Email me” channel. This means that for now, the only recipient is your email address.
Save the dashboard and changes will be applied. The result of the previous steps is the panel below:
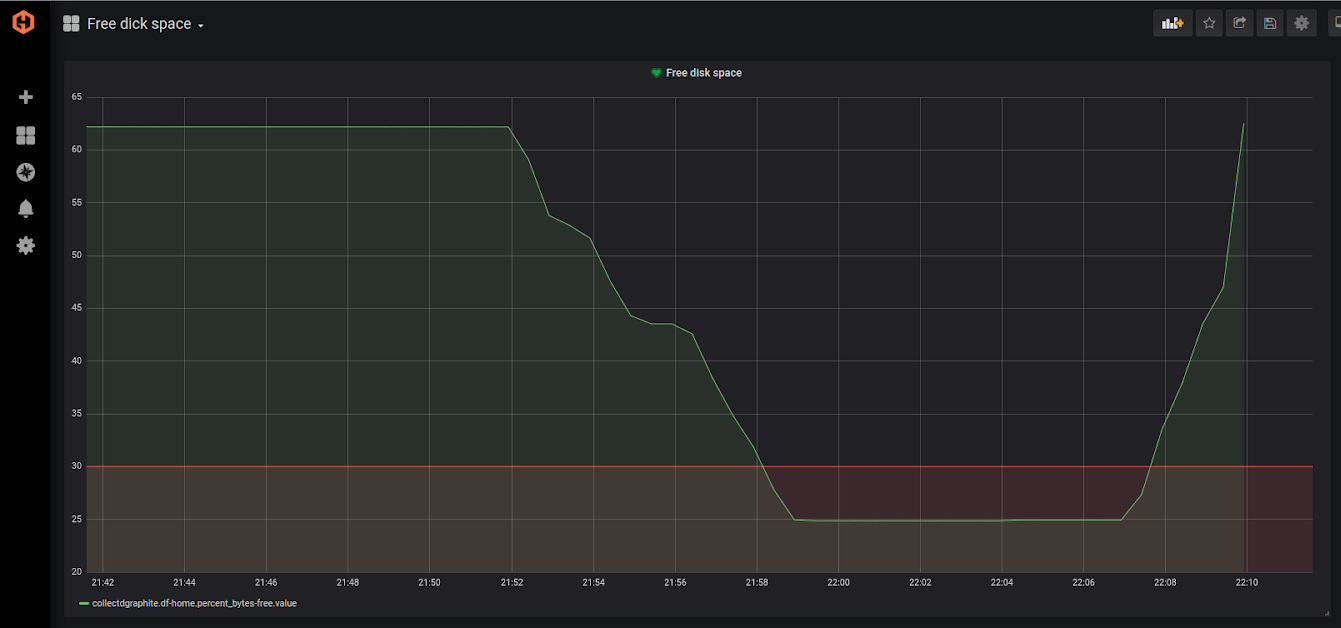
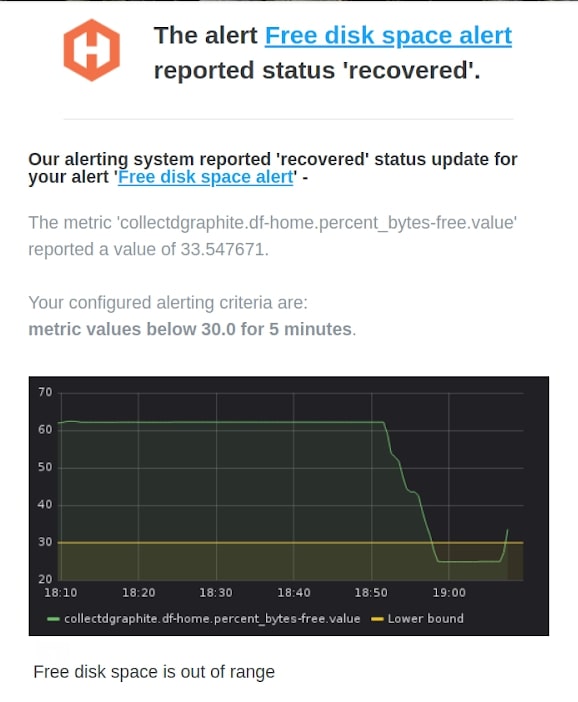
As you can see, our threshold is visualized by the red line. Note, that free disk space dropped below 30 percent for several minutes. The alert triggered the following email:
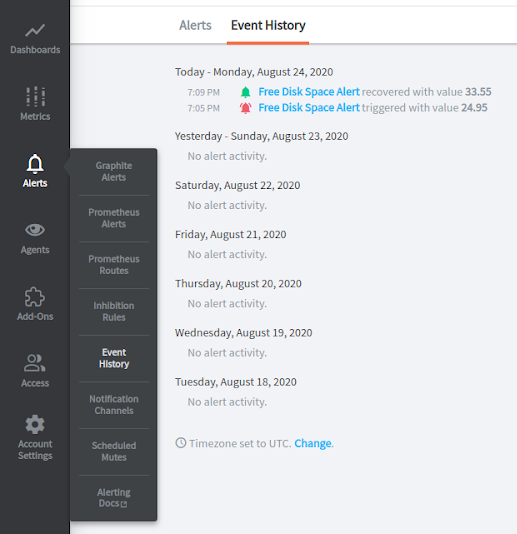
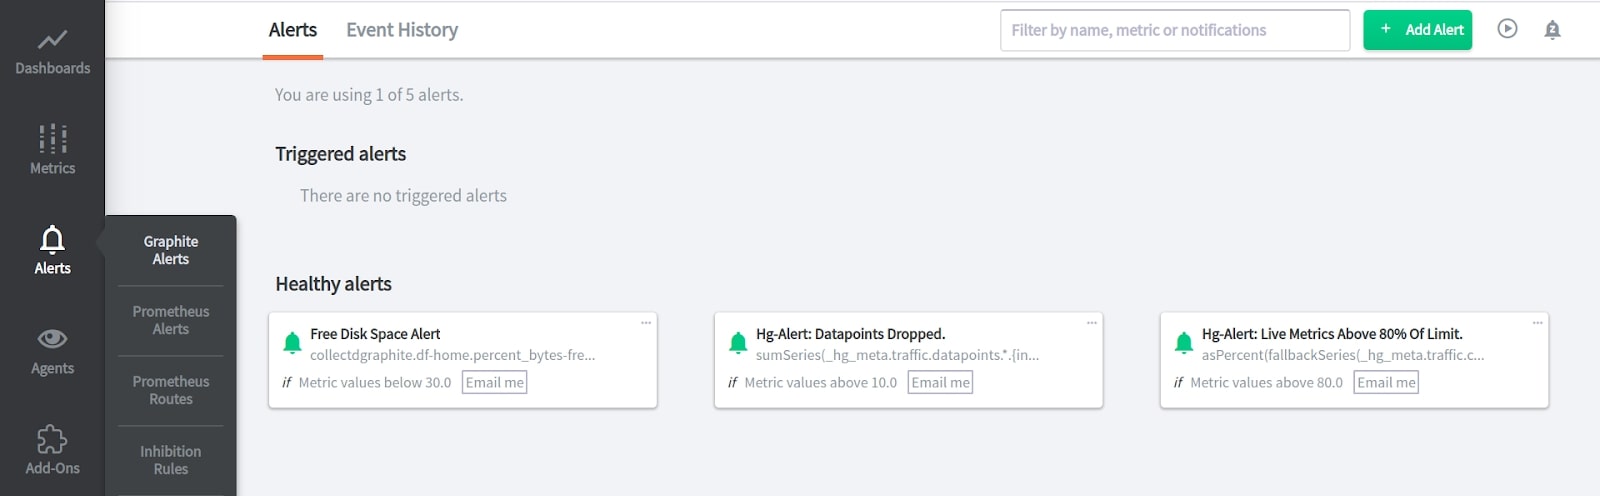
MetricFire has an alert overview section, where you can manage all your alerts. Click on the metric name to see a recent graph of this metric. Also, you can see the history of alerting.
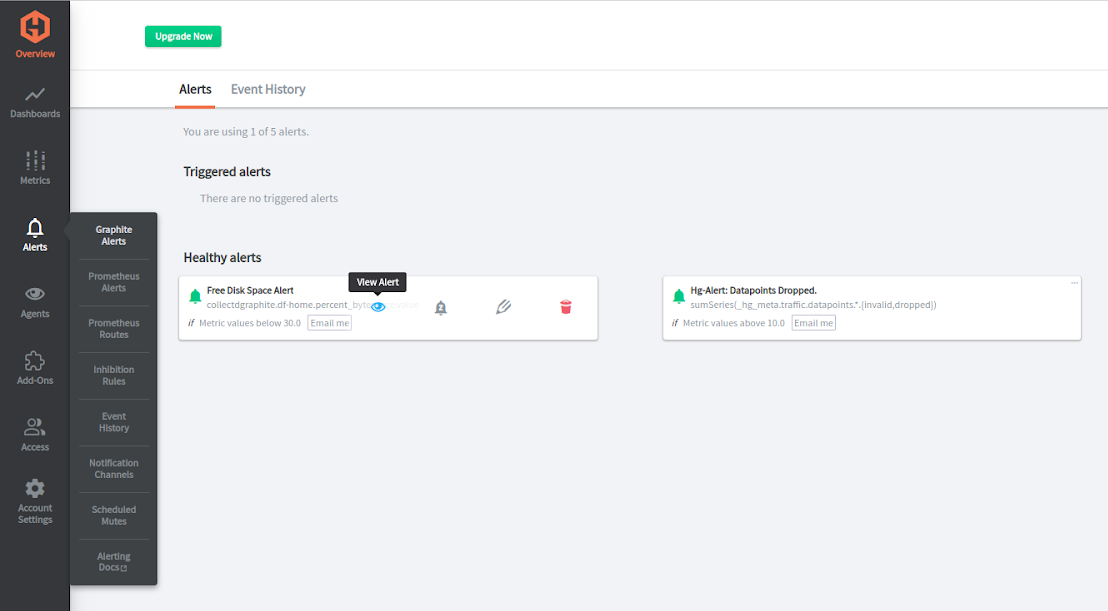
You can create alerts directly from the alert overview section. To do this, click “Add Alert” on the right.
Conclusion
In this article, we overviewed basic methods of anomaly detection and learned about how MetricFire's Hosted Graphite can notify us of anomalies in the metrics that we're monitoring.
Additionally, if you need a complex monitoring and alerting product for your business, MetricFire has a great solution for you. You can use it with minimal configuration to gain in-depth insight into your environment. If you would like to learn more about it please book a demo with us, or sign on for the free trial today.


