
Table of Contents
Great systems are not just built. They are monitored.
MetricFire runs Graphite and Grafana as a fully managed service for growing engineering teams, taking care of storage, scaling, and version updates so your team doesn't have to. Plans start at $19/month, billed per metric namespace rather than per host, and include engineer-staffed support. Integrations work natively with Heroku, AWS, Azure, and GCP, and data is stored with 3× redundancy in SOC2- and ISO:27001-certified data centres.
Introduction
Apache Spark is a powerful tool for processing and analyzing large datasets quickly, whether you're cleaning data for a report, running machine learning models, or analyzing real-time data streams. It's widely used for everything from building big data pipelines to crunching numbers for advanced analytics, thanks to its speed and scalability across clusters. Exporting Spark metrics to a Graphite backend makes it easy to monitor resource usage and job performance, giving you a clear view of how your cluster is performing. Plus, with tools like Grafana, you can turn those metrics into insightful visual dashboards, helping you troubleshoot issues and fine-tune your workflows.
In this article, we'll explain how to output Apache Spark metrics to the Hosted Graphite data source.
Getting Started with Apache Spark
This article assumes that you already have a production-level instance of Spark running. If not, you can follow the example below (Linux) to install Spark and test the Graphite metric sink:
- install dependencies: sudo apt install -y openjdk-11-jdk wget tar
- download/extract:
- wget https://downloads.apache.org/spark/spark-3.5.3/spark-3.5.3-bin-hadoop3.tgztar -xvf spark-3.5.0-bin-hadoop3.tgz
- sudo tar -xvzf spark-3.5.3-bin-hadoop3.tgz
- sudo mv spark-3.5.3-bin-hadoop3 /opt/spark
- verify: spark-shell
- create a metric config file at: /opt/spark/conf/metrics.properties
*.sink.graphite.class=org.apache.spark.metrics.sink.GraphiteSink
*.sink.graphite.host=carbon.hostedgraphite.com
*.sink.graphite.port=2003
*.sink.graphite.period=10
*.sink.graphite.unit=seconds
*.sink.graphite.prefix=<your-api-key>
- start spark: sudo /opt/spark/sbin/start-master.sh
- expected output:
starting org.apache.spark.deploy.master.Master, logging to /opt/spark/logs/spark-root-org.apache.spark.deploy.master.Master-1-<host>.out
- expected output:
- confirm log reports: tail -f /opt/spark/logs/spark-root-org.apache.spark.deploy.master.Master-1-<host>.out
- NOTE: default spark master port is :8080, if that port is already in use it will switch to :8081
- if needed, allow outbound traffic on :8081: sudo ufw allow 8081
- connect your server to the spark UI in the browser at: http://<host>.com:8081/
- start a worker process: sudo /opt/spark/sbin/start-worker.sh spark://<host>.com:7077
- expected output:
starting org.apache.spark.deploy.worker.Worker, logging to /opt/spark/logs/spark-root-org.apache.spark.deploy.worker.Worker-1-<host>.out
- expected output:
- run an example job to calculate PI:
- spark-submit --class org.apache.spark.examples.SparkPi \
--master spark://<host>.com:7077 \
$SPARK_HOME/examples/jars/spark-examples_2.12-3.5.3.jar 100 > pi_output.txt - see calculation written to internal file: cat pi_output.txt
- spark-submit --class org.apache.spark.examples.SparkPi \
- run another example job to calculate word count from the spark read.me file:
- spark-submit --class org.apache.spark.examples.JavaWordCount \
--master spark://<host>.com:7077 \
$SPARK_HOME/examples/jars/spark-examples_2.12-3.5.3.jar \
$SPARK_HOME/README.md
- spark-submit --class org.apache.spark.examples.JavaWordCount \
- you can track all job (application) stats in the Spark browser UI:
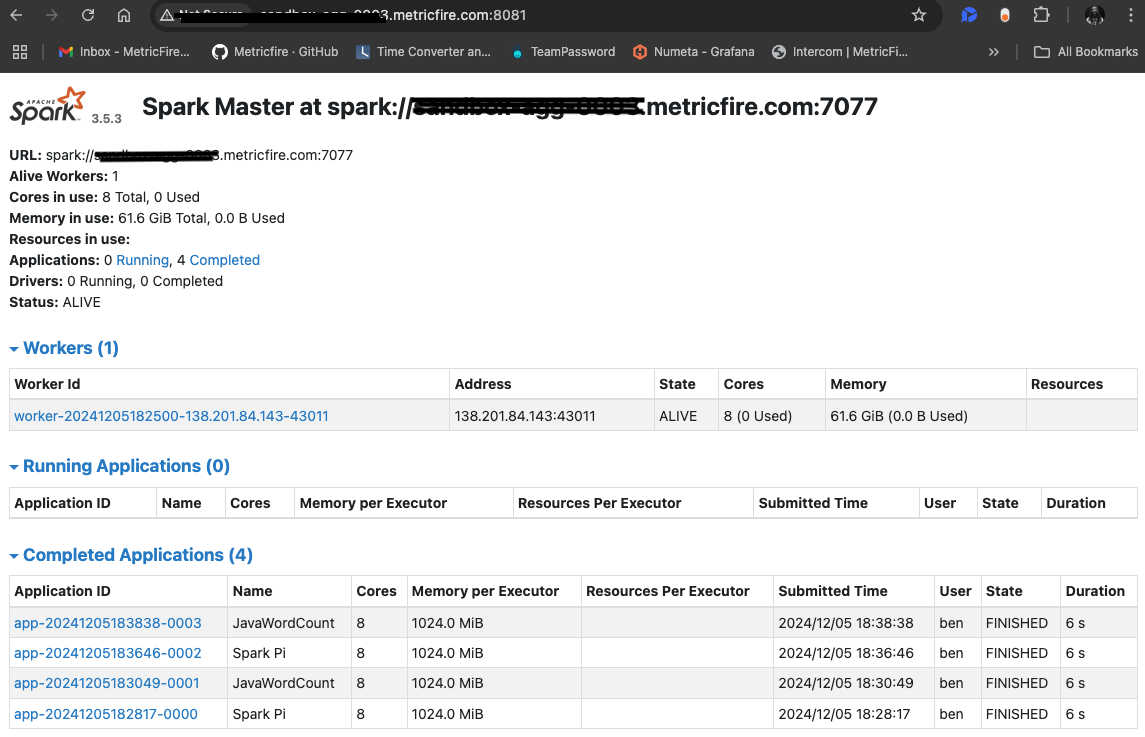
These statistics will also be forwarded as Graphite metrics, to your Hosted Graphite account.
To reduce metric overhead, you could consider adding a similar filter to your metric config file at: /opt/spark/conf/metrics.properties
application.sink.graphite.metricsFilter=executor.activeTasks|executor.failedTasks|executor.successfulTasks|jvm.heap.usage
Now you can use these metrics to create custom dashboards and alerts in Hosted Graphite. See our related blog article for more details, and the official Spark documentation for more information on configuring metric outputs.
Use Hosted Graphite by MetricFire to Create Custom Dashboards and Alerts
MetricFire is a monitoring platform that enables you to gather, visualize and analyze metrics and data from servers, databases, networks, processes, devices, and applications. Using MetricFire, you can effortlessly identify problems and optimize resources within your infrastructure. Hosted Graphite by MetricFire removes the burden of self-hosting your monitoring solution, allowing you more time and freedom to work on your most important tasks.
Once you have signed up for a Hosted Graphite account and used the above steps to configure your server(s) with the Telegraf Agent, metrics will be forwarded, timestamped, and aggregated into the Hosted Graphite backend.
-
Metrics will be sent and stored in the Graphite format of: metric.name.path <numeric-value> <unix-timestamp>
-
The dot notation format provides a tree-like data structure, making it efficient to query
-
Metrics are stored in your Hosted Graphite account for two years, and you can use them to create custom Alerts and Grafana dashboards.
Build Dashboards in Hosted Graphite's Hosted Grafana
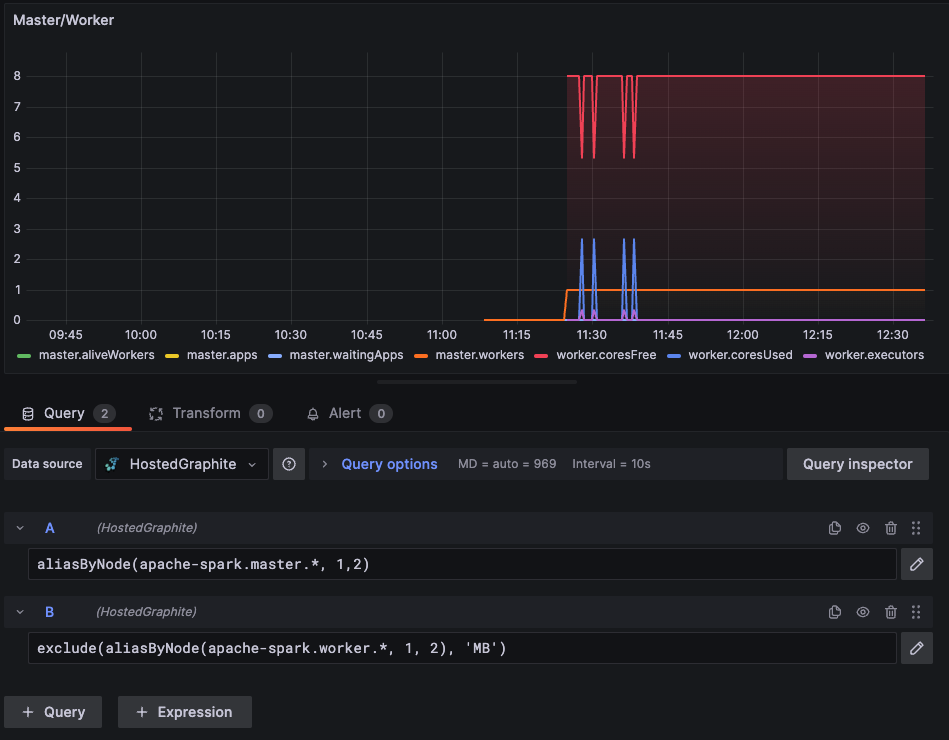
In the Hosted Graphite UI, navigate to Dashboards and select + New Dashboard to create a new visualization.
Then go into Edit mode and use the Query UI to select a graphite metric path (the default data source will be the HostedGraphite backend if you are accessing Grafana via your HG account).
The HG datasource also supports wildcard (*) searching to grab all metrics that match a specified path.
Now you can apply Graphite functions to these metrics like aliasByNode() to reformat the metric name, and exclude() to omit specified patterns.
Grafana has many additional options to apply different visualizations, modify the display, set units of measurement, and some more advanced features like configuring dashboard variables and event annotations.
See the Hosted Graphite dashboard docs for more details.
Creating Graphite Alerts
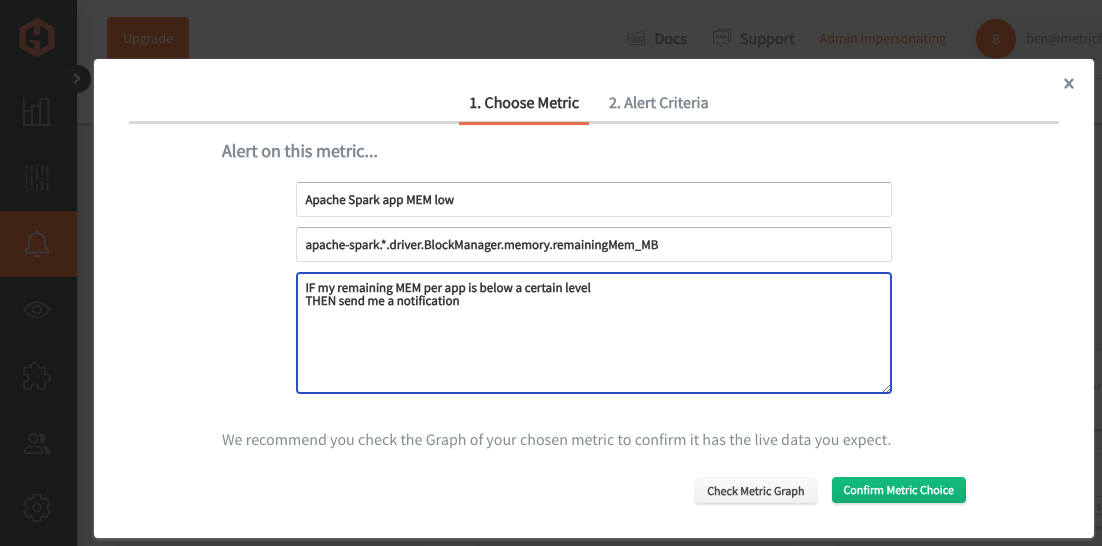
In the Hosted Graphite UI, navigate to Alerts => Graphite Alerts to create a new alert. Name the alert, add a query to the alerting metric field, and add a description of what this alert is:
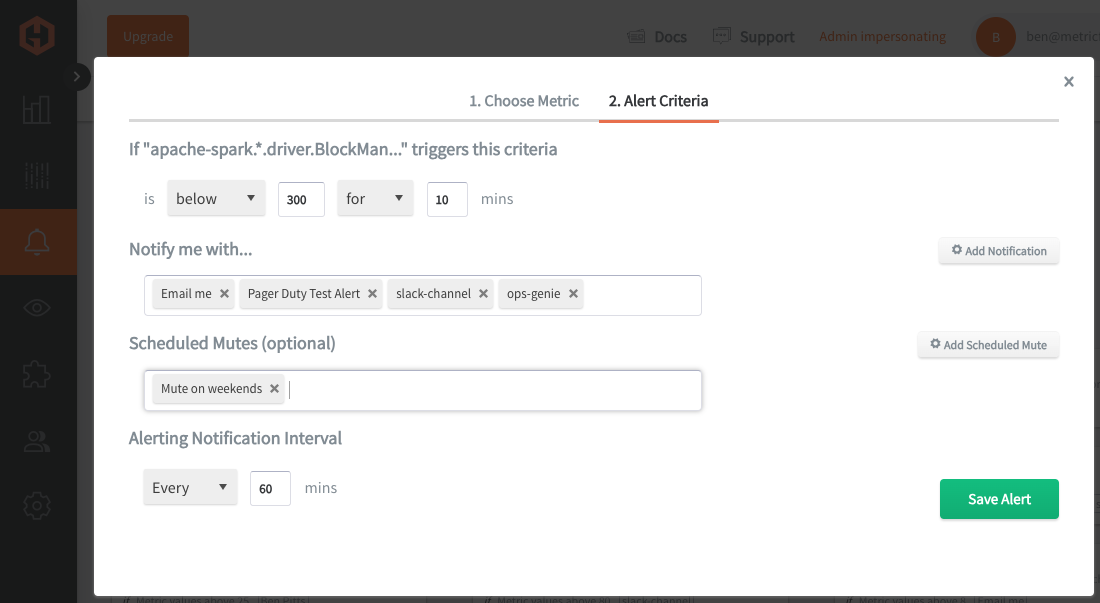
Then, select the Alert Criteria tab to set a threshold and select a notification channel. The default notification channel will be the email you used to sign up for the Hosted Graphite account. Still, you can easily configure channels for Slack, PagerDuty, Microsoft Teams, OpsGenie, custom webhooks and more. See the Hosted Graphite docs for more details on notification channels:
Conclusion
Monitoring Spark metrics is crucial because it provides visibility into how your cluster and applications are performing, helping you identify bottlenecks, optimize resource usage, and maintain system reliability. By tracking these metrics, you can ensure your Spark jobs run smoothly, efficiently, and deliver the insights you need without unexpected downtime or inefficiencies.
Sign up for the free trial and begin monitoring your infrastructure today. You can also book a demo and talk to the MetricFire team directly about your monitoring needs.

