
Table of Contents
Great systems are not just built. They are monitored.
MetricFire runs Graphite and Grafana as a fully managed service for growing engineering teams, taking care of storage, scaling, and version updates so your team doesn't have to. Plans start at $19/month, billed per metric namespace rather than per host, and include engineer-staffed support. Integrations work natively with Heroku, AWS, Azure, and GCP, and data is stored with 3× redundancy in SOC2- and ISO:27001-certified data centres.
Introduction
In this article, we compare two popular monitoring solutions, Prometheus and Nagios, to help you select the right tool for your infrastructure. Prometheus is an open-source monitoring system with a powerful time series database, while Nagios is a proprietary software for server, network, and log monitoring. We'll discuss their features, pricing, and use cases to assist you in making an informed decision.
Prometheus offers a multi-dimensional data model, allowing you to define metrics using names and tags. Nagios excels in server, network, and application monitoring, with scalability and extensive integration capabilities. It offers server performance monitoring, capacity planning, and snapshot configurations. Nagios Fusion combines network infrastructure and log monitoring.
Key Takeaways
- Prometheus can provide a dimensional data model where metrics are identified by a metric name and tags with built-in storage, graphing, and alerting.
- Prometheus is open-source and free.
- Nagios is a legacy IT infrastructure monitoring tool focusing on server, network, and application monitoring.
What is Prometheus?
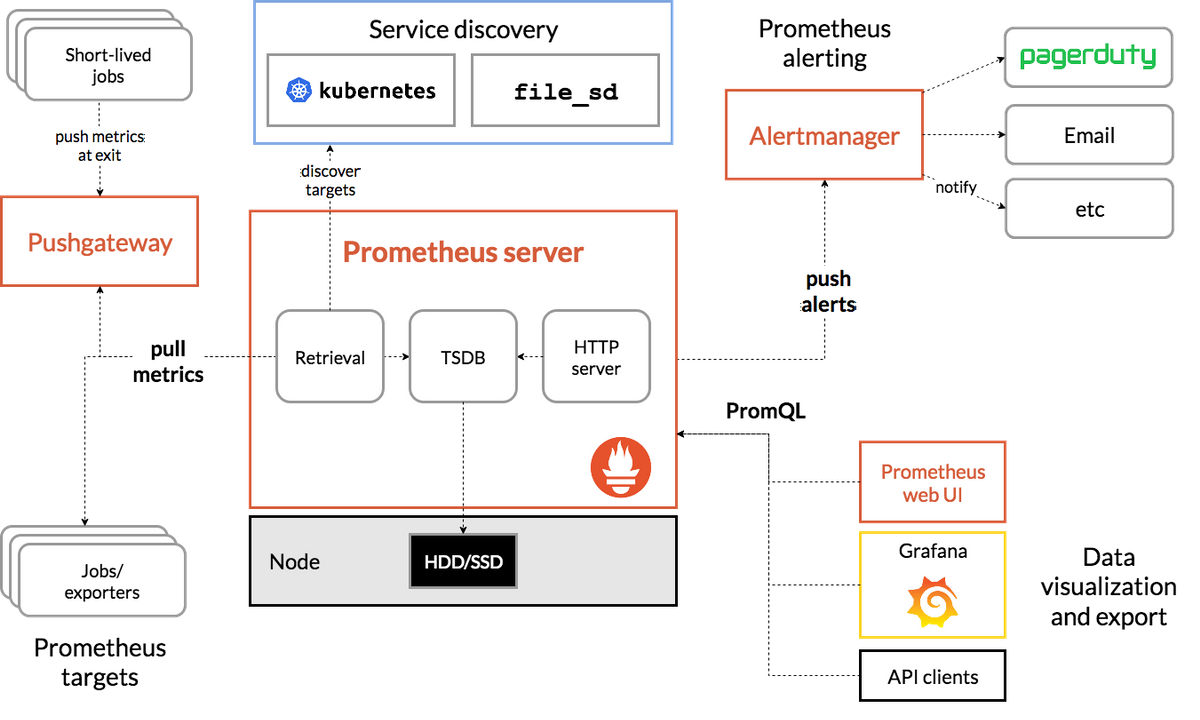
Prometheus is an open-source monitoring system built around a time series database, able to receive data and store it, in addition to supporting queries, graphs, and in-built alerting. Connecting to target endpoints to request metrics via HTTP, Prometheus provides a multi-dimensional data model wherein you can define metrics by names and/or tags that identify them as part of a unique time series. The Prometheus query language (PromQL) can then explore metrics and draw simple graphs. For organizations looking to integrate monitoring data with other systems and applications, Integrate.io offers powerful ETL and data integration capabilities that can help you build pipelines connecting your monitoring metrics across databases, APIs, and data warehouses for comprehensive analytics and reporting.
Get our free trial and start using Hosted Graphite in minutes. You can see if MetricFire is the right fit for you. If you have any questions, you can always book a demo and talk to us directly.
Try our Hosted Graphite solution to help monitor Kubernetes and all the other systems and applications you need. With the Hosted Graphite solution, you get:
- Three times the redundancy storage than the old, file-based default Graphite storage. That means improved data protection and seamless scaling.
- Automated control of Hosted Graphite resources through MetricFire's APIs
- Viewing and organizing of important metrics through stored data using helpful tags
You also get team accounts, dashboard permissions, integrations, a built-in agent, and tons of other benefits. Learn more here.
Try MetricFire now!
Interested to see how MetricFire can help you with the process and help you get new organizational insight? Now's the time! Try a free trial or book a demo.
What is Nagios?
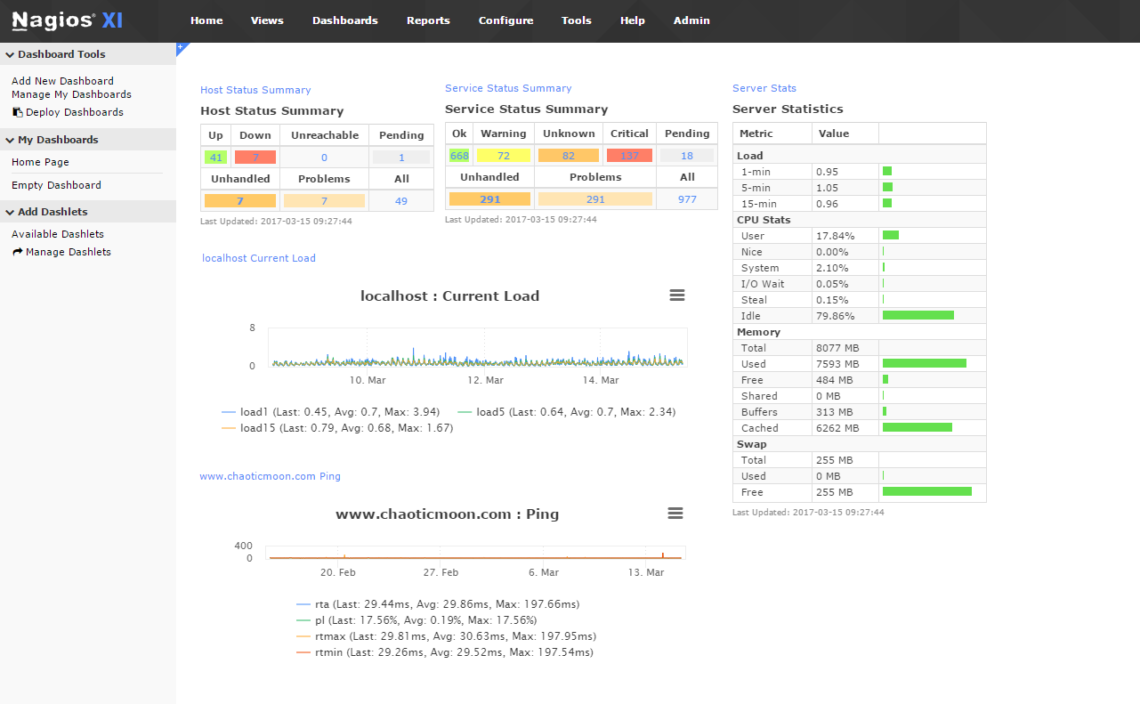
Nagios is a proprietary software for server, network, and log monitoring. Nagios can monitor all parts of an infrastructure, such as applications, services, operating systems, network protocols, systems metrics, and network infrastructure. Nagios can integrate with hundreds of third-party plugins.
Nagios also has really powerful server performance, allowing Nagios to process limitless scalability of metrics with high uptime. Nagios has a web interface and advanced dashboarding for visualization. Nagios also allows users to do capacity planning, snapshot configurations so they can get saved and reused, and infrastructure management. You'll need different products if you want to monitor network infrastructure or logs, and a third product called Nagios Fusion ties them both together.
When to use Nagios?
Use Nagios when you
- want to monitor servers.
- want to monitor networks.
- want to monitor applications.
- need Windows or Linux monitoring.
- need log monitoring.
Pricing comparison
- Prometheus is open source and free.
- Nagios Enterprise starts at 3495 USD per month.
Conclusion
In this comparison between Prometheus and Nagios, we have examined the key features, pricing, and use cases of these two monitoring solutions. Prometheus stands out as an open-source system with a multi-dimensional data model, offering storage, graphing, and alerting capabilities. On the other hand, Nagios is a legacy IT infrastructure monitoring tool, focusing on server, network, and application monitoring with powerful scalability and integration options.
Prometheus, being open source, provides a cost-effective solution for organizations, while Nagios Enterprise comes with a higher price tag. Both tools have their strengths and target different monitoring needs.
To summarize, if you require a time series database monitoring solution with flexible metric identification, long-term storage, and cross-data source alerts, Hosted Prometheus by MetricFire is worth considering. If you prioritize server, network, and application monitoring, especially in Windows or Linux environments, Nagios can meet your requirements.
Take advantage of MetricFire's offerings, such as Hosted Graphite, to enhance your monitoring environment and gain new organizational insights. Begin with a free trial and don't hesitate to book a demo if you have any further questions about Prometheus and its benefits.
Get to know our Hosted Graphite better and check out how MetricFire can fit into your monitoring environment! Get a free trial and start using Graphite now. Feel free to book a demo if you have questions about what Prometheus can do for you.