


Table of Contents
- Introduction
- Key Takeaways
- Key metrics
- Benefits of monitoring
- SQL Server Monitoring Tools: A comparison
Great systems are not just built. They are monitored.
MetricFire runs Graphite and Grafana as a fully managed service for growing engineering teams, taking care of storage, scaling, and version updates so your team doesn't have to. Plans start at $19/month, billed per metric namespace rather than per host, and include engineer-staffed support. Integrations work natively with Heroku, AWS, Azure, and GCP, and data is stored with 3× redundancy in SOC2- and ISO:27001-certified data centres.
Introduction
SQL Server Monitoring has become an essential part of modern-day applications since a major chunk of these applications rely heavily on a database. It is therefore important to monitor your metrics and make the best out of your database services.
SQL Server Monitoring offers plenty of metrics to choose from. We will be breaking down the five key categories that an SQL server provides for a comprehensive view of their functionality.
- Transact SQL Metrics
- Buffer Cache Metrics
- Metrics for Locks
- Metrics for Resource Monitoring
- Indexing
We will also be looking at the benefits of SQL Server Monitoring along with the prevalent monitoring tools. At the end of this article, we will compare key features and pricing of SQL Server Monitoring tools in the market.
You can jump into our Metricfire free trial and get started on SQL Server Monitoring right away, or book a demo and talk with us directly about your monitoring needs. Once you've got your SQL server metrics and you want to visualize them, check out some great visualization tools here.
Key Takeaways
- SQL Server Monitoring is crucial for modern applications heavily reliant on databases to optimize database services and performance.
- Transact SQL metrics, including batch requests per second, SQL compilations per second, and last elapsed time, play a pivotal role in optimizing SQL server performance.
- Buffer cache metrics, such as buffer cache hit ratio, checkpoint pages per second, and page life expectancy, help in minimizing disk I/O and enhancing overall SQL Server efficiency.
- Metrics for locks, such as average wait lock time and lock waits per second, help in managing resource access and preventing performance bottlenecks.
- Resource Monitoring metrics include CPU usage, memory usage, disk I/O operations, disk queue length, memory pages per second, and latch wait time for effective resource allocation.
Key metrics
Transact SQL (T-SQL) metrics
Transact SQL (T-SQL) is an extension of the conventional Structured Query Language (SQL) designed to interact with relational databases. T-SQL extension adds several features to the SQL server including error handling, transaction control, and row processing to name a few.
But how are these functions related to SQL Server Monitoring? Well, the row processing functionality lets you write queries in batches so that you can pass a stream of statements performing certain operations. They are then treated as a single batch by the SQL server.
Batching, compiling, and caching T-SQL’s streamlined statements with the SQL server minimizes the overall latency of your application. Here are three key metrics for Transact SQL that play a pivotal role in your server optimization.
Batch requests per second
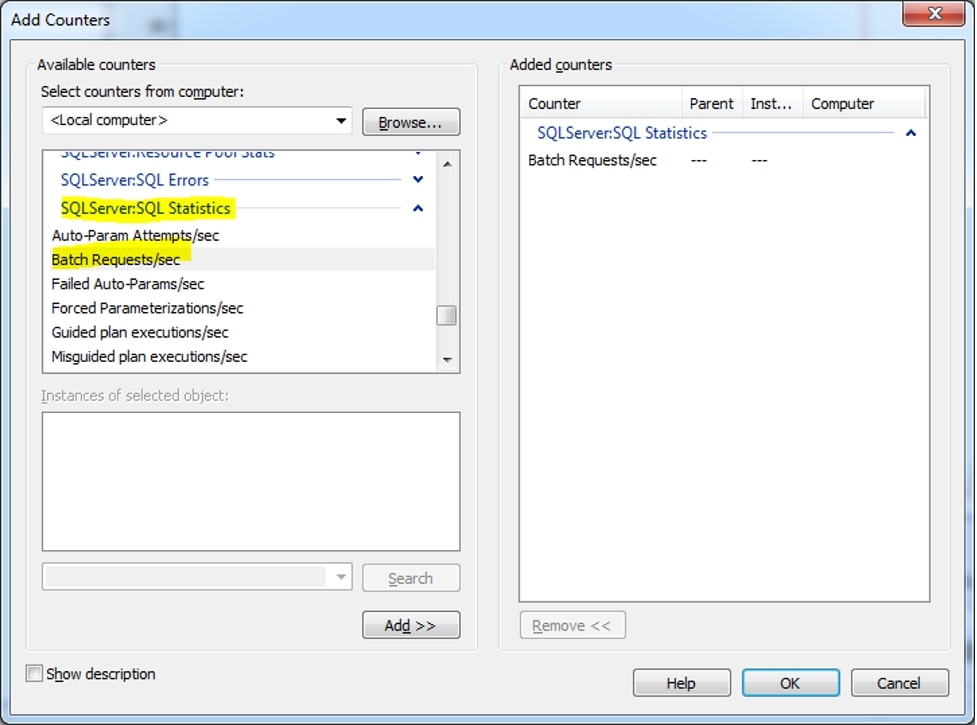
As the name suggests, batch requests per second give you an overall high-level view of the database in terms of how many batch requests it encounters per second. An unexpected change in Batch requests can, thus, advocate for your performance issues.
SQL compilations per second
SQL Compilations per second indicates the number of compilations an SQL server needs to perform and stores it in the cache for its execution. Ideally, a query should be compiled once so that it can also be referenced in the future.
However, in an unlikely case where each query is referenced just once, the number of compilations per second can become equivalent to the number of batch requests per second. This is certainly a performance bottleneck for which optimization techniques need to be reviewed again.
This is a scenario where both metrics - Batch Requests/second and SQL Compilations/second play a substantial role in providing a thorough comparison. One more reason to add Metricfire’s SQL Server Monitoring to your application!
Last elapsed time
SQL Server caches T-SQL queries after compilation to minimize the latency and improve performance. You can view the aggregated statistics of such queries present in your cache to get an idea of how much time is spent in execution. Last elapsed time is one such statistic that gives you a little insight into your SQL server.
You can view these statistics using sys.dm_exec_query_stats. The output would look something like this:
|
Column name |
Data type |
Description |
|
database_id |
int |
Database ID of the stored procedure |
|
object_id |
int |
Object Identification number of the stored procedure |
|
type |
char(2) |
Type of the object stored P = SQL stored procedure PC = Assembly stored procedure (CLR) X = Extended stored procedure |
|
total_elapsed_time |
bigint |
Total elapsed time for completed executions of this stored procedure (in microseconds but only accurate up to milliseconds). |
|
last_elapsed_time |
bigint |
The elapsed time for the most recent completed execution of this stored procedure (in microseconds but only accurate up to milliseconds). |
The elapsed time within the SQL server gives you an idea of the query’s execution time. If your execution plans encounter a bottleneck, it will be a good idea to revisit your optimization techniques.
By no means is the above table an exhaustive list. To find the other metrics involved in the sys.dm_exec_query_stats view, you can visit the official documentation provided by Microsoft.
Note that the sys.dm_exec_query_stats view only stores these statistics for execution plans currently present in the cache. This implies that their lifetime depends on the amount of time they are stored in the cache and you will not be able to access them afterward. If you’re planning to store them in a table, you can refer to the plan_generation_num for more information.
Buffer cache metrics
The primary agenda of any SQL server is to optimize query retrieval by minimizing the total latency. Disk I/O can be an expensive operation and hence a major factor responsible for the overall efficiency of an SQL Server. For this reason, an SQL Server provides buffer management, a procedure comprising two main components:
Buffer manager: To access and update database pages
Buffer cache or Buffer pool: To reduce database file I/O
To see how buffer management works, visit this official documentation by Microsoft.
Since a major chunk of time is spent between the Buffer Cache and the Database while executing SQL queries, it instantly becomes an important part of the whole optimization process. We will be breaking down three key metrics to find out the determining factors of an SQL Server’s overall performance under this category.
Buffer cache hit ratio
The SQL Server calculates the buffer hit ratio as the proportion of pages found in the buffer cache compared to the number of pages read directly from the disk. Since reading from a disk is an expensive operation, you would want your SQL Server to find the majority of the pages from the buffer cache itself.
If the SQL Server monitoring results in a low hit ratio, one possible solution is to increase the size of the buffer cache by allocating it to more system memory. A good practice is aiming for a hit ratio of 90% or higher. This means that most of the requests are satisfied by the cache.
Checkpoint pages per second
When a page gets modified in the buffer cache, an SQL Server does not write it to the disk immediately. Instead, it marks it as a dirty page. During a checkpoint, the buffer manager is responsible for writing all such dirty pages back to the disk.
But there’s one problem: the buffer manager only writes some of the pages to make room for new pages within the buffer cache.
Checkpoints/second thus play a significant role in SQL Server Monitoring since you can change the resource allocation if the overall efficiency doesn’t turn out as expected. For instance, you can modify the memory allocation for the buffer cache or you can reconfigure your checkpoints by changing your recovery time.
Page life expectancy
SQL Server Monitoring provides two metrics within this category:
- Buffer Manager - Page Life Expectancy: Number of seconds for which a page will stay in the buffer pool without references.
- Buffer Node - Page Life Expectancy: Minimum number of seconds a page will stay in the buffer pool within this buffer node without references.
A Buffer Node allows the user to monitor the Buffer page distribution for each node following a Non-uniform Memory Access (NUMA) architecture. The Buffer Cache exists as one or more Buffer Nodes. The values obtained from the second category are averaged by the Buffer manager to calculate the Page Life Expectancy.
Pages are flushed either at a checkpoint or when the buffer cache requires more space. A higher value of the Page Life Expectancy metric indicates that your database accesses the buffer cache more often than the disk itself during a read, write, or update operation.
Since cache reference is less expensive than disk reference, a higher value of Page Life Expectancy is desired in SQL Server Monitoring.
Metrics for locks
Average wait lock time
An SQL Server locks the resources when accessed by multiple users to avoid any misreads. The SQL Server also provides several locks metrics among the average wait lock time. The Average Wait lock time should be as short as possible as you do not want your users to be waiting for resources for too long.
To determine how you can manage your lock time, follow this link.
Lock waits per second
If the lock waits/second metric has a higher value than expected then it means your resources often wait longer for the locks to be lifted. This may be a case of lock escalation.
Lock escalation is a mechanism followed by the SQL Server to convert multiple fine-grained locks into table locks to reduce the overall latency. SQL takes into account the total number of locks and memory utilized by them. Only after it is certain that the decision would improve performance, SQL makes this decision.
However, there might be a scenario where this default mechanism blocks other users which is not desirable. To prevent lock escalations, simply keep your transactions short by breaking up large batch operations into smaller ones. Another alternative could include moving to less restrictive locks. For more information, follow this link.
Metrics for Resource Monitoring.
The SQL Server Resource Governor lets you fragment your resources into different pools so that you can set certain limits on CPU Usage, Disk I/O, and memory according to your application’s demands.
It is, however, important to verify if the resources are distributed as intended. Therefore, we will discuss six key metrics in this category to help you determine potential performance difficulties.
CPU Usage %
MIN_CPU_PERCENT and MAX_CPU_PERCENT let you decide on the allowed bandwidth for a specified resource pool at the time of a CPU contention. These parameters give you the flexibility to assign predictable values of the CPU usage and customize them according to a given task.
Memory Usage %
MIN_MEMORY_PERCENT and MAX_MEMORY_PERCENT parameters signify the amount of memory assigned per resource pool. These are different from the CPU usage parameters because the memory assigned for a particular resource will not be shared by another, even when the current resource has no active requests.
It is thus recommended to cautiously assign these resources. MAX_MEMORY_PERCENT conveys that when active requests are running on this pool, this would be the maximum amount of memory available.
Disk I/O operations
MIN_IOPS_PER_VOLUME and MAX_IOPS_PER_VOLUME are used to control physical IO operations carried out for user threads per resource pool. By setting these values, you can see how often your pools approach this constraint and if there exists an alternative for better efficiency.
Disk queue length
Average Disk Queue Length is the average number of read-and-write requests queued on a particular disk. Higher values convey latency associated with reading data from the disk and writing back to it.
A trivial solution could be to increase the disk capacity, however, it is important to refer to other metrics such as wait and file statistics before concluding.
Memory pages per second
Memory pages per second is an indicator that can help you identify the faults causing system-wide delays. A significantly higher value signifies that the rate of paging memory to and from the disk is too high, causing the overall performance to diminish.
This happens when one or more applications are using the memory heavily and the system is transferring data to fulfill the demands. Possible solutions include monitoring your page fault statistics and scaling back the number of running applications.
Latch wait time
An SQL Server uses latches to maintain data integrity across shared resources. These synchronization objects can be classified into two major classes: Buffer and Non-Buffer.
With sys.dm_os_latch_stats, you can view your latch statistics in case of a delay. Latch wait delay occurs when the I/O systems can not keep up with the active requests for a long duration of time and take longer than usual to fetch pages from disks to memory.
Indexing
Relational databases follow indexing for faster retrieval of data. However, as the data grows, so do the indexes.
Page splits per second
Indexes are stored in pages by the SQL Server much like the data. When the pages are too full to accommodate any new indexes, a page split occurs. The server transfers half the data to the other index page which consumes I/O resources. Page splits can be prevented by specifying a fill-factor option.
The fill-factor option determines the percentage up to which the page will be filled with data while the rest of it remains free for future growth. For a fill-factor value of 70, 30% of each index page will be left empty for its expansion in case some data is added to the underlying table.
Try out MetricFire’s free trial so you can start SQL Server Monitoring these key metrics. If you are unsure about your monitoring needs, feel free to book a demo and talk with us directly.
Benefits of monitoring
|
#1: Automated Monitoring |
#2: Performance Visualization |
#3: Manage Potential risks |
#4: Cost Optimization |
|
Manual monitoring of resources is a hassle since you would be running a number of scripts before you can detect a potential performance bottleneck. This costs time and productivity. Why not switch to a more automated approach? |
A large amount of data is difficult to read. SQL Server Monitoring lets you visualize the performance trends over a period of time to make the best use of your valuable resources. |
Continuous Monitoring helps reduce the risk of the system going down since you would be working on outliers beforehand. A system’s downtime can greatly impact productivity and infrastructure costs. |
With SQL Server Monitoring, you can ensure your system’s optimal efficiency by determining the factors contributing to query latency. This way you can reduce the overall infrastructure cost of your application. |
SQL Server Monitoring Tools: A comparison
|
Monitoring tools |
Key Features |
Pricing |
Free Trial |
|
#1: Out-of-box scaling #2: Backs up your data automatically
#3: Provides high security using Secure Sockets Layer (SSL) #4: Automatic updates with 24/7 on-call support |
Starts at $85/month Basic: 6 months retention, 2 users Premium: 2 years retention, 50 users |
Yes, a 14-day free trial is available here |
|
|
SolarWinds Database Performance Analyzer |
#1: Cross-platform Database support |
Starts at $1111 Perpetual Licensing: License to use the software indefinitely. Support is included for the first year with an option of renewing
|
Yes, a 14-day free trial is available |
|
#1: SQL Server Performance analytics in real-time with reports downloadable in PDF format. #2: Get alerts when your resources exceed a threshold value like CPU, Memory, Cache, Disk, etc. #3: Supported versions up to MS SQL Server 2014 |
Starts at $10/technician/month Standard: Up to 5 tech and 500 Nodes Professional: Starts from $21/technician/month Enterprise: Starts from $50/technician/month |
Yes, available here |
|
|
#1: Performance monitoring of physical, virtual, and cloud servers in real time. #2: Identify tempdb performance problems and efficiently manage the topology of high-availability groups. #3: Customised alerts for your industry and enterprise providing greater flexibility. #4: Allows you to view the complete blocking chain to identify blocks and deadlocks. |
Starts at $1996 per instance with maintenance include for the first year. Standard: Single license starting from $1996Pro: Single license at $2156 |
Yes, a 14-day free trial is available |
|
|
#1: Top SQL user interface with sortable grids, runtime charts, and, statistical analysis for all your troubleshooting problems. #2: Event Chain feature to set up SQL event workflows prior to conflicts. #3: Deadlock analysis to find and fix potential deadlock situations. #4: Machine Learning powered storage forecasting to managing your resources for multi-cloud environments. |
Starts with a $600 annual subscription Essentials: $600/instance |
15-day free trial available |
|
|
#1: A global overview giving you a glance at all your server instances, clusters, and virtual machines at once. #2: Uses intelligent baselines to find the root cause of the server’s performance issues. #3: Over 65 customizable alerts to optimize your performance are easily managed with PowerShell and the web API. #4: Hybrid Monitoring which supports Virtual Machines, Azure SQL Databases, Google Cloud, and Amazon RDS or EC2. |
Starts at $1565 excluding taxes with one year of support and maintenance. SQL Monitor: $1565 - single license SQL Toolbelt: 14 tools at $3495 - single license |
14-day free trial available |
|
|
#1: An SQL Sensor displaying the overall response time/execution time to notify the user when a certain threshold is crossed. #2: WMI sensors display the number of connections, and total logins/logouts per second to double-check your database load. #3: Supports multiple databases such as Microsoft SQL, Oracle, MySQL, PostgreSQL, etc. |
Starts at $1750 PRTG500: $1750 with 500 sensors and 1 server installation. |
30-day free trial available
今回は、OpenTelemetryを使ってNGINXのパフォーマンスを監視する方法を解説。NGINXの設定からOpenTelemetry Collectorの導入、Graphiteへのメトリクス送信、Grafanaダッシュボードやアラート作成までをわかりやすくご紹介します。 Continue Reading Telegrafを使用してNagiosプラグインを監視する方法を解説。Nagios Pluginsの設定、Telegraf execプラグインによるメトリクス収集、Hosted GraphiteとGrafanaを活用したダッシュボード・アラート構築までをステップごとに紹介します。 Continue Reading 本記事では、TelegrafとMetricFireを使用してRedisを監視する方法を解説。Telegraf Agentの設定、Redis入力プラグインの構成、Grafanaダッシュボードやアラート作成まで、Redis監視の手順をステップごとにご紹介します。 Continue Reading
Because our system is your system.
|


