


Table of Contents
Great systems are not just built. They are monitored.
MetricFire runs Graphite and Grafana as a fully managed service for growing engineering teams, taking care of storage, scaling, and version updates so your team doesn't have to. Plans start at $19/month, billed per metric namespace rather than per host, and include engineer-staffed support. Integrations work natively with Heroku, AWS, Azure, and GCP, and data is stored with 3× redundancy in SOC2- and ISO:27001-certified data centres.
cIntroduction
Dive into the article to learn how to monitor cloud server performance with Graphite and get started on your monitoring needs!
Application Performance Monitoring (APM) is a crucial part of the technological era. It refers to a methodological approach towards maintaining and sustaining a system’s health. It is extremely important to monitor an application’s health and performance upon launch and then regularly afterwards.
Most would say it has become as important as, if not more than, building the application itself. There are many APM tools available, but one of the most popular names in this category is Graphite. Graphite is an open-source tool built to be customized to the user’s monitoring needs.
In this article, we will look at how you can set up your Graphite monitoring solution to monitor your cloud server performance. MetricFire will help you gain in-depth knowledge of your systems with minimal configurational efforts and support to help get the ball moving.
To do this with minimal effort and maximum efficiency with help from our experts, book a demo with us, or sign up for the free trial today.
Cloud server performance monitoring purposes
With the increase that we see in SaaS businesses globally, every company in every industry is using the Cloud for one purpose or another. It could be as small as using communication software internally within the company or as huge as managing services and customer databases on the cloud.
Moving from on-site data storage infrastructure to the cloud has shifted security and maintenance needs drastically. Most in-house server monitoring has now needed to update to cloud server monitoring and maintenance. Businesses are now spending more towards their budget for cloud server performance checks and monitoring, than they are on native IT services, and are well justified in doing that.
For SaaS companies, maintaining cloud performance is crucial to their reputation among their customers. A minute of downtime in services can have drastic effects on their customer base.
To keep businesses thriving, it is of the utmost importance to have a system in place that runs regular checks on all systems and monitors your cloud server. This makes it easy and efficient to detect any potential or existing issues in the system to help you fix them immediately. This is what MetricFire helps you do with the most user-friendly system available.
Designed specifically to save you time on setting up a system to capture, display, and improve your system data and monitor it more efficiently. MetricFire captures data that will help you fix issues immediately without letting anything slip under the radar.
Choosing metrics for monitoring
Graphite is a tool that captures graphs of numerical data using a time-series technique. Time-series techniques refer to data capture techniques that note the same metrics at regular intervals. This then builds a set of values that are displayed as collected data per unit time.
Choosing the right data metrics that need to be captured is an important step in monitoring cloud server performance using Graphite. The choice of your metrics will determine how effectively the results will be displayed on your MetricFire dashboard. This will help you determine your system’s health over time and identify the pain-points in your cloud servers which you can then fix almost preemptively.
To start off, consider your server health in aspects such as CPU, RAM and port performance, and HTTP. Then, apart from infrastructure monitoring, it is also necessary to keep an eye on metrics specific to your application behavior.
Let’s say you have an email service in which you would be required to pull metrics on email deliverability. For SaaS companies offering email capabilities, tools like Sendspark demonstrate how critical performance monitoring becomes, especially when personalized video content is being delivered to thousands of prospects, where any latency or failure in your backend systems directly impacts customer engagement. You can then in turn allow the administrators to dig into how effectively emails are being delivered, and if the user is facing time-delays on email deliverability or delivery failures.
Once the data metrics have been chosen, there are a number of ways to capture this data and pull it into the Graphite software.
To get started on this right away, you can use MetricFire’s free 14-day trial or you can book a demo and talk to the MetricFire team about how we can best help you!
Building a Grafana dashboard
The first step to monitoring your cloud server performance is building a Grafana dashboard. This can be a simple process if the step-by-step guide is followed, and if you book a demo with MetricFire, one of our experts would be happy to guide you.
When you combine Grafana with the power of Graphite, it revolutionizes your dashboard experience with exactly the right metrics.
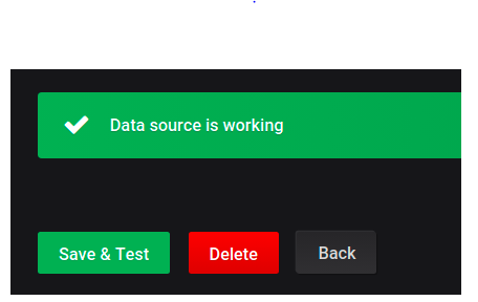
In order to build a dashboard, you need to get data on the system. You do this by adding a Graphite data source to Grafana by going to the Data Sources option in the configurations menu. When prompted to add the data source, choose Graphite and specify the parameters.
Click on Save and Test and you will get a message (as seen below) saying Data Source is Working. You can see this article for more details.
Creating a Dashboard:
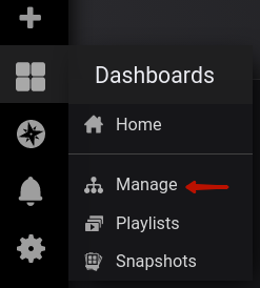
To create a dashboard, locate the dashboard drop-down menu and click on Manage.
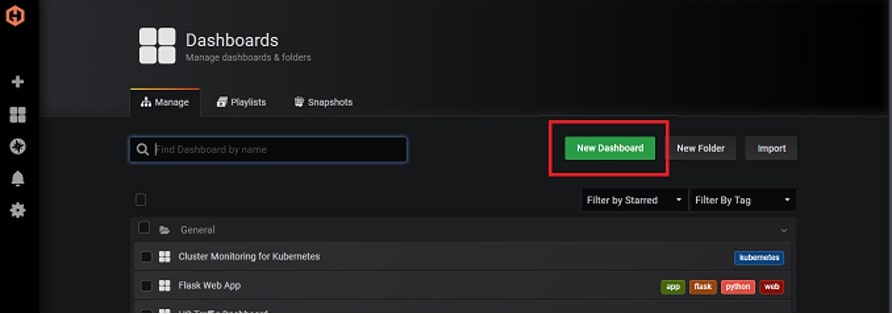
Now, click on the New Dashboard button.
The dashboard should have at least one panel on it so you need to Add Query.
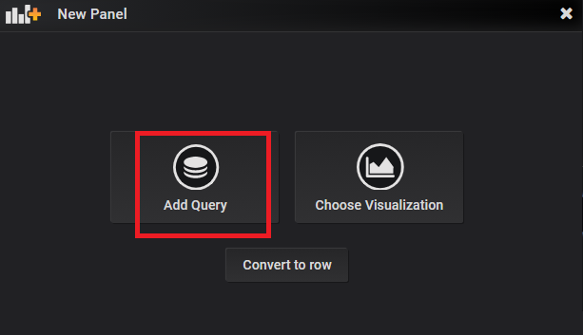
Once you do that, this is the window that you will see:
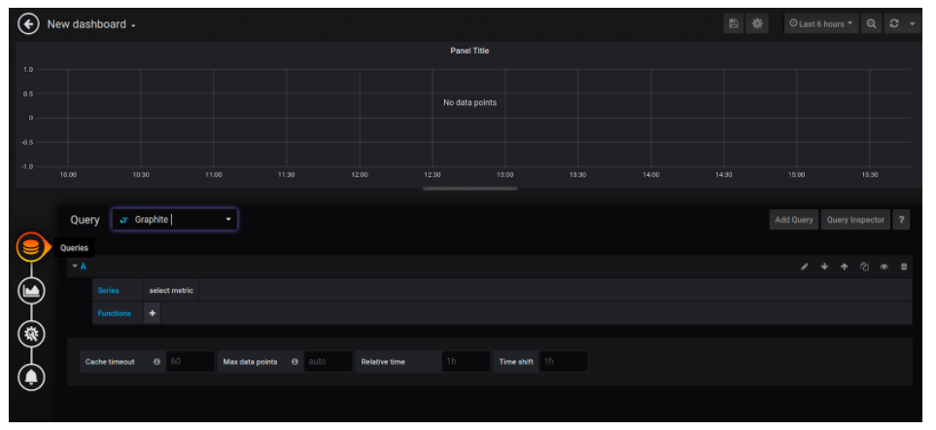
Here, you will create a query by adding a data source and choosing your metrics. This will give you a very basic graph for visualization. You can modify that by adding a transformation function and tweak it to adjust it to your requirements, adding complexity to the function as needed.
You can go to the dashboard’s general settings to manipulate the dashboard view, starting from the title of the dashboard and setting the refresh times for the dashboard. By adding more graphs to the dashboard, this is what our dashboard looks like:
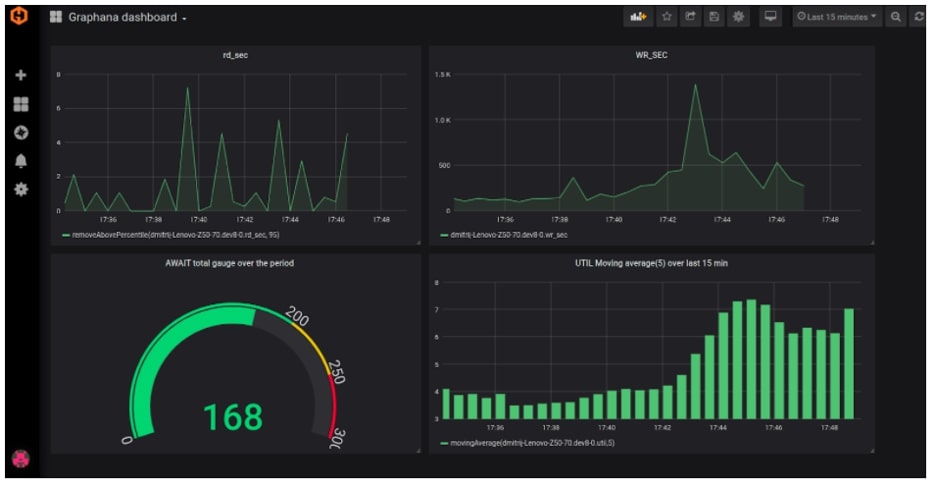
There is a lot more that can be done with just these two tools. Setting it up to monitor your cloud server performance is an effective use of this dashboard. When using Graphite data on Grafana dashboards, you can customize panel data, visualizations, charts, and other features that can be modified and customized as per your requirements.
You can use advanced options to configure graph displays, wildcards, performance, and data transformations. Graphite with Grafana gives you comprehensive dashboards to monitor your activity, and MetricFire helps you set it up in the simplest and most strategic way possible with our experts helping you along the way. It is the only platform that delivers this kind of accuracy and efficiency.
For more detailed enhancements and use of the Grafana dashboard, you can follow the detailed guide on dashboards and build one yourself or book a demo with MetricFire.
The advantages of Hosted Graphite solution from MetricFire
Setting up Graphite on your own is a hassle, to say the least. There is a ton of setup and scripting required just to set up the shell and then the configuration, on top of the added steps of building it up for just basic monitoring. It can be a huge task. People have been using solutions like Cloudwatch from AWS, but have to go through a difficult and complex process to set up their monitoring dashboards.
MetricFire helps you break this process down in terms of effort, and converges it into a series of small steps that can be followed to set up your own monitoring system to monitor cloud server performance. The steps are easy to follow and clearly laid out, making it easy for someone with basic technical knowledge to set it up with minimal supervision.
With a MetricFire's Hosted Graphite solution, you get more support for the metrics that you’re tagging compared to an open-source Graphite solution. MetricFire gives you a solution free of any installation dependencies and hourly data backups. The Hosted Graphite solution from MetricFire has been in the monitoring business for 7 years, guaranteeing a mature and stable platform.
When choosing other solutions such as CloudWatch, you do not get the kind of support that you could with MetricFire. Despite the amount of data hosted on AWS, it is still not the best monitoring tool compared to Graphite for a number of reasons such as a lack of customizations and is extremely expensive.
It is also extremely complex to set it up, while MetricFire relieves you of all such problems and lets you set up a Graphite solution with simple steps and exceptional frontline support.
To help you through Graphite configurations, go to MetricFire's blog or book a demo and we will help you set up and walk you through a solution to your problems. You can even sign up for a free 14 day trial!
Conclusion
Monitoring cloud server performance is essential to any business, but choosing the right tool is even more important. Graphite is one of the most reliable and dependable performance monitoring solutions for open-source code which can be set up and customized to your needs.
There are many things you need to consider, such as; assessing your business needs, choosing the right metrics, setting up your data metrics push, configuring your database, and creating efficient dashboards to measure performance metrics and identify potential problems.
To help you along with these processes, book a demo or sign up with MetricFire for a free trial today.


