

Table of Contents
- Introduction
- Challenges with Monitoring
- Advantages of StatsD and Pingdom
- Setting up StatsD and Pingdom
- MetricFire: Your One-Stop Monitoring Shop
- Conclusion
Great systems are not just built. They are monitored.
MetricFire runs Graphite and Grafana as a fully managed service for growing engineering teams, taking care of storage, scaling, and version updates so your team doesn't have to. Plans start at $19/month, billed per metric namespace rather than per host, and include engineer-staffed support. Integrations work natively with Heroku, AWS, Azure, and GCP, and data is stored with 3× redundancy in SOC2- and ISO:27001-certified data centres.
Introduction
Imagine your website as a complex machine with many moving parts. StatsD and Pingdom are like the wrenches and screwdrivers in your toolkit, helping ensure everything runs smoothly.
StatsD is a handy tool created by Etsy that collects and summarizes website data. It acts like a filter, sifting through the massive amounts of information your website generates and focusing on the key metrics that matter. This makes it easier to analyze how different parts of your website perform and identify areas for improvement.
Think of Pingdom as your website's watchdog. It constantly checks to see if your website is up and running and how quickly it responds to visitors. It also monitors performance, letting you know if things are slowing down.
But monitoring can be a double-edged sword. Sometimes, you can get overwhelmed by a flood of alerts, making it hard to identify the significant issues. StatsD and Pingdom help you avoid this by letting you customize what you monitor and how you receive alerts. You can set up thresholds so you only get notified when something critical happens.
Here are some of the common challenges StatsD and Pingdom can help you overcome:
- Data overload: No more drowning in data! StatsD helps you focus on the metrics that matter most, while Pingdom provides clear visualizations to make sense of it all.
- Alert fatigue: Stop missing important alerts because of constant notifications. Set up custom alerts with StatsD and Pingdom to get notified only when things go seriously wrong.
- Keeping up with growth: As your website grows, so does the data you need to monitor. StatsD and Pingdom are built to scale to handle the increased load without sweat.
- Identifying root causes: Downtime can be costly. StatsD and Pingdom's real-time monitoring helps you pinpoint problems quickly and get your website back up and running faster.
- Limited visibility: Want to see how specific parts of your website are performing? StatsD and Pingdom let you track custom metrics, giving you a deeper understanding of your website's health.
To learn more about StatsD and the Pingdom plugin, you can book a demo session with MetricFire and test the platform for a free trial.
Challenges with Monitoring
Monitoring has its fair share of challenges. These challenges arise from different system management, data processing, and resource allocation issues. Therefore, there is a need to cater to these challenges. This is where StatsD and Pingdom plugins come in. Some of the common challenges faced due to monitoring are:
-
Data complexity:
In today’s age, modern systems generate vast amounts of data, which is difficult to process and analyze effectively. StatsD simplifies this process by allowing the collection of specific metrics that can be used for targeted analysis and key performance indicators. This helps filter out unwanted data and prioritizes the most relevant data points. The data is then aggregated and summarized to derive meaningful insights from it. Pingdom helps StatsD by providing customizable reporting and analytics tools. This centralizes diverse data points and provides clear visualizations of data. For organizations managing complex data environments, Integrate.io offers a low-code data integration platform that can complement your monitoring strategy by connecting data across databases, APIs, and data warehouses to power analytics and operational workflows.
-
Alerts mismanagement:
Monitoring systems generate numerous alerts, which can lead to fatigue, in which essential alerts might be missed due to an influx of alerts. Both StatsD and Pingdom provide customizable alerting options, allowing users to set thresholds and alert parameters. This ensures only critical alerts are sent, reducing the risk of overlooking essential alerts and causing alert fatigue. Pingdom allows users to customize alerting rules based on specific monitoring requirements. You can configure notification channels and set escalation policies to ensure only critical alerts make it through. Pingdom also ensures intelligent prioritization of alerts where high-priority alerts get special attention.
-
Scalability:
As organizations grow, their systems also grow in scale. Therefore, ensuring comprehensive monitoring of components becomes increasingly hard. StatsD and Pingdom are designed to scale according to the systems they monitor. They can handle large volumes of data efficiently, ensuring the system’s growth does not hinder the monitoring process. This is due to StatsD’s efficient data processing capabilities, seamless integration of vast programming languages, and customizable metric collection.
-
Downtime:
Identifying the root cause of downtime can be time-consuming, leading to extended service disruption periods. StatsD and Pingdom provide real-time monitoring and analysis capabilities, which allow for immediate detection of downtime and performance issues. This ensures prompt resolution and minimizes service disruptions, enhancing the system's reliability and service.
-
Data Visibility:
StatsD and Pingdom allow for the tracking of customized metrics, which provide insights and visibility into the system or program's specifics. This allows users to focus on metrics relevant to their use cases, making tracking and managing performance based on the system’s requirements easier.
-
Integration and Compatibility:
StatsD and Pingdom are designed to integrate various systems, platforms, and programming languages seamlessly. They can be easily integrated into existing monitoring workflows and tools, ensuring compatibility with different software environments and minimizing the need for extensive modifications or adaptations.
Advantages of StatsD and Pingdom
StatsD and Pingdom offer multiple advantages to users when monitoring a wide range of use cases. They offer network support, performance enhancements, and wider security measures.
-
Network performance:
StatsD and Pingdom can monitor network performance by assessing latency, throughput, and packet loss metrics. This helps users identify bottlenecks or infrastructure issues in the network, leading to optimized network performance.
-
Application Performance Monitoring (APM):
StatsD and Pingdom allow users to track key metrics related to application responsiveness, resource utilization, and user experience. This helps determine how an application is performing.
-
Security:
StatsD and Pingdom allow the user to monitor security breaches, anomalies, and suspicious activities. By monitoring security breaches and network traffic events, users can more effectively detect and respond to security threats.
-
Cloud Infrastructure:
StatsD and Pingdom can monitor cloud-based resources and services with the increasing use of cloud infrastructures. Users can track cloud performance and infrastructure and make better resource allocation and scaling decisions.
-
Logging and tracking:
Both StatsD and Pingdom allow logging and error tracking. This helps users to log errors generated by applications.
Book a demo session with us to get a hands-on experience with StatsD.
Setting up StatsD and Pingdom
Setting up StatsD and Pingdom requires additional prerequisites and configurations, as shown below. Follow the requirements and instructions, and you will be good to go.
Install StatsD
-
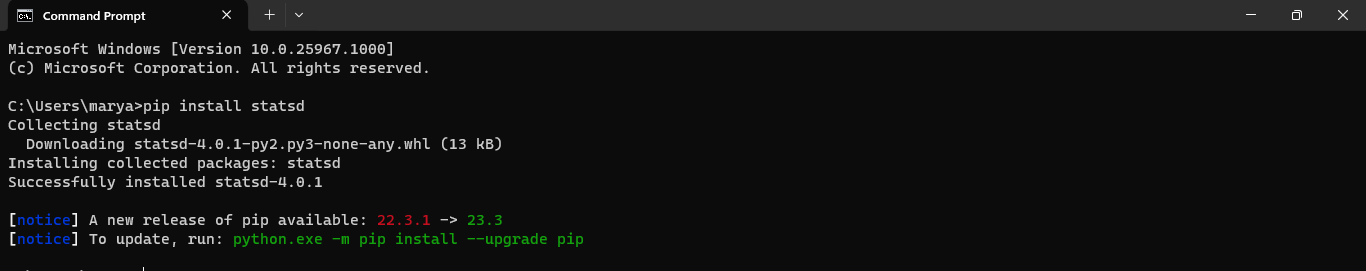
Ensure that you have installed StatsD on your system. If you have not, follow the steps below to do so. You can also follow this article to learn more about the setup and sending metrics to MetricFire.
|
sudo pip install statsd |
After successfully installing StatsD using a package manager, you will get the following output.
Create Pingdom account
-
Ensure you have created a Pingdom account and chosen a monitoring plan. You can also opt for a free 30-day trial.
Create a MetricFire account.
-
Start by creating an account on MetricFire. This will help you easily integrate StatsD and Pingdom. Click “Send Metric” to send metrics to your desired monitoring site.

-
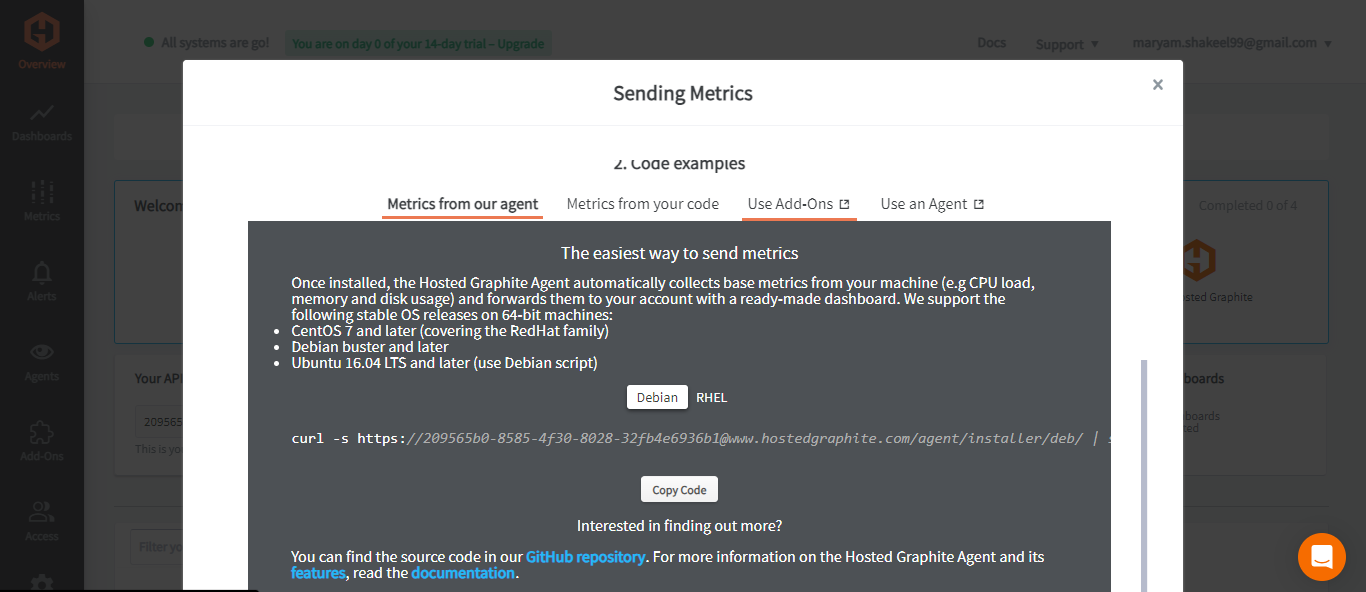
You will then be taken to the screen shown below. Click on “Use Add-ons”.
-
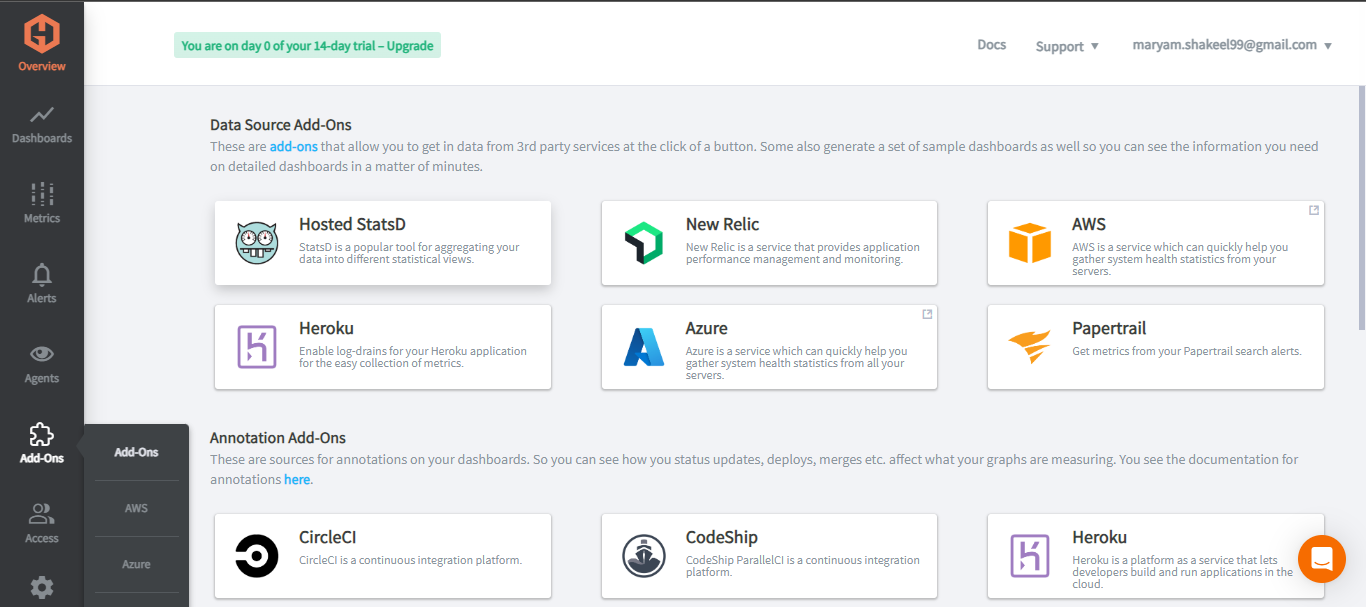
Select the “Hosted StatsD” option.
-
Click “Enable StatsD,” and you will receive your configuration details. Save the URL we gave you to send metrics to MetricFire.

Send metrics to MetricFire.
-
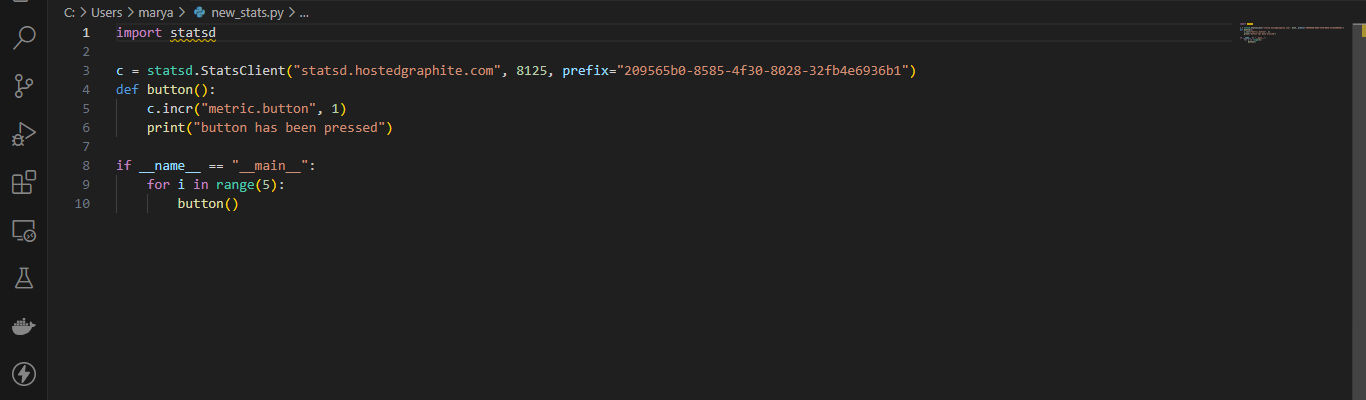
Start by writing this code in a Python file using any compiler of your choice and execute your file.
-
Run your code, and you will receive the metric on MetricFire in the “Metrics” section. You can visualize it using Metric Treemap.

Integration with Pingdom
-
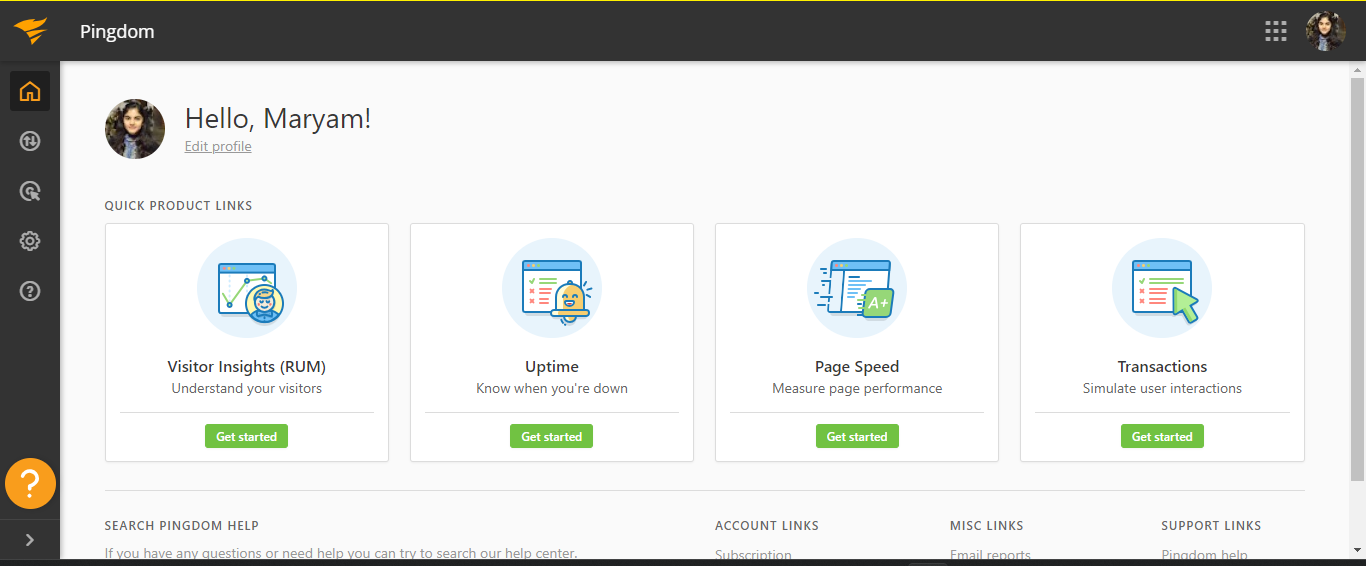
Now go to your Pingdom site and choose any RUM, Uptime, Page Speed, and Transactions option to test your hosted metric.

You can choose any evaluation metric you want to observe and input the URL you received by enabling StatsD on MetricFire.
MetricFire: Your One-Stop Monitoring Shop
While StatsD and Pingdom are powerful tools, they work even better with a comprehensive monitoring platform like MetricFire. MetricFire acts as a central hub, bringing together data from StatsD, Pingdom, and other sources to give you a complete picture of your website's health.
Here's what MetricFire brings to the table:
- All-in-one monitoring: Monitor everything from application performance to cloud resources in one place.
- Customized dashboards: Create clear and concise dashboards showing precisely what you need to see.
- Scalability: MetricFire grows with you, so you can be confident your monitoring needs are always met.
- Real-time alerts: Get notified immediately when something goes wrong.
- Advanced analytics: Dig deeper into your data to identify trends and patterns.
- Seamless integrations: MetricFire works with all your favorite monitoring tools.
- Multi-cloud support: Monitor your website across different cloud platforms.
- Historical data analysis: Learn from the past to make informed decisions about the future.
Conclusion
Don't wait until something breaks to start monitoring your website. Using StatsD, Pingdom, and MetricFire, you can proactively identify and address issues before they impact your visitors. You can make the most out of your monitoring tools by integrating them with other systems like StatsD. They are critical in managing data complexities and enhancing visibility and performance. StatsD simplifies the process of data collection and analysis of metrics, while Pingdom helps with providing comprehensive monitoring, alerting, and reporting options. Through seamless integration of these platforms, website owners can handle large volumes of data, mitigate alert fatigue, and scale their systems according to their needs. Book a demo session with MetricFire today and see how easy it is to take control of your website's health!