

Table of Contents
Great systems are not just built. They are monitored.
MetricFire runs Graphite and Grafana as a fully managed service for growing engineering teams, taking care of storage, scaling, and version updates so your team doesn't have to. Plans start at $19/month, billed per metric namespace rather than per host, and include engineer-staffed support. Integrations work natively with Heroku, AWS, Azure, and GCP, and data is stored with 3× redundancy in SOC2- and ISO:27001-certified data centres.
Introduction
Monitoring your IoT devices provides insights into usage patterns, environmental conditions, and user behaviors. This information can be leveraged to optimize device performance, improve user experiences, and develop better-targeted services or products. By analyzing patterns and trends in device data, it's possible to implement predictive maintenance strategies and schedule repairs or replacements before a device fails, reducing downtime and maintenance costs.
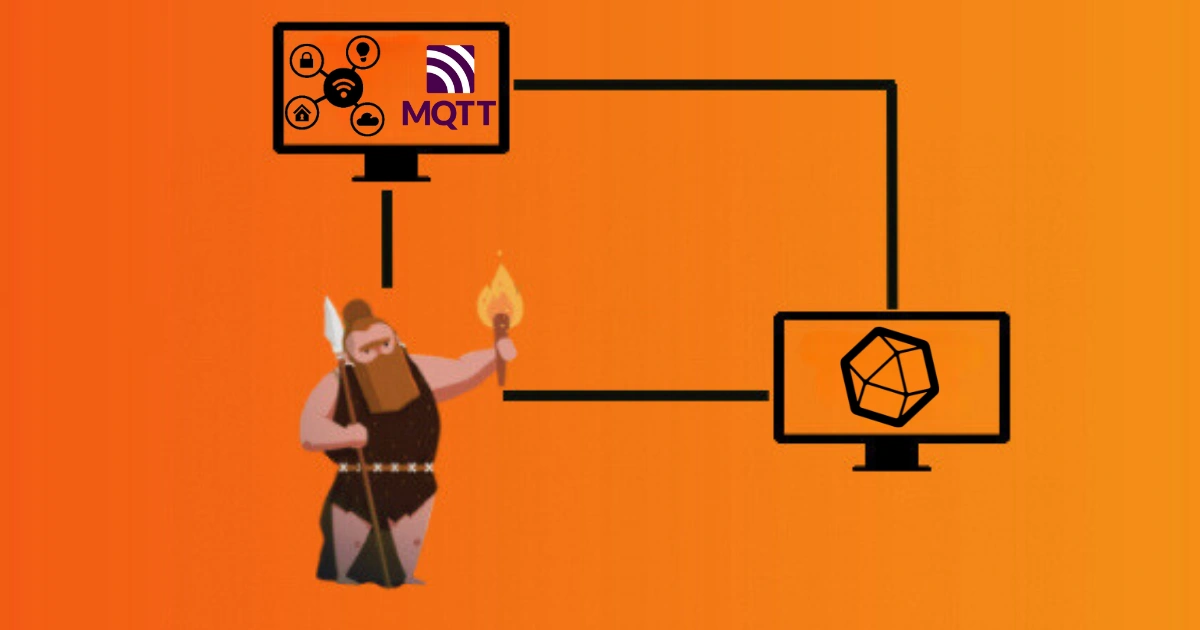
In this article, we'll detail how to publish metrics to an MQTT broker and configure the Telegraf agent to listen for and forward these metrics to a data source.
Run An MQTT Broker
You may already be using your broker, but for our testing purposes, we'll use Mosquitto, an open-source MQTT broker developed by the Eclipse Foundation. It's lightweight, easy to set up, and widely used due to its simplicity and reliability. Once installed and running, you can publish some test metrics to Mosquitto.
Install Mosquitto (macOS)
See the Mosquitto installation docs that pertain to your OS, and for macOS, it's just:
brew install mosquitto

brew services restart mosquitto
Another good broker option is HiveMQ, which can be configured to output to databases, cloud services, other MQTT brokers, and more. It also integrates with MetricFire's Hosted Graphite, making it a good option for production-level IoT device monitoring.
Getting Started with the Telegraf Agent
Telegraf is a plugin-driven server agent built on InfluxDB that collects and sends metrics/events from databases, systems, processes, devices, and applications. Telegraf is written in Go and compiles into a single binary with no external dependencies. It requires a very minimal memory footprint. It is compatible with many operating systems and has many helpful output plugins and input plugins for collecting and forwarding a wide variety of system performance metrics.
Install Telegraf (macOS)
brew install telegraf
For up-to-date versions and installation commands for other operating systems (Ubuntu/Debian, RedHat/CentOS, Windows, Linux binaries), see the Telegraf docs.
For MacOS, packages and files are generally installed in the /usr/local/etc/ directory.
Configure an Output
You can configure Telegraf to output to various sources, such as Graphite, Kafka, InfluxDB, Prometheus, SQL, NoSQL, and more.
In this example, we will configure Telegraf with a Graphite output. If you're not currently hosting your own data source, you can start a free trial with Hosted Graphite by MetricFire to follow these next steps.
A Hosted Graphite account will provide the data source, offer alerting features, and include Hosted Grafana as a visualization tool.
To configure the Graphite output, locate the downloaded telegraf configuration file at ~/usr/local/etc/telegraf/telegraf.conf and open it in your preferred text editor. Then, you will need to make the following changes to the file:
Locate and comment out the line:
# [[outputs.influxdb]]
Then, uncomment the line:
[[outputs.graphite]]
Next, uncomment and edit the server line to:
servers = ["carbon.hostedgraphite.com:2003"]
Finally, uncomment and edit the prefix line to:
prefix = "<YOUR_API_KEY>.telegraf"
Configure Telegraf's MQTT Consumer Plugin:
Telegraf has many input plugins that can collect a wide range of data from many popular technologies and 3rd party sources. In this example, we'll demonstrate how to configure Telegraf to listen to topics being published in Mosquitto.
All you need to do is search for the inputs.mqtt_consumer section in your telegraf.conf file, uncomment the [[inputs.mqtt_consumer]] line, and uncomment the servers line (default is localhost at port 1883):
[[inputs.mqtt_consumer]]
  servers = ["tcp://127.0.0.1:1883"]
Then, define which topics to listen for from the MQTT broker and explain the data_format as Graphite:
topics = [
      "topic/state",
      "topic/sensor",
      "topic/uptime",
      "unique-device-metric"
  ]

  data_format = "graphite"
You can save the file and run telegraf to listen for Mosquitto (or another MQTT broker). The following command runs Telegraf like a server and will show you if there are any configuration errors in the output:
telegraf --config telegraf.confNow you can open another terminal window and publish some metrics to Mosquitto (these metrics are in the Graphite format of metric.name <numeric-value>):
mosquitto_pub -t topic/sensor -m "mosquitto.sensor 2.2"

mosquitto_pub -t topic/state -m "mosquitto.state 4.4"

mosquitto_pub -t topic/uptime -m "mosquitto.uptime 6.6"

mosquitto_pub -t unique-device-metric -m "mosquitto.unique 8.8"
Telegraf will listen for and forward the above four metrics to your data source. This is what they will look like in the Graphite format:
telegraf.<host-name>.topic-sensor.mosquitto.sensor
telegraf.<host-name>.topic-state.mosquitto.state
telegraf.<host-name>.topic-uptime.mosquitto.uptime
telegraf.<host-name>.unique-device-metric.mosquitto.unique
See the official GitHub repository for additional configuration options for the mqtt_consumer plugin.
Use Hosted Graphite by MetricFire to Create Custom Dashboards and Alerts
MetricFire is a monitoring platform that enables you to gather, visualize, and analyze metrics and data from servers, databases, networks, devices, and applications. Using MetricFire, you can effortlessly identify problems and optimize resources within your infrastructure. Hosted Graphite by MetricFire removes the burden of self-hosting your monitoring solution, allowing you more time and freedom to work on your most important tasks.
Once you have signed up for a Hosted Graphite account and used the above steps to configure your server with the Telegraf Agent, metrics will be forwarded, timestamped, and aggregated into the Hosted Graphite backend.
- Metrics will be sent and stored in the Graphite format of: metric.name.path <numeric-value> <unix-timestamp>
- The dot notation format provides a tree-like data structure and makes it efficient to query
- Metrics are stored in your Hosted Graphite account for two years, and you can use them to create custom Alerts and Grafana dashboards.
Build Dashboards in Hosted Graphite's Hosted Grafana
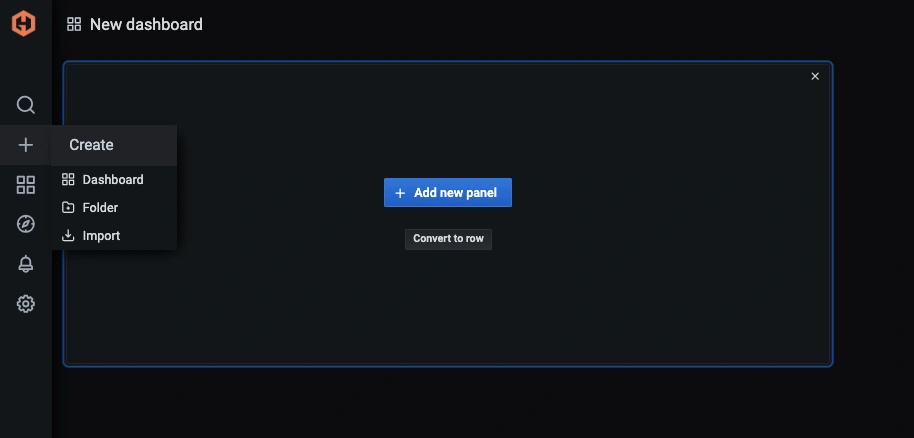
In the Hosted Graphite UI, navigate to Dashboards => Primary Dashboards and select the + button to create a new panel:
Then, you can use the query UI to select a graphite metric path (the default data source will be the hosted graphite backend if you are accessing Grafana through your Hosted Graphite account).
The Hosted Graphite datasource also supports wildcard (*) searching to grab all metrics that match a specified path. Additionally, you can apply Graphite functions to the metric queries, as well as some styling from within the Grafana UI:
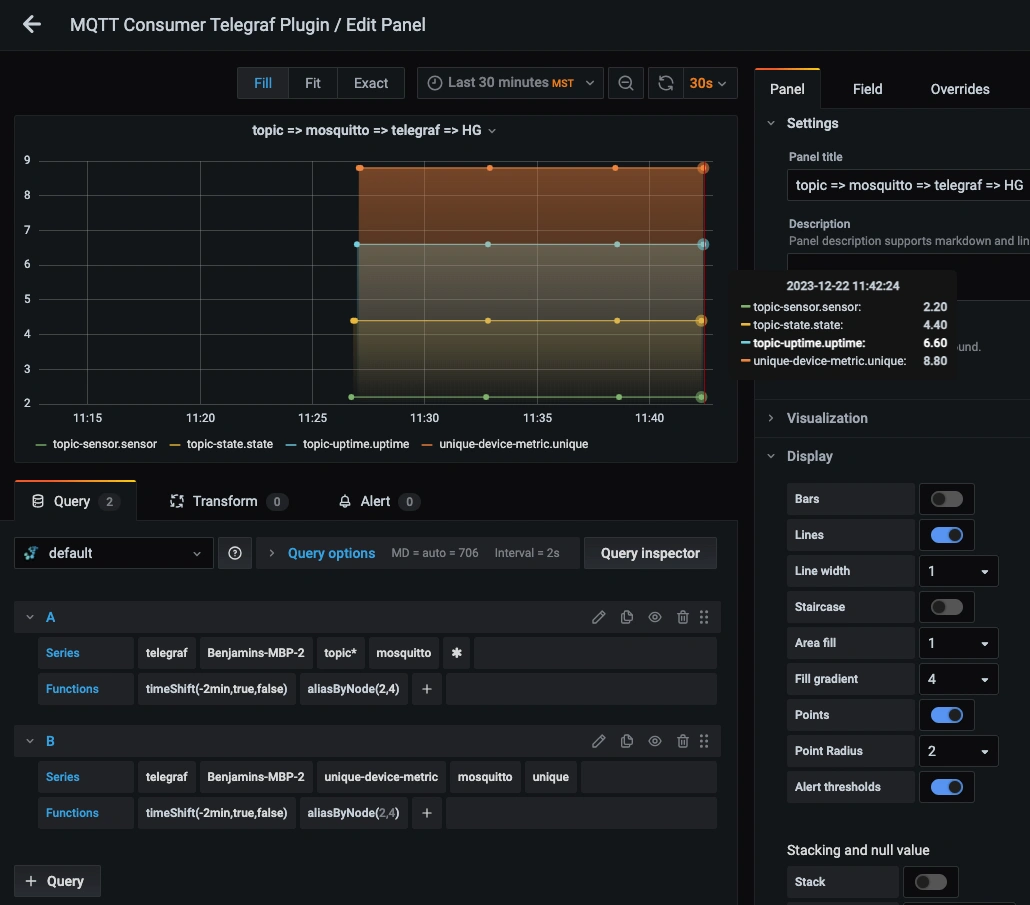
Grafana has many additional options to apply different visualizations, modify the display, set units of measurement, and some more advanced features like configuring dashboard variables and event annotations.
See the Hosted Graphite dashboard docs for more details.
Creating Graphite Alerts
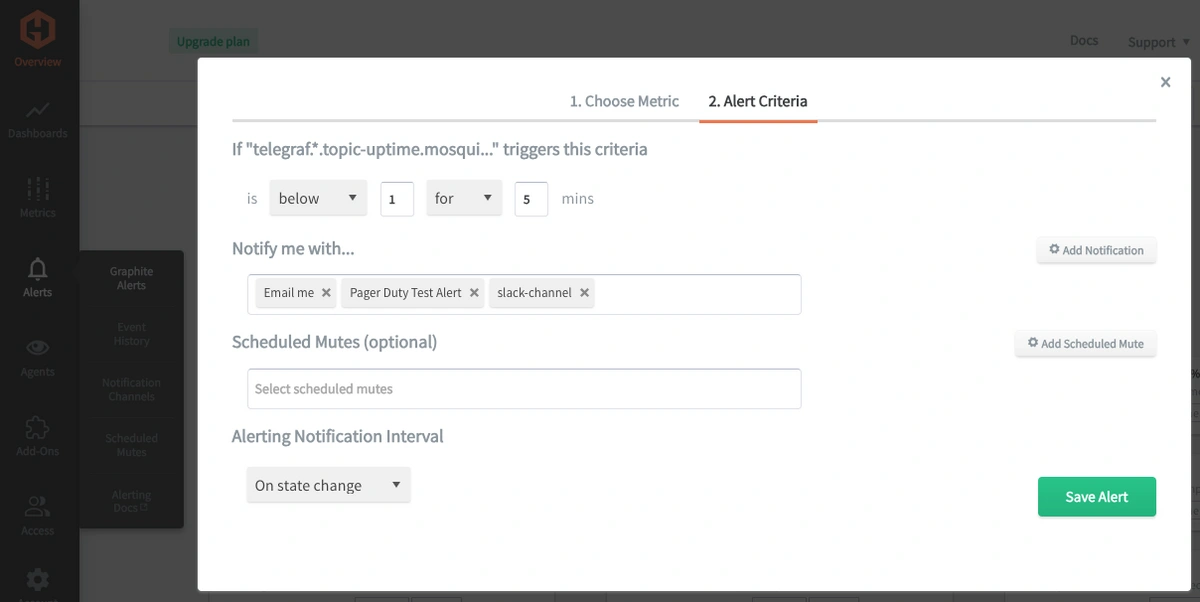
In the Hosted Graphite UI, navigate to Alerts => Graphite Alerts to create a new alert. Name the alert, add a query to the alerting metric field, and add a description of what this alert is:
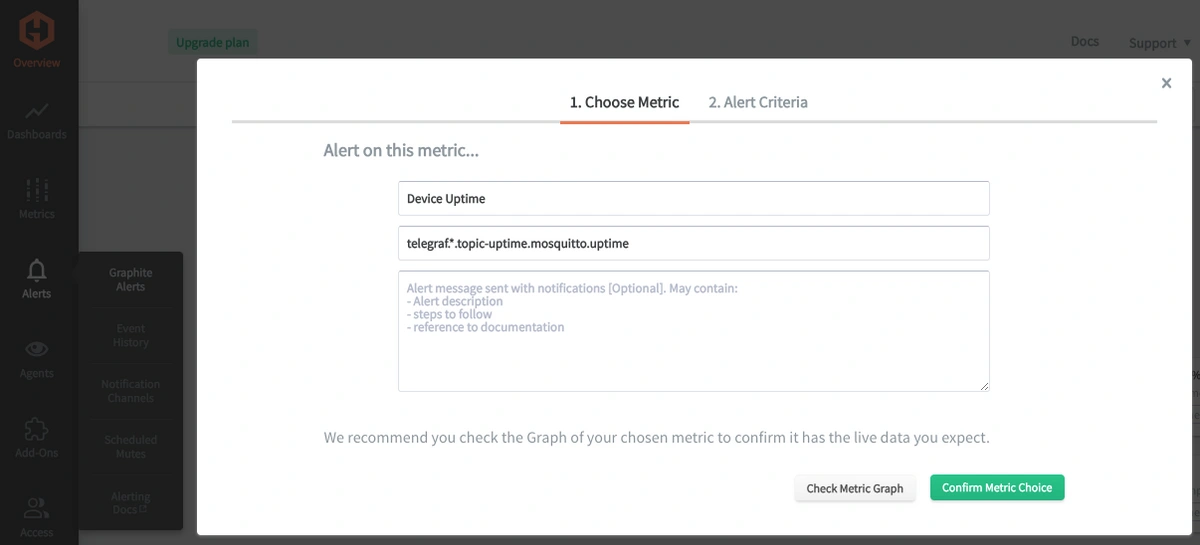
Then, select the Alert Criteria tab to set a threshold and select a notification channel. The default notification channel is the email you used to sign up for the Hosted Graphite account. Still, you can easily configure channels for Slack, PagerDuty, Microsoft Teams, OpsGenie, custom webhooks and more. See the Hosted Graphite docs for more details on notification channels:
Conclusion
Monitoring IoT devices not only ensures their optimal performance and security but also enables businesses to make informed decisions, improve operational efficiency, and enhance their IoT ecosystem's overall reliability and longevity.
Monitoring different layers of your infrastructure provides valuable data, and using tools like dashboards and alerts will complement this data by providing real-time visualization, proactive identification of issues, historical trend analysis, and facilitating informed decision-making. All of these are essential for maintaining a robust and efficient infrastructure.
Sign up for a free trial and experiment with monitoring your IoT devices today! You can also book a demo and talk to the MetricFire team directly about your monitoring needs.


