


Table of Contents
Great systems are not just built. They are monitored.
MetricFire runs Graphite and Grafana as a fully managed service for growing engineering teams, taking care of storage, scaling, and version updates so your team doesn't have to. Plans start at $19/month, billed per metric namespace rather than per host, and include engineer-staffed support. Integrations work natively with Heroku, AWS, Azure, and GCP, and data is stored with 3× redundancy in SOC2- and ISO:27001-certified data centres.
In this article, you’ll learn the basics of MongoDB. We’ll cover its performance metrics, built-in monitoring commands, utilities and tools, and common monitoring strategies. You will also be introduced to a monitoring tool called MetricFire and provided with some examples of how it can be used in production systems together with setup instructions.
To get started, schedule a demo and sign up for the MetricFire free trial here.
Introduction
The official website defines MongoDB as a general-purpose, document-based, distributed database built for modern application developers and the cloud era. For readers who are familiar with the traditional concept of a database, that definition might sound uncanny. That is because MongoDB is a NoSQL database. The main differences between the relational (referred to as “SQL”) and non-relational (referred to as “non-SQL,” or “NoSQL”) are explained in the next section.
SQL vs. NoSQL
SQL vs NoSQL is a topic that can be debated over and over again, which means that if we tried to list all of the differences in one article, we would definitely lose your interest. To keep things as short and sweet as possible, we’ve highlighted the main differences between the two types of databases.
Here are the major differences between SQL and non-SQL:
- Data Storage Model: an SQL database consists of tables with predefined rows and columns. A NoSQL consists of JSON documents with a dynamic column structure.
- Language: as the name suggests, SQL is the only available language when it comes to relational databases. There is no “universal” language in NoSQL.
- Primary Purpose: SQL is used in many applications, hence it is a general-purpose solution. NoSQL is mainly used when it comes to a large amount of data, as its queries do not require "joins," which makes NoSQL queries significantly faster. NoSQL is also often used in web applications.
A few well-known examples of SQL databases include Oracle, MySQL, and Microsoft SQL Server, while PostgreSQL, MongoDB, CouchDB, and Apache Cassandra are amongst the most commonly used NoSQL databases.
One of our favourite articles that explains the differences between SQL and NoSQL can be found here.
What Is MongoDB?
As previously mentioned, MongoDB is a document-based database, which means that it stores data in JSON-like documents. It allows for arrays and nested data structures as values and supports flexible and dynamic data schemas.
MongoDB is a distributed database with built-in horizontal scaling and high availability. It is also free to use. Mongod is the primary daemon process for the MongoDB system. It handles data requests, manages data access, and performs background management operations. If you need to integrate MongoDB with other data sources in your infrastructure, DreamFactory provides governed API access to any database or data source, making it easy to connect your MongoDB instance with enterprise applications.
Why Monitor MongoDB?
As with any cloud-based technology (rather, with any technology at all), monitoring its performance is one of the keys to building a successful product. Unsurprisingly, MongoDB is no exception here. Degraded performance may cause downtimes in your application and poor user experience.
It is crucial to be able to assess the state of your database processes at any given time to allow for smooth and crisis-free deployment. Moreover, a firm monitoring process makes it possible to anticipate and diagnose problems before they escalate to failures. The following sections will cover various aspects of MongoDB monitoring including tools and technologies that can be used to get the monitoring done.
MetricFire is a really useful tool that provides a complete infrastructure and real-time application monitoring platform. It specializes in monitoring systems. If you would like to learn more about it, please book a demo or sign up for the free trial today.
Monitoring MongoDB
Key MongoDB Performance Metrics to Monitor
Some of the key metrics you will want to monitor while using MongoDB include, but are not limited, to:
Replication lag
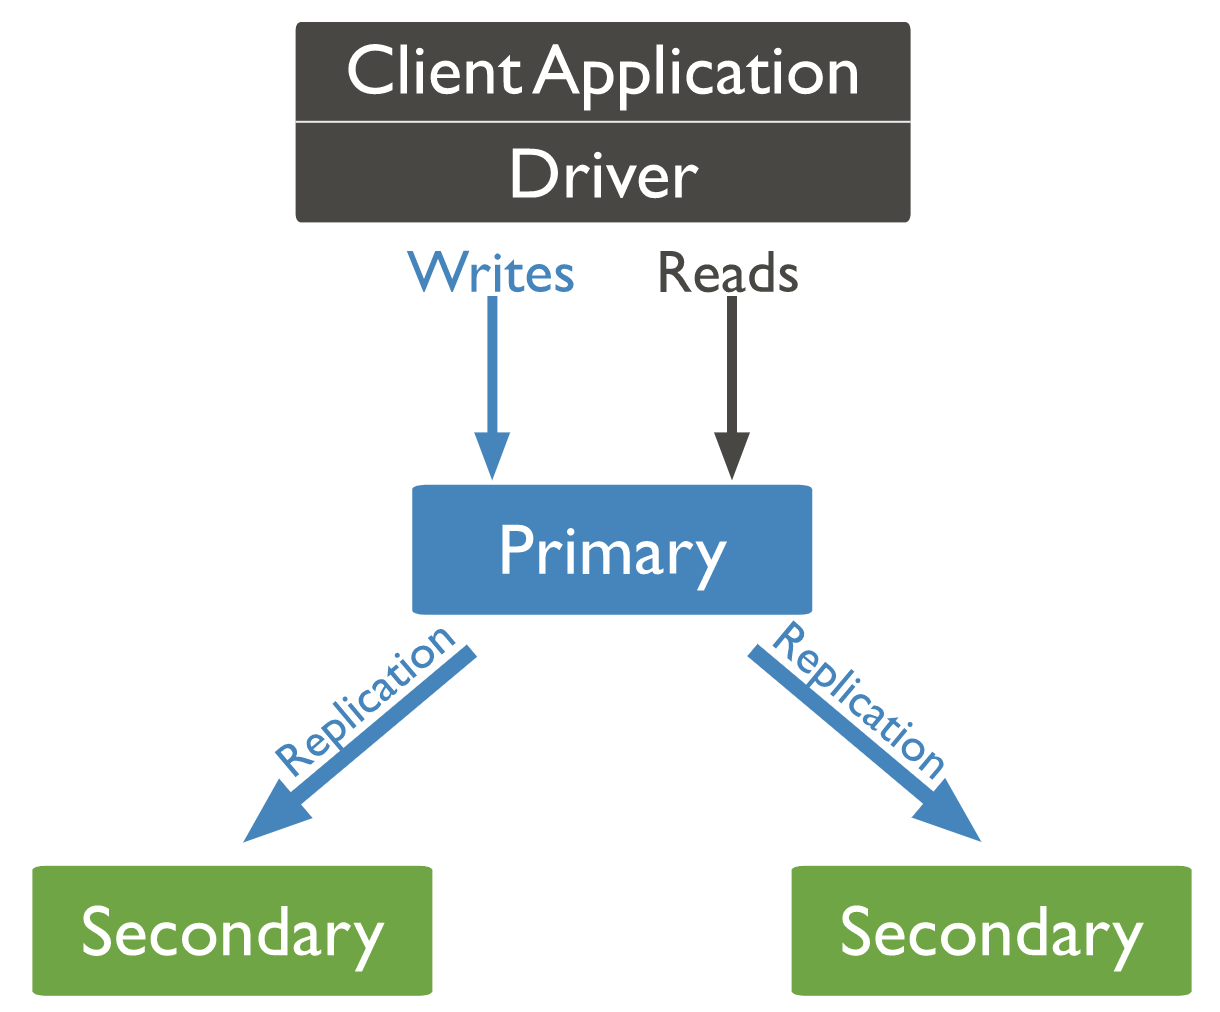
A replica set is a set of nodes with an elected primary node and several secondary nodes.
Replication in MongoDB refers to the propagation of data from a primary node to a secondary node. Replication lag, in its turn, defines how much time it takes to copy data between the two nodes. Data replication should happen as quickly as possible and under normal circumstances, this lag is estimated to be 0. In practice, one can set a reasonable threshold of something around a minute, and if the threshold is exceeded an alert is triggered. Possible causes for replication lag include:
- Poor network connection
- Resource saturation
- The primary node itself being slow
Replica State
In a replicated set, the primary node keeps the most up-to-date data. Via replication, that data is being replicated to the secondary nodes as changes are made to the primary. However, the assigned node status may change. This process is called flapping. In a stable system, it should only happen due to known reasons, such as maintenance. Therefore, if you see any flapping, it is important to understand why it happened, as it could have been due to a hardware or a network issue.
Locking State
In a database, locking occurs when a transaction prevents a database entity from being modified or read until the current transaction is finished. In MongoDB, locking is executed at the document level to avoid conflict between concurrent transactions. When it comes to a specific metric, locking percentage is the one that is being monitored most commonly. A high locking percentage can degrade the overall database performance which can cause flapping.
Disk Utilization
It is one of the most obvious, but it's still one of the most important database metrics. If a database utilizes all disk space on the host, the server comes to an abrupt halt. For this metric, it is crucial to proactively monitor data and log file sizes to prevent potential failures.
Database Connections
The number of open connections is another important MongoDB performance metric, and it can greatly impact the overall performance of the database. If too many connections are left open after the corresponding transactions have been finished, new transaction requests might get stuck waiting for a new open connection.
Scaling MongoDB: Replication vs. Sharding
In MongoDB, both replication and sharding are techniques of horizontal scaling used to create a high availability setup. The concepts are not self-exclusive and can be used either individually or together, depending on the use-case.
Sharding is a MongoDB method of distributing data across multiple servers. It provides faster throughput on “read” and “write” queries, especially for very large datasets.
Replication is used in MongoDB to provide stability and disaster recovery. This process transfers and synchronizes the replicated dataset across multiple machines. It allows avoiding downtimes if one machine goes offline.
Monitoring Strategies
MongoDB offers several methods for collecting performance data on the state of a running instance. The full list of monitoring strategies can be found on the official website. Please note that all these methods can be used to answer various questions in different contexts. Hence, they are rather complementary and can be combined to achieve better results in monitoring the performance of the running instance.
Built-in Monitoring Tools
MongoDB provides free cloud monitoring for standalone or replica sets. It includes information about operation memory, CPU usage, execution times, and operation counts. Additionally, MongoDB distribution offers some commands and utilities that allow you to monitor instance performance and activity. Some of these commands and utilities are covered in the next section.
Collecting MongoDB Metrics and Statistics
Utilities
Typically, utilities are used to diagnose issues and assess the current state of an instance.
Mongostat is a utility that calculates and returns the counts of database operations by type.
Mongotop is a utility that tracks and reports the current activity of a MongoDB instance on a per collection basis.
Commands
Commands should be used when a finer level of granularity is required than the one provided by the utilities above.
The serverStatus command returns an overview of the database’s current status. It provides information about disk and memory usage, connection and index access.
The dbStats command outputs a document that outlines the storage use and data volumes. This data can be used to monitor the state and storage capacity of a database.
The replSetGetStatus returns an overview of your replica set’s status. The data returned after running this command can be used to make sure that replication is configured properly and to check the connections within the replica set.
Production Monitoring
While being lightweight and still able to provide a solid overview of the instance’s performance and activity, the utilities and commands discussed above are not suitable for monitoring a database running in production. One should rather go for a more advanced monitoring solution that will ingest MongoDB performance metrics (and performance metrics from other, third-party tools) and aggregate them all in one place.
For those wanting to stick to MongoDB products, there is MongoDB Cloud Manager (with MongoDB Ops Manager as its on-premise alternative). MongoDB Cloud Manager is a cloud-based set of tools that provide monitoring, backup, and process automation functionality.
For those who are looking to monitor MongoDB, as well as the other major components of their system, the next section of this article is dedicated to MetricFire and why should you choose it as a hosted open-source monitoring system for your MongoDB instance.
How to Monitor MongoDB Performance with MetricFire
MetricFire Overview
MetricFire provides a complete infrastructure and application monitoring platform from a suite of open source monitoring tools. Depending on the setup, one can choose between Hosted Prometheus or Graphite and view all required metrics on beautiful Grafana dashboards in real-time. Both these open-source tools can benefit your organization, but there are some key differences to know:
- Prometheus and Graphite can both store numeric time-series data. If you're looking for scraping and alerting using extended libraries, though, Graphite is a better option.
- Prometheus supports more languages than Graphite, but the latter allows push metrics from any programming language.
- Hosted Graphite, rather than Hosted Prometheus, is generally more trusted due to its longevity and stability.
- Both these options provide long-term storage.
MetricFire offers a wide range of support tools, add-ons, and plugins that make it possible to measure, analyze, and visualize large amounts of data about your applications with ease. We also offer all these benefits regardless of whether you're using hosted Prometheus or hosted Graphite.
These are both powerful tools, and if you need help choosing the right monitoring software, we're more than happy to discuss your specific needs. That is what makes it so compelling when compared to similar tools used for MongoDB monitoring. It is also one of the top open-source MongoDB monitoring dashboards available on the market.
How to Connect MongoDB and MetricFire
To start off using MetricFire, get on to the free trial here. Then you need to install the Hosted Graphite Agent. This can be done with a single command:
Debian/Ubuntu: curl -s https://YOUR-API-KEY@www.hostedgraphite.com/agent/installer/deb/ | sudo sh
RHEL: curl -s https://YOUR-API-KEY@www.hostedgraphite.com/agent/installer/rpm/ | sudo sh
In the code snippet above, you will see the place where you should insert your API key. You can get that from your MetricFire account once you log in.
The command above needs to be run on the server you wish to monitor. After that, the agent should be uploaded and installed automatically.
In order to enable monitoring for you MongoDB instance, you need to add the following configuration to /etc/opt/hg-agent/hg-agent.conf:
mongodb:
    enabled: True
    host: localhost
    port: 27017
You can specify any of the keys from Diamond’s MongoDB config here.
Alerting in MetricFire
Alerts allow you to receive a notification when your data does something unexpected, such as go above or below a set threshold or when it suddenly stops. You can get immediate feedback via email, PagerDuty, Slack, or Hipchat when critical changes occur. More on how alerting works in MetricFire can be found here.
Conclusion
This article covers the theory behind monitoring MongoDB and some examples of how it can be done in a production system. One approach is to use free built-in tools and utilities to gain some insight into your performance metrics.
However, in a production environment, it is recommended to use a reputable monitoring tool. MetricFire is one option when it comes to monitoring a MongoDB database in your system.
If you would like to learn more about the product, please book a demo with MetricFire, or sign up for the free trial today.


