

Table of Contents
- Introduction
- Key Takeaways
- Various Monitoring Categories
- Infrastructure Monitoring
- System Metrics
- Kubernetes Metrics
- Kubernetes Container CPU and Memory Usage
- Kubernetes Pod CPU and Memory Usage
- Kubernetes Node CPU and Memory Usage
- Kubernetes Namespace CPU and Memory Usage
- Kubernetes Cluster CPU and Memory Usage
- Kubernetes Container CPU and Memory Requests
- Kubernetes Pod CPU and Memory Requests
- Kubernetes Node CPU and Memory Requests
- Kubernetes Namespace CPU and Memory Requests
- Kubernetes Cluster CPU and Memory Requests
- Kubernetes Container CPU and Memory Limits
- Kubernetes Pod CPU and Memory Limits
- Kubernetes Node CPU and Memory Limits
- Kubernetes Namespace CPU and Memory Limits
- Kubernetes Cluster CPU and Memory Limits
- Kubernetes Resource Capacity
- Kubernetes CPU and Memory Request Commitment (Resource Requests vs Capacity)
- Kubernetes CPU and Memory Limit Commitment (Resource Limits vs Capacity)
- Kubernetes Resource Utilization (Resource Usage vs Capacity)
- Kubernetes Resource Saturation
- Kube-State-Metrics Kubernetes Manifest
- Node-Exporter Metrics Kubernetes Manifest
- Application Performance Monitoring
- Setting up Kubernetes Monitoring using MetricFire
- Conclusion
Great systems are not just built. They are monitored.
MetricFire runs Graphite and Grafana as a fully managed service for growing engineering teams, taking care of storage, scaling, and version updates so your team doesn't have to. Plans start at $19/month, billed per metric namespace rather than per host, and include engineer-staffed support. Integrations work natively with Heroku, AWS, Azure, and GCP, and data is stored with 3× redundancy in SOC2- and ISO:27001-certified data centres.
Introduction
Monitoring is the most important aspect of infrastructure operations. Effective monitoring strategies help optimize infrastructure usage, improve planning, and resolve incidents quickly.
While monitoring preceded DevOps, DevOps has further transformed the software development process to the extent that monitoring also has to evolve. The overall pace of software development has increased with DevOps, and teams are now automating integration testing and deploying software in the cloud with quick timelines and continuous delivery.
With DevOps, there’s more to monitor now, from integration and provisioning to deployment. Teams need to use DevOps monitoring strategies to monitor different aspects of the project effectively.
MetricFire specializes in monitoring systems, and you can use our product with minimal configuration to gain in-depth insight into your environment. To learn more, book a demo with us or sign up for a free trial today. Quickly get started with monitoring Kubernetes clusters, check out our tutorial on using the Telegraf agent as a Daemonset to forward node/pod metrics to a data source and use that data to create custom dashboards and alerts.
Today, we will learn some essential monitoring strategies and concepts to help you better understand your infra and applications.
Key Takeaways
- Monitoring is a critical aspect of infrastructure operations, and effective monitoring strategies are essential for optimizing infrastructure usage, improving planning, and resolving incidents.
- DevOps has transformed the software development process, leading to increased automation, cloud deployment, and continuous delivery, necessitating monitoring strategies' evolution.
- Kubernetes metrics play a significant role in monitoring containerized applications, including CPU and memory usage for containers, pods, nodes, namespaces, and clusters, as well as resource requests, limits, capacity, commitment, utilization, and saturation.
- Kubernetes metrics can be easily monitored with tools like Prometheus by deploying necessary components and creating dashboards.
- Application Performance Monitoring (APM) involves collecting and centralizing logs, tracing, and profiling to measure performance aspects like availability, error rates, throughput, user response time, and more.
Various Monitoring Categories
Determining what you should monitor in your applications. Monitoring targets can be divided into several primary categories, and you will likely want to cover at least one aspect of each category.
These categories include:
- Server Health
- Application Log Output
- Vulnerabilities
- Development Milestones
- User Activity
Infrastructure Monitoring
It is a key component of any application monitoring. It includes all the server metrics, and with containers coming into the picture, it should also include all the container-specific metrics. Some important metrics are:
System Metrics
- Availability
- CPU usage
- Disk usage
- Uptime
- Response time
- Databases
- Storage
- Components
- Virtual systems
- Performance
- User permissions
- Security
- Network switches
- Process level usage
- Throughput on the application
- Load of the servers
These metrics are fairly straightforward and have been much discussed already. Let’s explore some Kubernetes Metrics.
Kubernetes Metrics
Kubernetes Container CPU and Memory Usage
Containers are the building blocks of containerized applications. Container CPU usage refers to the number of CPU resources consumed by containers in production. Memory usage is the measure of memory resources consumed. CPU resources are measured in CPU cores while memory is measured in bytes.
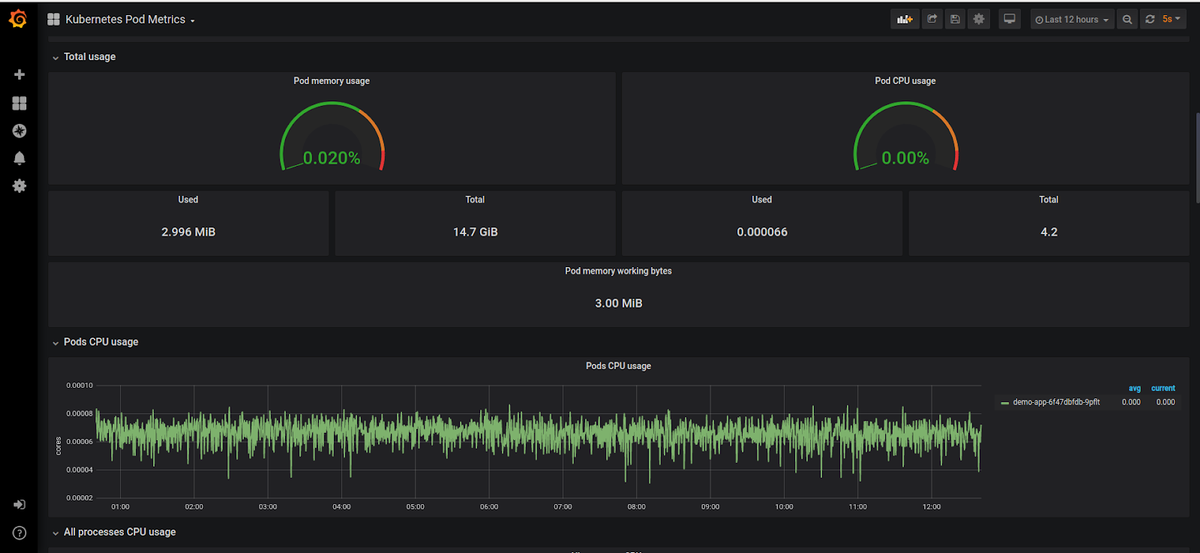
Kubernetes Pod CPU and Memory Usage
Pods are collections of containers, and as such, pod CPU usage is the sum of the CPU usage of all containers that belong to a pod. Similarly, pod memory usage is the total memory usage of all containers belonging to the pod.
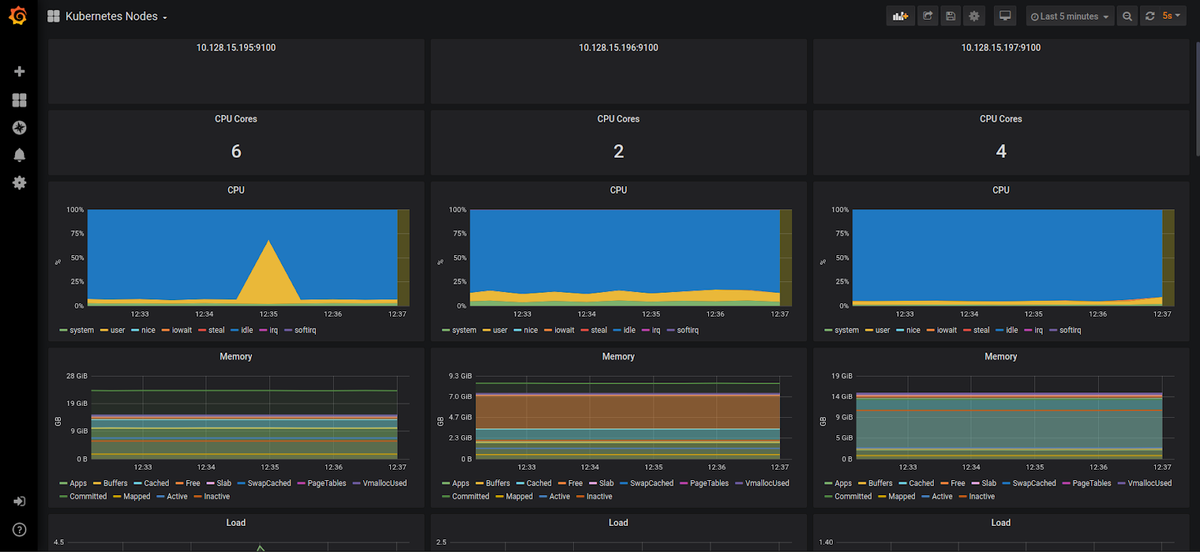
Kubernetes Node CPU and Memory Usage
Node CPU usage is the number of CPU cores used on the node by all pods running on that node. Similarly, node memory usage is the total memory usage of all pods.
Kubernetes Namespace CPU and Memory Usage
You can think of Kubernetes namespaces as boxes. DevOps can create separate boxes to isolate the resources belonging to individual applications or teams. Namespace resource usage is the sum of CPU or memory usage of all pods that belong to that namespace.
Kubernetes Cluster CPU and Memory Usage
The sum of CPU or memory usage of all pods running on nodes belonging to the cluster gives us the CPU or memory usage for the entire cluster.
Kubernetes Container CPU and Memory Requests
Container resource requests are a soft limit on the amount of CPU or memory resources a container can consume in production.
Kubernetes Pod CPU and Memory Requests
The sum of CPU or memory requests of all containers belonging to a pod.
Kubernetes Node CPU and Memory Requests
Node CPU requests are the sum of the CPU requests for all pods running on that node. Similarly, node memory requests are the sum of the memory requests of all pods.
Kubernetes Namespace CPU and Memory Requests
The sum of CPU or memory requests of all pods belonging to a namespace.
Kubernetes Cluster CPU and Memory Requests
The sum of CPU requests or memory requests for all pods running on nodes belonging to a cluster.
Kubernetes Container CPU and Memory Limits
Container CPU limits are a hard limit on the amount of CPU a container can consume in production. Memory limits are the maximum number of bytes a container can consume in production.
Kubernetes Pod CPU and Memory Limits
The sum of CPU or memory limits for all containers belonging to a pod.
Kubernetes Node CPU and Memory Limits
Node CPU limits are the sum of CPU limits for all pods on that specific node. On the other hand, Node memory limits are a sum of the memory limits of all pods.
Kubernetes Namespace CPU and Memory Limits
The sum of CPU or memory limits of all pods belonging to a namespace.
Kubernetes Cluster CPU and Memory Limits
The sum of CPU or memory limits for all pods running on nodes belonging to a cluster.
Kubernetes Resource Capacity
In cloud environments, Kubernetes nodes usually refer to cloud provider instances. Node CPU capacity is the total number of CPU cores on the node, and node memory capacity is the total number of bytes available on the node. For example, an N1-standard-1 instance has 2 vCPUs and 3.75 GB of memory.
Cluster CPU capacity is the sum of the CPU capacities of all Kubernetes nodes in the cluster. Cluster memory capacity is the sum of the memory capacities of all nodes in the cluster. For example, a cluster with 4 N1-standard-1 instances has 8vCPUs and 15 GB of memory.
Kubernetes CPU and Memory Request Commitment (Resource Requests vs Capacity)
CPU request commitment is the ratio of CPU requests for all pods running on a node to the total CPU available. In the same way, memory commitment is the ratio of pod memory requests to the total memory capacity of that node. We can also calculate cluster-level request commitment by comparing CPU/memory requests on a cluster level to total cluster capacity.
Request commitments give us an idea of how much of the node or cluster is committed regarding soft resource usage limits.
Kubernetes CPU and Memory Limit Commitment (Resource Limits vs Capacity)
CPU limit commitment is the ratio of CPU limits for all pods running on a node to the total CPU available. Similarly, memory commitment is the ratio of pod memory limits to the total memory capacity of that node. Cluster-level limit commitments can be calculated by comparing total CPU/memory limits to cluster capacity.
Limit commitments give us an idea of how much of the node or cluster is committed in terms of hard CPU and memory limits.
Kubernetes Resource Utilization (Resource Usage vs Capacity)
With the emphasis on pay-as-you-go billing models for cloud deployments, resource utilization is an important metric to monitor and has significant implications for cost control.
CPU utilization is the ratio of CPU resources consumed by all pods running on a node to the total CPU available. Memory utilization is the ratio of memory usage by all pods to the total memory capacity of that node.
Cluster resource utilization will compare resource usage (both CPU and memory) for all pods with the total resource capacity of all nodes.
Kubernetes Resource Saturation
Node CPU saturation measures CPU requests that cannot be fulfilled due to unavailability. Similarly, memory saturation on the node measures memory requests that cannot be met due to unavailability.
Saturation on the cluster level can be calculated based on saturation numbers across all nodes.
These metrics might seem overwhelming, but it is extremely easy to scrape and monitor them with Prometheus. If you have a Prometheus instance running, all you need to do is:
- Deploy Kube-state metrics for container and pod metrics. (manifest is given below)
- Deploy Node-exporter for system-level metrics. (manifest is given below)
Kube-State-Metrics Kubernetes Manifest
apiVersion: v1
kind: Namespace
metadata:
  name: monitoring
---
apiVersion: rbac.authorization.k8s.io/v1
# kubernetes versions before 1.8.0 should use rbac.authorization.k8s.io/v1beta1
kind: ClusterRoleBinding
metadata:
  name: kube-state-metrics
roleRef:
  apiGroup: rbac.authorization.k8s.io
  kind: ClusterRole
  name: kube-state-metrics
subjects:
- kind: ServiceAccount
  name: kube-state-metrics
  namespace: monitoring
---
apiVersion: rbac.authorization.k8s.io/v1
# kubernetes versions before 1.8.0 should use rbac.authorization.k8s.io/v1beta1
kind: ClusterRole
metadata:
  name: kube-state-metrics
rules:
- apiGroups: [""]
  resources:
  - configmaps
  - secrets
  - nodes
  - pods
  - services
  - resourcequotas
  - replicationcontrollers
  - limitranges
  - persistentvolumeclaims
  - persistentvolumes
  - namespaces
  - endpoints
  verbs: ["list", "watch"]
- apiGroups: ["extensions"]
  resources:
  - daemonsets
  - deployments
  - replicasets
  verbs: ["list", "watch"]
- apiGroups: ["apps"]
  resources:
  - statefulsets
  verbs: ["list", "watch"]
- apiGroups: ["batch"]
  resources:
  - cronjobs
  - jobs
  verbs: ["list", "watch"]
- apiGroups: ["autoscaling"]
  resources:
  - horizontalpodautoscalers
  verbs: ["list", "watch"]
---
apiVersion: rbac.authorization.k8s.io/v1
# kubernetes versions before 1.8.0 should use rbac.authorization.k8s.io/v1beta1
kind: RoleBinding
metadata:
  name: kube-state-metrics
  namespace: monitoring
roleRef:
  apiGroup: rbac.authorization.k8s.io
  kind: Role
  name: kube-state-metrics-resizer
subjects:
- kind: ServiceAccount
  name: kube-state-metrics
  namespace: monitoring
---
apiVersion: rbac.authorization.k8s.io/v1
# kubernetes versions before 1.8.0 should use rbac.authorization.k8s.io/v1beta1
kind: Role
metadata:
  namespace: monitoring
  name: kube-state-metrics-resizer
rules:
- apiGroups: [""]
  resources:
  - pods
  verbs: ["get"]
- apiGroups: ["extensions"]
  resources:
  - deployments
  resourceNames: ["kube-state-metrics"]
  verbs: ["get", "update"]
---
apiVersion: v1
kind: ServiceAccount
metadata:
  name: kube-state-metrics
  namespace: monitoring
---
apiVersion: apps/v1
kind: Deployment
metadata:
  name: kube-state-metrics
  namespace: monitoring
spec:
  selector:
    matchLabels:
      k8s-app: kube-state-metrics
  replicas: 1
  template:
    metadata:
      labels:
        k8s-app: kube-state-metrics
    spec:
      serviceAccountName: kube-state-metrics
      containers:
      - name: kube-state-metrics
        image: quay.io/mxinden/kube-state-metrics:v1.4.0-gzip.3
        ports:
        - name: http-metrics
          containerPort: 8080
        - name: telemetry
          containerPort: 8081
        readinessProbe:
          httpGet:
            path: /healthz
            port: 8080
          initialDelaySeconds: 5
          timeoutSeconds: 5
      - name: addon-resizer
        image: k8s.gcr.io/addon-resizer:1.8.3
        resources:
          limits:
            cpu: 150m
            memory: 50Mi
          requests:
            cpu: 150m
            memory: 50Mi
        env:
          - name: MY_POD_NAME
            valueFrom:
              fieldRef:
                fieldPath: metadata.name
          - name: MY_POD_NAMESPACE
            valueFrom:
              fieldRef:
                fieldPath: metadata.namespace
        command:
          - /pod_nanny
          - --container=kube-state-metrics
          - --cpu=100m
          - --extra-cpu=1m
          - --memory=100Mi
          - --extra-memory=2Mi
          - --threshold=5
          - --deployment=kube-state-metrics
---
apiVersion: v1
kind: Service
metadata:
  name: kube-state-metrics
  namespace: monitoring
  labels:
    k8s-app: kube-state-metrics
  annotations:
    prometheus.io/scrape: 'true'
spec:
  ports:
  - name: http-metrics
    port: 8080
    targetPort: http-metrics
    protocol: TCP
  - name: telemetry
    port: 8081
    targetPort: telemetry
    protocol: TCP
  selector:
    k8s-app: kube-state-metrics
Node-Exporter Metrics Kubernetes Manifest
apiVersion: extensions/v1beta1
kind: DaemonSet
metadata:
  name: node-exporter
  namespace: monitoring
  labels:
    name: node-exporter
spec:
  template:
    metadata:
      labels:
        name: node-exporter
      annotations:
         prometheus.io/scrape: "true"
         prometheus.io/port: "9100"
    spec:
      hostPID: true
      hostIPC: true
      hostNetwork: true
      containers:
        - name: node-exporter
          image: prom/node-exporter:v0.16.0
          securityContext:
            privileged: true
          args:
            - --path.procfs=/host/proc
            - --path.sysfs=/host/sys
          ports:
            - containerPort: 9100
              protocol: TCP
          resources:
            limits:
              cpu: 100m
              memory: 100Mi
            requests:
              cpu: 10m
              memory: 100Mi
          volumeMounts:
            - name: dev
              mountPath: /host/dev
            - name: proc
              mountPath: /host/proc
            - name: sys
              mountPath: /host/sys
            - name: rootfs
              mountPath: /rootfs
      volumes:
        - name: proc
          hostPath:
            path: /proc
        - name: dev
          hostPath:
            path: /dev
        - name: sys
          hostPath:
            path: /sys
        - name: rootfs
          hostPath:
            path: /
Once you have deployed these, you can chart your metrics and create dashboards.
Application Performance Monitoring
Application performance monitoring involves searching, collecting, and centralizing logs, with tracing and profiling available on the application. Integrate.io can help teams build data pipelines that consolidate application performance data across systems, enabling a comprehensive view of application health and user experience through its ETL and ELT capabilities.
It also helps provide measurements on performance such as availability, error rate, throughput, user response time, slow pages, page loads, third-party JavaScript slowness, track SLAs, browser speed, and checks for end-user transactions.
While this list is not exhaustive by any means, it should give you an idea of what your existing monitoring tools offer and what loopholes exist in your DevOps monitoring strategy.
Setting up Kubernetes Monitoring using MetricFire
A production-level Kubernetes infrastructure can require a few hundred nodes and upwards of a few Mbps of network traffic. Therefore, you would need to scale out both Graphite and Grafana to handle the increasing load.
That’s where Hosted Graphite and Hosted Grafana come into the picture. It allows you to scale for long-term storage and provides redundant data storage without you having to go through the arduous process of setting up Graphite and Grafana.
Hosted Graphite and Hosted Grafana through MetricFire allow for the continuous active deployment of new features, as MetricFire’s products all have their foundations in the ever-growing open-source projects. Configuring the Telegraf agent as a Daemonset to forward node/pod metrics is simple. Check out our article about how to quickly get started with monitoring Kubernetes clusters; check out our tutorial on using the Telegraf agent as a Daemonset to forward node/pod metrics to a data source and use that data to create custom dashboards and alerts.
Sign up for the MetricFire free trial here, and start building Kubernetes dashboards within a few minutes.
Conclusion
This blog should provide insight into what metrics to monitor in your ecosystem. You can also expose custom metrics, and Metricfire can help you scrape them and plot-relevant dashboards. All in a few clicks :)
If you need help setting up these metrics, feel free to contact me through LinkedIn. Additionally, MetricFire can help you monitor your applications across various environments. Monitoring is essential for any application stack, and you can get started using MetricFire’s free trial.
Robust monitoring will help you meet your application's SLAs and ensure the operations and development teams' sound sleep. If you want to learn more, please book a demo with us.

