

Table of Contents
Great systems are not just built. They are monitored.
MetricFire runs Graphite and Grafana as a fully managed service for growing engineering teams, taking care of storage, scaling, and version updates so your team doesn't have to. Plans start at $19/month, billed per metric namespace rather than per host, and include engineer-staffed support. Integrations work natively with Heroku, AWS, Azure, and GCP, and data is stored with 3× redundancy in SOC2- and ISO:27001-certified data centres.
Introduction
How can you judge Grafana vs. Chronograf and InfluxDB? Monitoring various systems is a crucial component of continuous maintenance. You can look at different parameters of the monitored system and take corresponding actions for certain conditions. For example, engineers can prevent server failure when they see the load on the server approaching its critical point. If the number of processed transactions (or registered users) exceeds the expected level, you can celebrate your success.
In this Grafana vs. Chronograf and InfluxDB article, we will look at two tools used for monitoring system performance - Grafana and InfluxDB. Grafana is a popular monitoring platform. InfluxDB is a time-series database, which has a tool called Chronograf in its stack. The Сhronograph is for visualization and monitoring of data stored in InfluxDB.
To try out Grafana, head to MetricFire's free trial of Hosted Grafana. Start using Grafana in minutes and see if it's right for you.
Key Takeaways
- Monitoring various systems is essential for continuous maintenance, and tools like Grafana and InfluxDB play a crucial role in this process.
- Grafana is an open-source monitoring platform used by small and large companies to monitor various aspects such as applications, networks, infrastructure, and IoT devices.
- InfluxDB is a time-series database that is part of the TICK-stack, which includes Telegraf, InfluxDB, Chronograf, and Kapacitor.
- Chronograf, on the other hand, is optimized to work with InfluxDB and is a part of the InfluxDB stack, mainly serving time-series data and related tools like Kapacitor.
- The choice between Grafana and InfluxDB with Chronograf depends on your specific monitoring needs and data types, with Grafana offering greater versatility and Chronograf being well-suited for InfluxDB-focused environments.
Grafana Stack Overview
For the first part of the Grafana vs. Chronograf and InfluxDB exploration, let's look at the Grafana stack. Grafana is an open-source platform for monitoring and analytics. Small and large companies use it to monitor applications, networks, infrastructure, IoT devices, etc.
To start working with Grafana, first install it and complete the setup. There are several ways to install and configuration of the parameters. This step can be simplified significantly if you use MetricFire's Grafana as a Service product. In this case, you don't need to take care of the local installation and maintenance. You can simply interact with the MetricFire Grafana in your browser.
Grafana supports different data sources out of the box. Among them: are Graphite, Prometheus, ElasticSearch, InfluxDB, PostgreSQL, MySQL, CloudWatch, Azure Monitor, and others. If there is no native support for a data source, you can try to find a corresponding plugin, or use a platform like DreamFactory to provide governed API access to additional data sources and integrate them seamlessly with Grafana.
Once you have added the data source to Grafana, you can query this source, visualize its data, and create dashboards with various visualizations. Check out our blog articles on Getting Started with Grafana and Our Favorite Grafana Dashboards for more information. Grafana supports easy collaboration and sharing, so teammates can elaborate on the dashboards together.
Alerting is an essential component of any monitoring system. Nobody wants to sit in front of dashboards day and night waiting for some events. Luckily, Grafana provides excellent support for alerting. You can create different alert rules, chain them together, configure the analyzed periods and evaluation intervals, and more. In addition, Grafana can send you a notification about alerts breaching. To use this feature, you should set up notification channels (email, Slack, custom webhooks, etc.).
In the image below, you can see an example of the dashboard in Grafana (which uses the Hosted Graphite Agent as a data source):
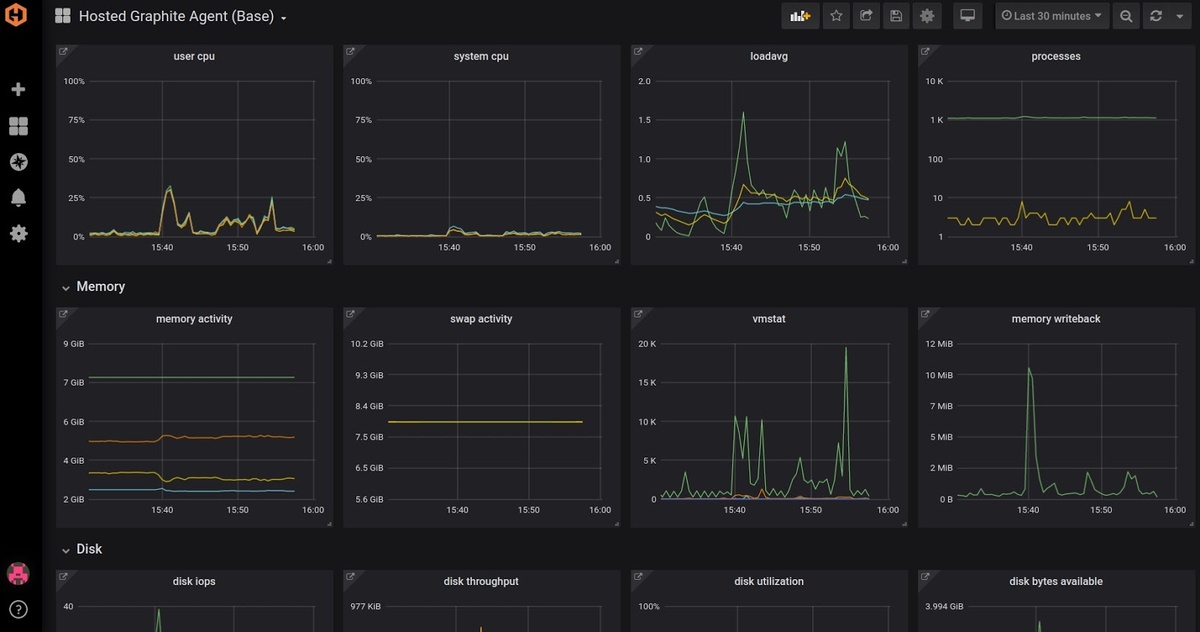
For more information, you can see our Grafana Dashboards from Basic to Advanced, and also our article on how to set up the Hosted Graphite Agent.
Our Hosted Graphite solution is a great way to overcome some of the drawbacks of Prometheus and monitor Kubernetes and the other important systems and applications you have. The benefits? Better redundancy storage (three times the redundant storage) equals seamless scaling and top-notch data protection. Control by APIs allows for automated control of Hosted Graphite resources. Tagged metrics allow for easy viewing and organizing of data views. You get all the benefits of open-source Graphite, with all the enhancements (built-in agent, team accounts, integrations to major platforms) you need.
Read more about our Hosted Graphite services here.
InfluxDB Stack Overview
InfluxDB is a time-series database. It is the central element of the so-called TICK-stack. TICK stands for Telegraf, InfluxDB, Chronograf, and Kapacitor.
Telegraf is an agent for metrics collection. The Chronograf is the user interface for interaction with the stack and the visualization and monitoring platform. Kapacitor is a tool for data processing. Using Kapacitor, you can configure alerts and notifications for InfluxDB.
The Chronograf is a tool compared with Grafana directly, as they are from the same pool of instruments. Using Chronograf, you can interact with the entire TICK-stack. The visualization and monitoring feature of Chronograf is just one of its useful capabilities. For example, Chronograf provides an interface for alert configuration, but Kapacitor performs all the required work.
In Chronograf, you can create and explore dashboards. But one important thing you should remember is that Chronograf was developed specifically for working with the InfluxDB stack.
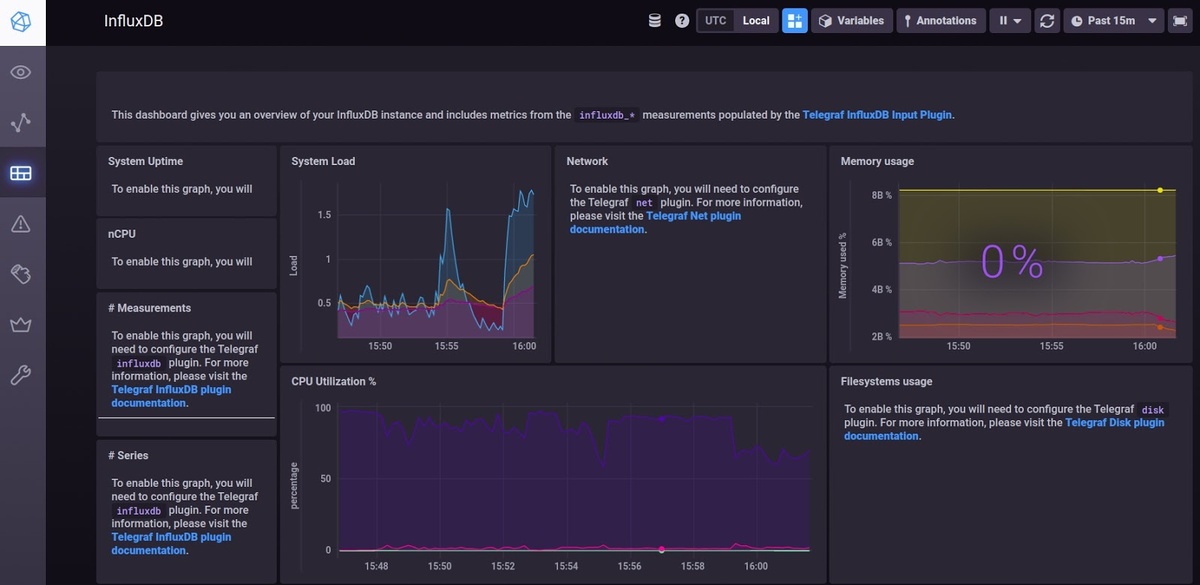
Below you can see an example of the dashboard in Chronograf:
Comparison of Important Points
Let’s now compare the main points of Grafana and Chronograf from the InfluxDB stack.
- Grafana is a dedicated monitoring and visualization tool for a wide range of data sources. Meanwhile, Chronograf is for working in a bundle with InfluxDB, Kapacitor, and Telegraf.
- Chronograf is not only a monitoring tool. It is also a user interface for the entire TICK-stack. This means you can manage different parameters of the TICK-stack using Chronograf, but you cannot do the same using Grafana.
- Grafana and Chronograf are open-sourced. Also, there are hosted solutions available for both of them. For example, MetricFire's Grafana as a Service is the hosted solution for Grafana.
- Chronograf is optimized to work with InfluxDB. Grafana also supports InfluxDB as a data source, but their interaction may not be so efficient.
- Grafana has native support for alerting. Chronograf provides the interface for alert creation, but Kapacitor must be used as the alert engine.
- Both Grafana and Chronograf support different installation methods and operating systems. Among them are Linux, macOS, Windows, Docker, and ARM. For Linux, both tools support Debian/Ubuntu and RedHat/CentOS.
- You can configure the access policies and users for Grafana, as well as for Chronograf.
- You can explore metrics using queries both in Grafana and Chronograf. Both tools support a range of aggregation functions (for example, mean(), avg(), count(), etc.). Chronograf provides an option to write the queries using InfluxDB SQL-like query language (InfluxQL).
- Grafana supports the creation of dashboards that consist of panels from different data sources. Panels are the components of the dashboard - an element of visualization. In other words, a single dashboard could reflect information from various sources. This makes Grafana extremely flexible and versatile. Chronograf works only with InfluxDB, so it cannot provide the same level of flexibility as Grafana.
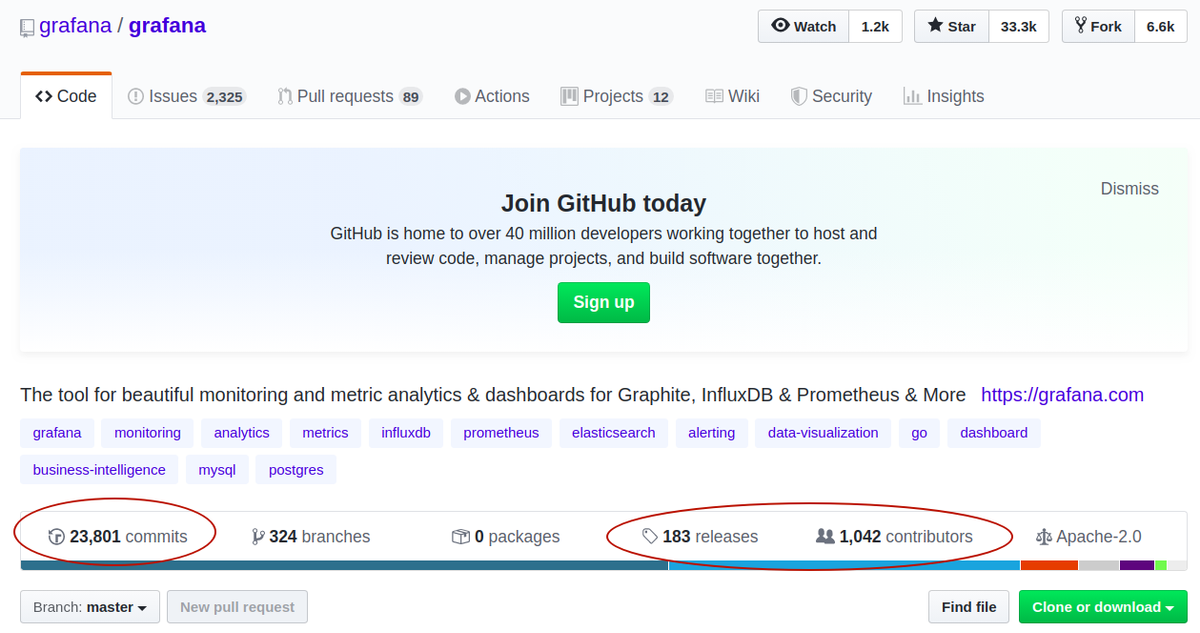
- Grafana has a more active and broader community than Chronograf from TICK-stack. The Grafana repository on GitHub has around 24000 commits, 183 releases, and 1042 contributors at the moment of writing, as shown in the image below.
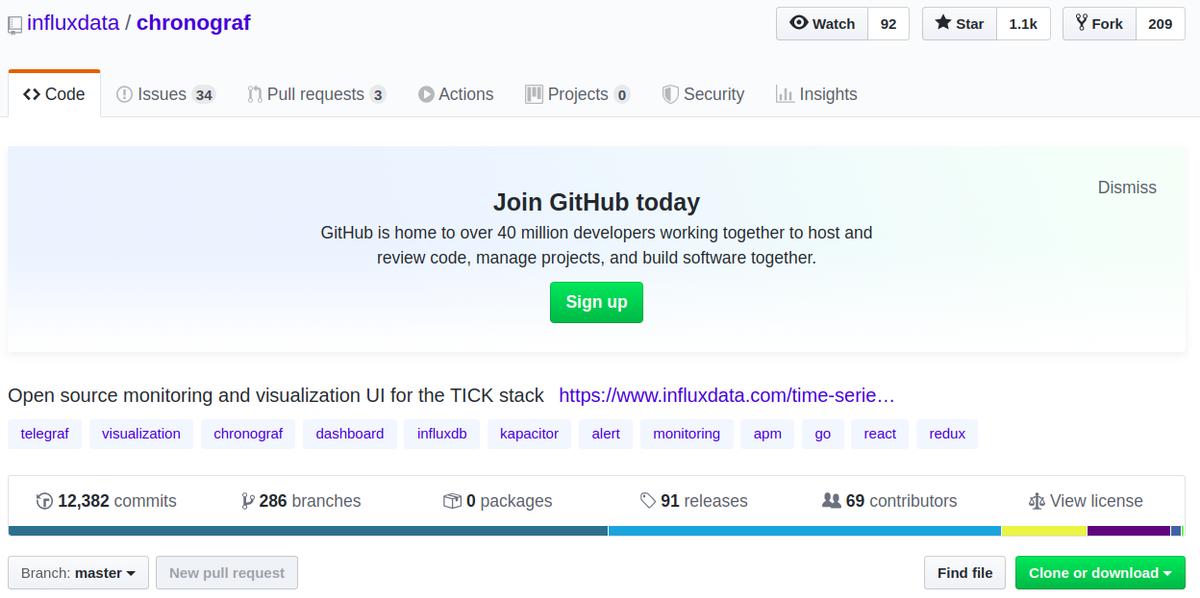
In turn, the Chronograf repository on GitHub is much smaller. It counts 12382 commits, 91 releases, and only 69 contributors:
11. Let’s also compare the popularity of solutions using Google Trends. In the screenshot below you can see that over the last 12 months, the popularity of the “Grafana” search term exceeds the popularity of the “InfluxDB” search term by approximately three times.
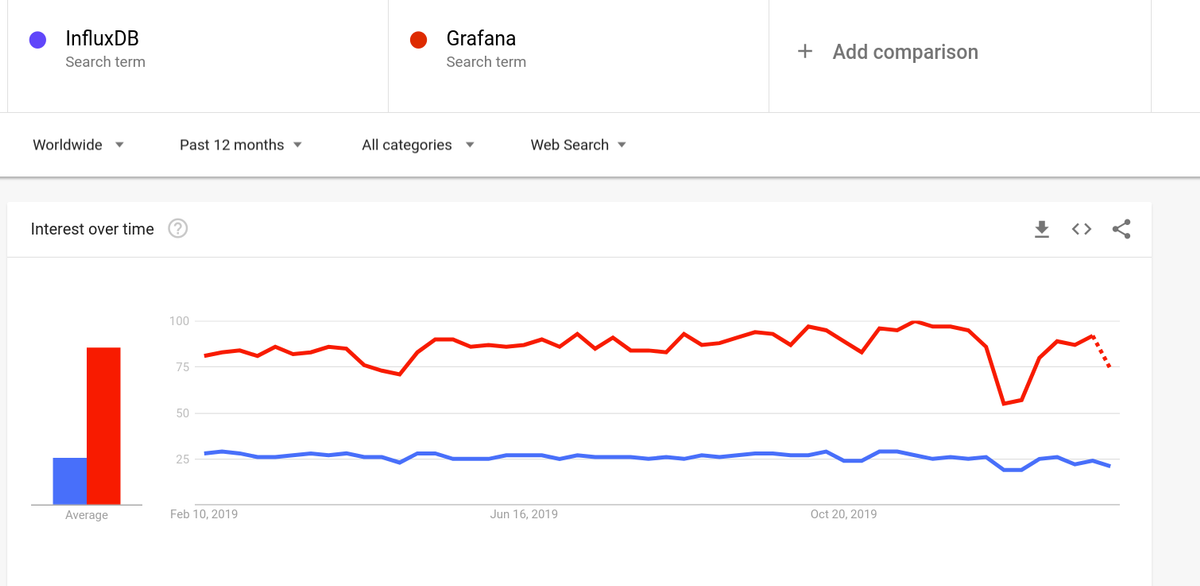
This is due to the higher versatility of Grafana as a universal tool if compared to InfluxDB and its Chronograf.
Now let’s conclude where you should consider using InfluxDB and Chronograf and where it is probably better to use Grafana.
Grafana and InfluxDB stacks are similar, yet different instruments. Grafana was developed to serve many various data sources. It is incredibly flexible. Grafana even allows you to create a single dashboard using data from multiple data sources simultaneously.
InfluxDB is a time-series database and the TICK-stack is built around it. Chronograf is intended to work with InfluxDB, Telegraf, and Kapacitor. Chronograf is not just the monitoring and visualization platform, but also the user interfaces for interacting with the entire TICK-stack. It works only with the InfluxDB data source.
Taking into account these considerations, we recommend the following use cases:
Use Grafana:
- When you have multiple data sources to work with
- When you need to build versatile and flexible dashboards
- When you have non-time-series data besides time-series data
- When you need to share your work with others easily
- When you need to set up alerting without additional configurations
Use InfluxDB and its Chronograf tool:
- When you have to work with time-series data
- When your data is already in InfluxDB, and you use other instruments from TICK-stack
- When you are used to writing queries with the help of InfluxQL language
- When you need not only to create dashboards and visualize metrics but also manage your TICK-stack
Summary
In this article, we analyzed Grafana and InfluxDB coupled with its Chronograf tool. We have also compared their major features important for monitoring purposes and gave practical recommendations. To sum up, Grafana is a popular and powerful tool for building, exploring, and sharing dashboards.
Due to its support of multiple data sources, it has become the first choice for many use cases. So, in most cases, Grafana will suit your needs. However, developers and infrastructure engineers appreciate Chronograf for its full compatibility with InfluxDB. Under some conditions, you should consider using the InfluxDB stack for your purposes.
Grafana is easier to install and set up when you use MetricFire's Grafana as a Service. So, what are the next steps after you've explored the Grafana vs. Chronograf and InfluxDB argument?
Well, first, check out the MetricFire free trial today, or feel free to book a demo and speak to us directly about the best monitoring solutions for you.


