
Table of Contents
- Introduction
- Key Takeaways
- Why do we need to monitor Docker containers?
- How to use cAdvisor for container monitoring
- Quick start: running cAdvisor
- Collecting Application Metrics with cAdvisor
- Creating a configuration
- Passing the configuration to cAdvisor
- API access to application-specific metrics
- Monitoring and Exporting cAdvisor Metrics with Prometheus
- Visualizing with Grafana
- Conclusion
Great systems are not just built. They are monitored.
MetricFire runs Graphite and Grafana as a fully managed service for growing engineering teams, taking care of storage, scaling, and version updates so your team doesn't have to. Plans start at $19/month, billed per metric namespace rather than per host, and include engineer-staffed support. Integrations work natively with Heroku, AWS, Azure, and GCP, and data is stored with 3× redundancy in SOC2- and ISO:27001-certified data centres.

Introduction
Docker is one of the most popular tools for containerization, and several tools have been developed by the open-source community to monitor what happens inside Docker containers. This guide focuses on one tool specifically: cAdvisor.
In this article, we'll learn about Docker container monitoring, with a specific focus on cAdvisor (Container Advisor), an open-source tool provided by Google. We will explore why monitoring is crucial, how to use cAdvisor for container monitoring, and how it can be augmented with additional tools like Prometheus and Grafana for a complete monitoring and alerting solution. By the end, you'll have a comprehensive understanding of container monitoring and the tools at your disposal to keep your containerized applications running smoothly and efficiently.
Key Takeaways
- Docker is a popular tool for containerization, and monitoring containerized applications is crucial for improving software performance.
- cAdvisor records historical resource usage, resource isolation parameters, and network statistics for each container.
- cAdvisor provides a web interface for real-time container usage metrics, including CPU and memory usage, process details, and more.
- Prometheus can be used to scrape and monitor cAdvisor metrics, with configurations specified in the prometheus.yml file.
- Alerts based on cAdvisor metrics can be set up using Prometheus Alert Manager, which allows routing alerts to various applications or services.
Why do we need to monitor Docker containers?
Monitoring allows us to gather vital information on the state of our software, enabling development teams to figure out ways in which to improve their product. Because each container is a self-contained system, monitoring is even more imperative.
Monitoring for a container involves recording and reporting usage metrics from each container back to the monitoring system. This way, you ensure the detection of bugs and application refinement for better all-around performance and robustness.
How to use cAdvisor for container monitoring
cAdvisor (Container Advisor) is an open-source container monitoring tool offered and managed by Google. It has native support for Docker containers and just about any other container. cAdvisor consists of a single container daemon that collects information about the containers that are running, processes that data, and then exports it. This information can go to its dedicated web interface, or to a third-party app, such as Big Query, ElasticSearch, InfluxDB, Kafka, Prometheus, Redis, or StatsD. It can also be written to standard output by setting the -storage_driver flag to stdout.
Specifically, cAdvisor records historical resource usage, resource isolation parameters, and network statistics for each container machine-wide.
One note before we jump in: Metric Fire is a hosted Graphite service, with a complete infrastructure and application monitoring platform that helps customers collect, store, and visualize time series data from any source. Looking for more information? Get a free trial or sign up for a demo here.
Quick start: running cAdvisor
Setting up and running cAdvisor is a simple task because cAdvisor itself is a single Docker image. As such, it can be started and run using the docker run command. You can run cAdvisor to monitor containers on your local machine by running the following command in your terminal:
sudo docker run \

  --volume=/:/rootfs:ro \

  --volume=/var/run:/var/run:ro \

  --volume=/sys:/sys:ro \

  --volume=/var/lib/docker/:/var/lib/docker:ro \

  --volume=/dev/disk/:/dev/disk:ro \

  --publish=8080:8080 \

  --detach=true \

  --name=cadvisor \

  google/cadvisor:latest
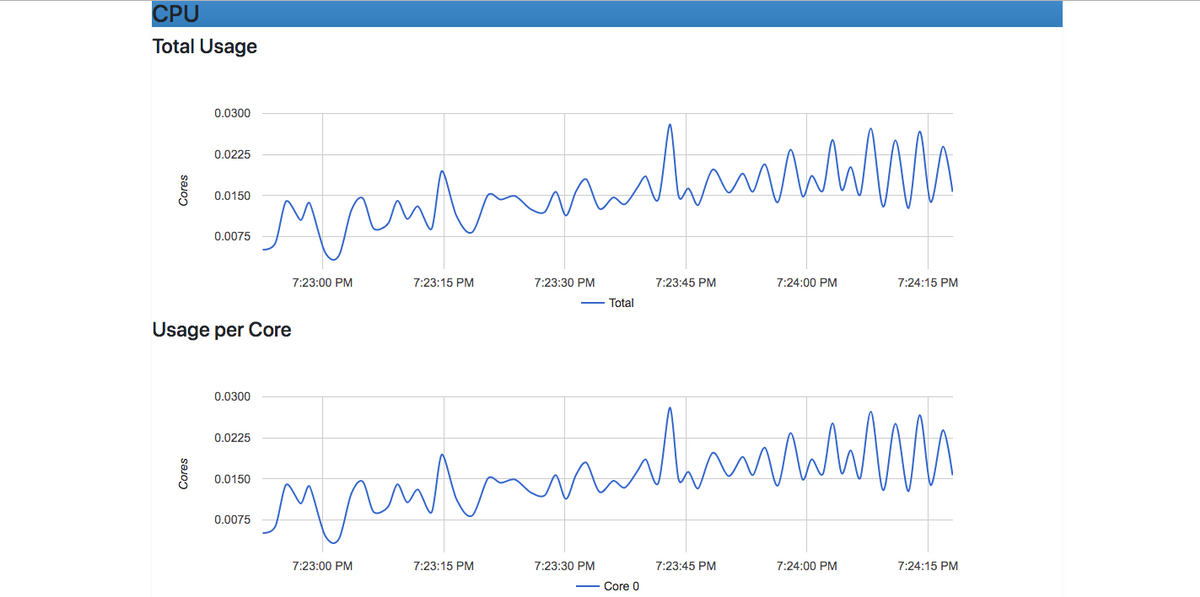
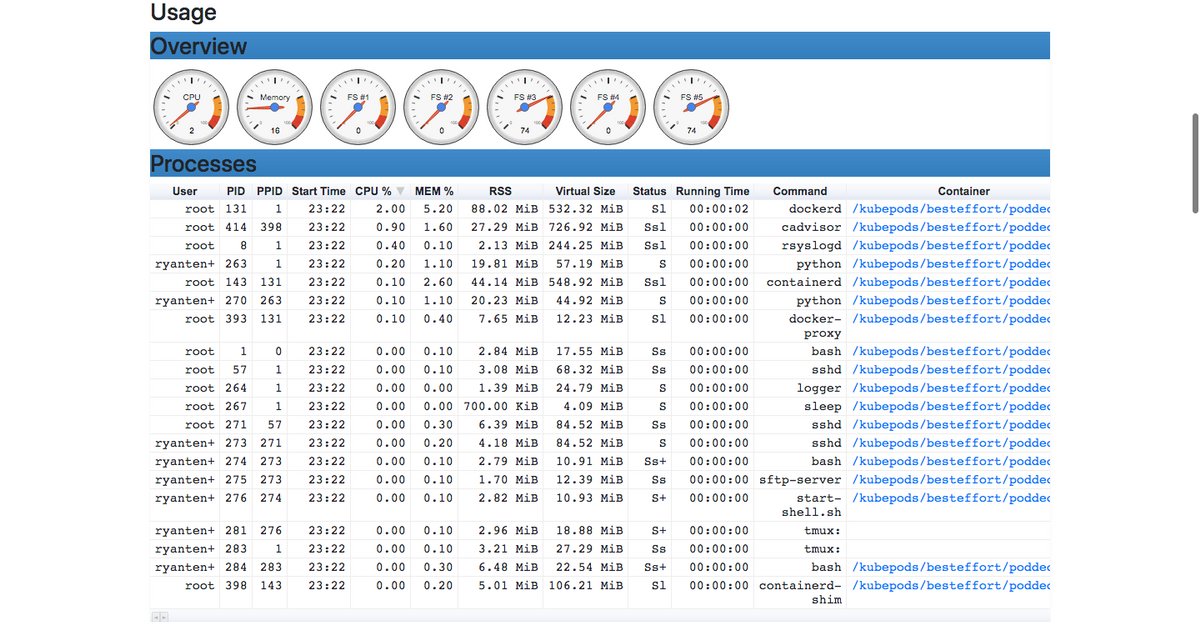
It’s that easy! cAdvisor is now running in the background. It will connect itself to the Docker daemon running locally, gather the container usage metrics, and display them on its web user interface accessible via http://localhost:8080/. On the user interface, you should see real-time usage metrics from your containers including CPU and memory usage, a detailed overview of all your running processes, and so much more.
Notes:
- If your docker daemon is running with user namespace enabled, you will need to add the --userns=host option to enable cAdvisor to monitor Docker containers. Otherwise, cAdvisor will be unable to connect to the Docker daemon.
- If you’re running on either CentOS, Fedora, or RHEL, you may need to run the container with --privileged=true and --volume=/cgroup:/cgroup:ro \ in order for cAdvisor to access and monitor Docker containers. This is because RHEL and CentOS are stricter when it comes to container access. With cAdvisor needing access to the Docker daemon through its socket, you will have to set --privileged=true. Also, in some versions of RHEL and CentOS the cgroup hierarchies are mounted in the /cgroup directory, so you will need the additional Docker option of --volume=/cgroup:/cgroup:ro \ to run cAdvisor.
Collecting Application Metrics with cAdvisor
In addition to container usage metrics, cAdvisor is also capable of collecting application metrics, including the number of active and reading connections, and whether or not the application has adequate CPU and memory allocation. (It is worth noting that, at the time of writing, application metrics supported by cAdvisor are in the alpha stage of development, so keep that in mind.) A container can expose application metrics on a status page or on a separate API for fetching stats. cAdvisor provides a way to collect these metrics in a generic manner.
In order to enable cAdvisor to collect application metrics, there are two things you need to do:
- Create a configuration
- Pass that configuration to cAdvisor
Creating a configuration
An application metric configuration tells cAdvisor where to search for application metrics, and then specifies other parameters to export metrics from cAdvisor to user interfaces and backends. The metric configuration includes:
- An endpoint (a location to collect metrics from)
- Type (gauge, counter, etc.)
- Name of metric
- Data type (float, int)
- Polling frequency
- Units (seconds, kbps, count)
- Regexps (regular expressions to specify which metrics to collect and how to parse and handle them)
Below is an example of a generic metric collector which assumes no structured information:
{

  "endpoint" : "http://localhost:8000/nginx_status",

  "metrics_config" : [

    {

      "name" : "activeConnections",

      "metric_type" : "gauge",

      "units" : "number of active connections",

      "data_type" : "int",

      "polling_frequency" : 10,

      "regex" : "Active connections: ([0-9]+)"

    },

    {

      "name" : "reading",

      "metric_type" : "gauge",

      "units" : "number of reading connections",

      "data_type" : "int",

      "polling_frequency" : 10,

      "regex" : "Reading: ([0-9]+) .*"

    }

  ]

}
In the case of structured metrics exports to Prometheus, for example, the configuration can be shrunk to just the endpoint (other information can be obtained from the structure). Here is a sample Prometheus configuration that collects all metrics from an endpoint:
{

  "endpoint" : "http://localhost:9100/metrics"

}

Here’s another sample configuration that collects only selected metrics:

{

  "endpoint" : "http://localhost:8000/metrics",

  "metrics_config" : [

    "scheduler_binding_latency",

    "scheduler_e2e_scheduling_latency",

    "scheduling_algorithm_latency"

  ]

}
Passing the configuration to cAdvisor
cAdvisor uses Docker container labels to fetch configurations for each Docker container. Any label beginning with io.cadvisor.metric is parsed as a cAdvisor application metric label. cAdvisor uses the value of that label as an indicator of where the configuration can be found. For example, labels of the form io.cadvisor.metric.prometheus-xyz suggests that the configuration points to a Prometheus metrics endpoint.
The configuration file can either be a part of the container image or can be added later on (at runtime) with a volume. This ensures that there is no connection between the host within which the container is running and the application metrics configuration. A container’s metric information is self-contained, so a sample configuration for Redis would look like this:
Dockerfile (or runtime):

FROM redis

 ADD redis_config.json /var/cadvisor/redis_config.json

 LABEL io.cadvisor.metric.redis="/var/cadvisor/redis_config.json"
Where redis_config.json is the configuration file that contains the json configurations as shown above. cAdvisor will then reach into the container image at runtime, process the configuration file, and start collecting and exposing application metrics.
Note that cAdvisor looks explicitly at the container labels to extract this information. In Docker 1.8, containers don't inherit tags from their images; thus, you must specify the label at runtime.
API access to application-specific metrics
You can access application-specific metrics for a particular container using the following endpoint: http://localhost:8080/api/v2.0/appmetrics/containerName
The set of application metrics being collected can be discovered from the container specifications: http://localhost:8080/api/v2.0/spec/containerName
Regular stats API also has application metrics appended to it: http://localhost:8080/api/v2.0/stats/containerName
Note: You can find the application metrics on the container page after the resource metrics.
cAdvisor, however, has its limitations. It is unable to send alerts back to the user to provide them with critical information. For example, if one of the measured metrics hits a critical level, cAdvisor won’t inform you. Take this into consideration when using it.
Regardless, cAdvisor is still an excellent tool for container monitoring due to its exceptionally easy setup and seamless Docker support. If you really need to incorporate an alerting mechanism, there are many options you can choose from including Prometheus and StatsD. We’ll walk through a quick example with Prometheus below.
Monitoring and Exporting cAdvisor Metrics with Prometheus
cAdvisor is capable of exposing container statistics to Prometheus out of the box. By default, these metrics are served under the /metrics HTTP endpoint. This endpoint can be customized by setting the -prometheus_endpoint command-line flag to the desired value. To optimize your metric collection and transform data across your entire infrastructure, you can also integrate cAdvisor with Integrate.io, a low-code data integration and transformation platform for ETL, ELT, and reverse ETL pipelines that connect your monitoring systems with other databases, APIs, and data warehouses. Additionally, MetricFire provides Graphite Hosting. Hosted Graphite allows you to send metrics and observe your infrastructure, application, and more. Get a free trial or sign up for a demo here.
To monitor cAdvisor with Prometheus, we have to configure one or more jobs in Prometheus which scrape the relevant cAdvisor processes at that metrics endpoint.
But first, we’ll go ahead and configure Prometheus. We do this using the prometheus.yml file. Create a prometheus.yml file and paste into it the code below (the code is from my GitHub page):
global:
  scrape_interval: 5s
  evaluation_interval: 5s
  scrape_timeout: 10s
rule_files:
- '/etc/prometeus/alert.rules'
alerting:
  alertmanagers:
  - static_configs:
    - targets:
    # whatever you want
scrape_configs:
  - job_name: 'prometheus'
    static_configs:
    - targets: ['prometheus:9090']
      labels:
        alias: 'prometheus'
  - job_name: 'cadvisor'
    static_configs:
    - targets: ['cadvisor:8080']
      labels:
        alias: 'cadvisor'
The global variables can be explained below:
- scrape_interval: how frequently targets are scraped for metrics (the default is one minute)
- scrape_timeout: the time it takes for a scrape request to time out (the default is 10 seconds)
- rule_files: path to rule files, in this case, the alert rule file which specifies how we handle alerts when they come up
- evaluation_interval: how frequently to evaluate rules (the default is 1 minute)
In the same folder where you created the prometheus.yml file, create a docker-compose.yml file and populate it with this Docker Compose configuration (also from my GitHub page):
version: '3.2'
services:
  prometheus:
    image: 'prom/prometheus:latest'
    container_name: prometheus
    volumes:
      - ./prometheus.yml:/etc/prometheus/prometheus.yml
    commands:
      - '--config.file=/etc/prometheus/prometheus.yml'
    ports:
      - '9090:9090'
  cadvisor:
    image: 'google/cadvisor:latest'
    container_name: cadvisor
    volumes:
      - /:/rootfs:ro
      - /var/run:/var/run:ro
      - /sys:/sys:ro
      - /var/lib/docker/:/var/lib/docker:ro
      - /dev/disk:/dev/disk/:ro
    ports:
    - '8080:8080'
Now we create our alert.rules file which specifies how to handle a specific alert. Below is an example of a simple alert.rules file available on my GitHub page.
ALERT containerAlert
    IF absent(((time() - container_last_seen{name="your-container-name"}) < 5)) FOR 5s
    LABELS { severity="page" }
    ANNOTATIONS {
    	SUMMARY = "Instance {{$labels.instance}} down",
    	DESCRIPTION = "Instance= {{$labels.instance}}, Service/Job ={{$labels.job}} is down for more than 2 sec."
    }
This alert is triggered when a specific container (“your container name”) is stopped and absent for 5 seconds or more. Alerts in Prometheus are handled by the Prometheus Alert Manager, which is pretty flexible and allows for alerts to be instantly routed to an application of your choice, be it an email, a Slack workspace, or more. In order to set this up, take a look at the alert manager configuration documentation.
Visualizing with Grafana
Once you have Prometheus set up to monitor your docker containers, you can visualize the metrics in Grafana. Our blog article on Connecting Prometheus and Grafana walks through a full tutorial on how to visualize metrics from cAdvisor and Redis in Grafana. The article shows how to modify the prometheus.yml file to send metrics into Grafana and then shows examples of Grafana dashboards.
Conclusion
And there you have it! You have successfully monitored a Docker container (or many!), can see its usage and host metrics using cAdvisor, and can receive alerts when a condition that you specify is met. Pretty cool!
If you're interested in trying out Hosted Graphite, sign up for our free trial. You can also sign up for a demo and we can talk about the best monitoring solutions for you.


