

Table of Contents
Great systems are not just built. They are monitored.
MetricFire runs Graphite and Grafana as a fully managed service for growing engineering teams, taking care of storage, scaling, and version updates so your team doesn't have to. Plans start at $19/month, billed per metric namespace rather than per host, and include engineer-staffed support. Integrations work natively with Heroku, AWS, Azure, and GCP, and data is stored with 3× redundancy in SOC2- and ISO:27001-certified data centres.
Introduction
When you design architecture to monitor your digital assets - either software applications or hardware devices- you need to use different strategies depending on your monitoring target. The factors you want to consider can vary, including methods of retrieving monitoring data, frequency of data collection, and how you want to surface metrics and insights you find to stakeholders. In this article, we will focus on how to monitor your network's SNMP devices using Hosted Graphite.
Before we begin, check out MetricFire. We provide hosted services not only for the visualization tool but also for other comprehensive monitoring platforms such as Graphite and Prometheus. Using our services, you can optimize data collection for your network devices and visualize the outcome.
If you would like to learn more, please book a demo with us, or sign up for the free trial today.
What are SNMP devices?
SNMP, or Simple Network Management Protocol, refers to an Internet standard protocol to collect and organize information on IP networks and amend the information to alter device behavior. SNMP devices include cable modems, routers, switches, servers, workstations, printers, firewalls, and more. The protocol is compatible with most network devices. Thanks to its widely accepted standard and broad compatibility, the protocol is widely used in network management. People can also utilize it to retrieve information about network devices and use the collected data to monitor their network infrastructure.
Why do we want to monitor SNMP devices?
Monitoring SNMP devices means monitoring most of your network infrastructure, since many network devices use the management protocol. This means that asking why we want to monitor SNMP devices is almost equivalent to asking why we want to monitor our network infrastructure. The network enables hardware devices (thus software within them) to communicate with each other. Without this medium, the software we develop and the hardware we use lose most of their functionality and value since everything is connected nowadays.
When we fail to monitor them, we can also experience performance degradation. By monitoring our SNMP devices, we can identify potential issues before they occur. For instance, we can detect and resolve problems like network slowdowns before they worsen and impact your business operations. Pre-emptive measures will lead to reliability and continuity of your business and customer satisfaction. In addition to preventing a negative impact on customers and businesses by ensuring network devices are in good shape, you can provide an optimal working environment for your employees, which is critical these days, when many people work remotely.
Important metrics for SNMP devices
From SNMP devices, we can retrieve a variety of monitoring data. Among them, there are key metrics we need to focus on to ensure the stability and performance of SNMP devices.
- Power consumption: Using the protocol, you can monitor the power usage of network devices. Higher-than-normal electricity consumption can damage your network devices. Also, by tracking metrics, you can ensure energy efficiency across devices.
- CPU usage: like computers, network devices can utilize the CPU to process traffic and to enable responsive interactiveness among the connected equipment. When CPU usage spikes abnormally, you will want to examine the symptom from two perspectives - performance and security. When CPU usage jumps, the overall performance can experience a slowdown. Another potential cause of the CPU usage spike could be found in receiving too much traffic, which can imply a potential cyber attack.
- Memory usage: like CPU usage, having not enough memory can lead to deteriorated performance and malfunction. By monitoring memory usage, you can maintain optimal network performance.
- Fan status: some network devices need fans to cool down their temperature. Just like your laptop gets slow when its temperature increases, some network devices can be impacted due to a rising temperature.
- Incoming traffic: measuring incoming traffic can help you to understand the workload that SNMP devices need to handle. If there is too much traffic to handle, you will want to adjust the configuration to distribute incoming traffic or upgrade your network equipment evenly.
- Outgoing traffic: monitoring outgoing traffic can help you to understand how well your network resources work. When your outgoing traffic comes back with an error code, for example, 4xx or 5xx, you will want to search which server caused that error. By diagnosing the error and finding the root cause, you can make sure of seamless network operations.
How to monitor your SNMP devices
Now that we have learned the important monitoring metrics, let’s find out how we can monitor SNMP devices. We can start building a monitoring stack by collecting data using either Collectd or Telegraf.
Collectd
Collectd is a generic plugin that utilizes the Net-SNMP library to retrieve values from network devices using SNMP. The plugin is a generic plugin that cannot work without configuration because there is no default behavior. You can download the library from the Collectd website.
After you download the file, the main place you need to check is Collectd.conf. This is the configuration file for the system statistics collection daemon Collectd. The configuration file decides how the system statistics collection daemon, collectd, behaves. The most important option within the config is LoadPlugin. It controls which plugins to load. There are numerous plugins you can use. When the AutoLoadPlugin option is enabled, the explicit LoadPlugin lines can be omitted for all plugins with a configuration block, for example, the <Plugin…> block.
Telegraf
Another way of collecting data from SNMP devices is via Telegraf. Telegraf works as an agent for collecting, processing, aggregating, and writing metrics. This plugin allows developers to add support for additional SNMP metrics collection conveniently.
There are four main types of plugins:
- Input Plugins: collect metrics from the system, services, or third-party APIs
- Processor Plugins: transform, decorate, and/or filter metrics
- Aggregator Plugins: create aggregate metrics (e.g. mean, min, max, quantiles, etc.)
- Output Plugins: write metrics to various destinations
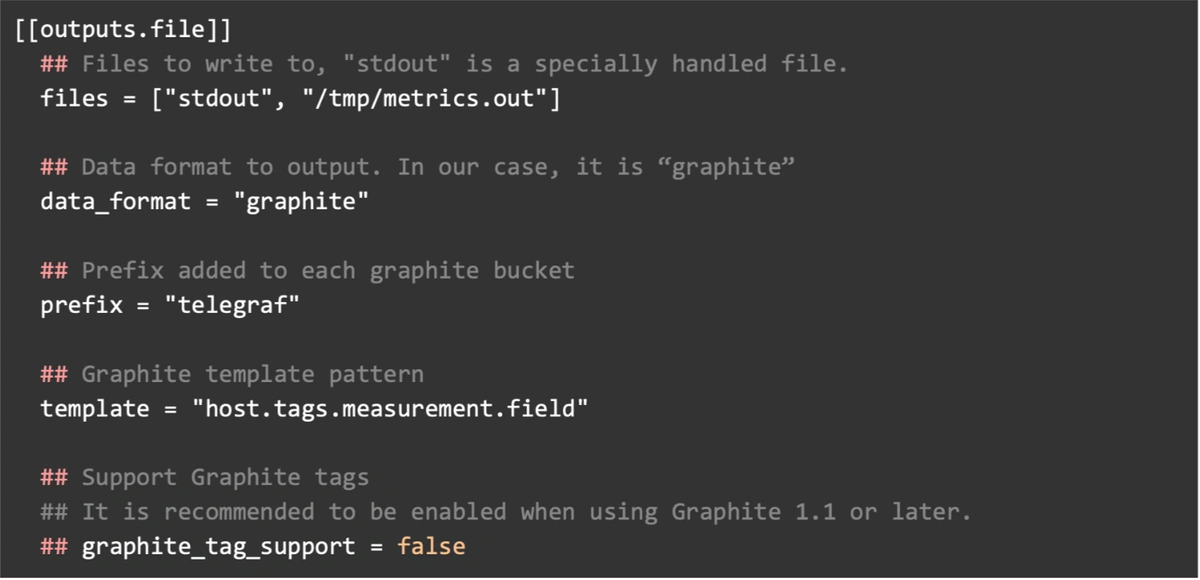
To get the plugin, check the documentation. What’s great about Telegraf is that it provides a plugin that supports Graphite. This addon can write to Graphite via TCP. To configure Telegraf to write to Graphite, refer to the sample config file below.
Advantages of a Hosted Graphite solution from MetricFire
SNMP data finally reaches Graphite for sharing with stakeholders. Graphite is a great open-source tool that provides comprehensive monitoring capabilities. However, since it is open-source software, you have to handle everything from installation to regular maintenance. You might end up monitoring the monitoring software. Recognising the difficulty of maintenance tasks and the need for additional features, MetricFire offers Hosted Graphite to users.
Hosted Graphite preserves all the benefits of open-source Graphite. Further, it enhances it with a built-in agent, team accounts, granular dashboard permissions, and integrations with other major platforms and services, including AWS, logging tools, and more.
In addition to these major features mentioned above, there are more benefits for users.
- Hosted Graphite backs up your user data and dashboard every hour.
- MetricFire's technical experts will provide full support.
- MetricFire offers an extensive range of options for users of all sizes, with plans and customisation to meet your needs.
- MetricFire’s on-call team is ready 24/7, 365 days a year. Our team keeps watching your hosted Graphite from around the world using an automated monitoring system.
- We have been ingesting billions of data points per day since 2012. Thousands of engineers trust our mature metric processing and storage capabilities.
- You can directly send metrics from your application without additional dependencies or aggregation services.
Conclusion
In this article, we learned the concept of SNMP and its devices. The article also discussed the importance of monitoring SNMP devices and the main metrics we can use. There are two ways to monitor your SNMP devices using Collectd and Telegraf. For Graphite, it may be easier to use Telegraf, since it supports both Graphite output and input. To use Graphite, consider using Hosted Graphite by MetricFire to save you maintenance effort and take advantage of the added features.
Choose hosted solutions from MetricFire and create dynamic information graphics easily and quickly. Get a MetricFire free trial or book a demo with our experts to learn more about how MetricFire can help you.


