

Table of Contents
- Introduction
- Key Takeaways
- Why Should You Monitor Android Data?
- Use Cases for Monitoring Android Data
- Memory Monitoring and Leak Detection
- Monitoring App Uptime
- Monitoring Energy Efficiency
- Monitoring Storage Usage
- Valuable Metrics From Your Android Data
- Monitoring Your Data with MetricFire - Step 1: Log in to MetricFire Account - Step 2: Create an Android Project - Step 3: Integrate MetricFire APIs with Android Project - Step 4: Building Code for Android Data Metrics - Step 5: Send Android Data Metrics to the MetricFire
- Conclusion
- How MetricFire Can Help?
Great systems are not just built. They are monitored.
MetricFire runs Graphite and Grafana as a fully managed service for growing engineering teams, taking care of storage, scaling, and version updates so your team doesn't have to. Plans start at $19/month, billed per metric namespace rather than per host, and include engineer-staffed support. Integrations work natively with Heroku, AWS, Azure, and GCP, and data is stored with 3× redundancy in SOC2- and ISO:27001-certified data centres.
Introduction
Understanding the performance of Android applications, user interactions, and problem-solving is significantly reliant on data monitoring. As the realm of mobile technology continues to expand, developers are tasked with managing an increasingly large amount of data. When this data is correctly harvested and scrutinized, it can yield valuable insights that inform strategic choices and lead to improvements in the app.
MetricFire is an advanced platform offering comprehensive solutions for data monitoring and visualization. Its key strengths lie in its scalability, detailed insight generation, and customization to cater to unique use cases.
In this article, we will explore how MetricFire can be utilized for Android data monitoring, highlighting its processes, features, and advantages. Whether you're a developer aiming to boost your app's performance or a business executive looking to make decisions based on data, this guide will equip you with the necessary knowledge to make the most of MetricFire.
Key Takeaways
-
Monitoring Android data is crucial to improve and debug issues with your application performance and device.
-
There are numerous use cases for monitoring Android data.
-
A step-by-step guide to monitoring Android data with MetricFire.
Why Should You Monitor Android Data?
Several reasons underscore the importance of Android data monitoring:
-
Improving User Experience: Monitoring Android data offers insight into user behavior within your application, identifying popular features and detecting potential hurdles. This understanding enables you to make improvements tailored to the user, enhancing their experience and, in turn, boosting user retention.
-
Problem-Solving and Debugging: Data monitoring facilitates swift identification and resolution of performance glitches or bugs in your Android application. By studying real-time data, you can diagnose and rectify the source of issues promptly, reducing downtime and boosting overall app performance.
-
Guiding Development Strategies: Data monitoring delivers actionable insights that can shape the development process. It helps distinguish between popular and underused features, enabling effective resource allocation and prioritization of the development of features that resonate with users.
-
Performance Optimization: Regular scrutiny of your app's data allows for an accurate assessment of its performance. You can spot bottlenecks, optimize resource utilization, and ensure your application operates seamlessly, delivering the best service to your users.
-
Security: Monitoring Android data can alert you to unusual patterns or activities that may suggest a security breach. Early identification of such potential risks enables you to take preventative measures to protect the application and user data.
Use Cases for Monitoring Android Data
The use cases for Android data monitoring are varied, some of which encompass the following:
-
Memory Monitoring and Leak Detection
A mobile application may want to monitor its memory usage over time to ensure its operating within expected parameters. This information can help identify memory leaks, where the app is progressively using more and more memory, which can eventually lead to performance issues or crashes.
-
Monitoring App Uptime
Uptime can provide valuable insights into the stability and reliability of an application. By monitoring uptime, developers can understand how long the application runs without crashing or being restarted. An unexpected uptime drop can signify an app issue, prompting developers to investigate and rectify any problems.
-
Monitoring Energy Efficiency
The amount of battery an application uses can greatly influence user perception and usage patterns. If an app drains battery quickly, users may be more likely to uninstall or use it less frequently.
-
Monitoring Storage Usage
Applications that use significant amounts of internal storage can lead to a poor user experience, especially on devices with limited storage space. Monitoring available internal storage can help developers understand how their app impacts device storage and can guide decisions about data management.
Valuable Metrics From Your Android Data
Numerous vital metrics in Android data monitoring can yield insightful information about your application's performance and user interactions.
Let’s explore some of these metrics below.
-
Battery Usage: Battery consumption is an important metric to monitor, especially for mobile apps. Excessive battery usage can lead to poor user experience and affect device performance.
-
Memory Usage: Monitoring memory usage helps ensure your application operates within expected parameters. It can help identify memory leaks, where the app progressively uses more memory, leading to performance issues or crashes.
-
Location Data: Tracking location data helps ensure the proper functioning of location-based services, enables personalized experiences, and ensures compliance with privacy regulations.
-
Screen Load Time: Screen load time is a critical metric for assessing the performance and user experience of an app. It measures the time taken for screens or activities to load and become interactive for users.
-
CPU Usage: Tracking CPU usage can provide insights into the app's processing demands and help optimize performance.
-
Network Latency: Monitoring network latency allows you to identify and address slow network connections or server-side performance issues.
-
User Engagement: Tracking metrics like session duration, screens visited, and user actions can help measure user engagement and identify areas for improvement.
-
Crash Reports: Monitoring crash reports help to identify and fix issues that cause app crashes, improving overall stability.
-
API Response Times: Monitoring the response times of external APIs used by your app can help identify slow or failing integrations.
-
User Retention: Tracking metrics related to user churn, such as the number of active users over time, can help you understand and improve user retention rates.
Monitoring Your Data with MetricFire
MetricFire stands out as an all-in-one monitoring platform that makes tracking and analyzing Android data a breeze. Its user-friendly interface, robust functionalities, and scalable solutions pave the way for a seamless approach to data monitoring.
Before we discuss how to monitor data with MetricFire, let’s create an Android project and integrate it with MetricFire APIs.
Step 1: Log in to MetricFire Account
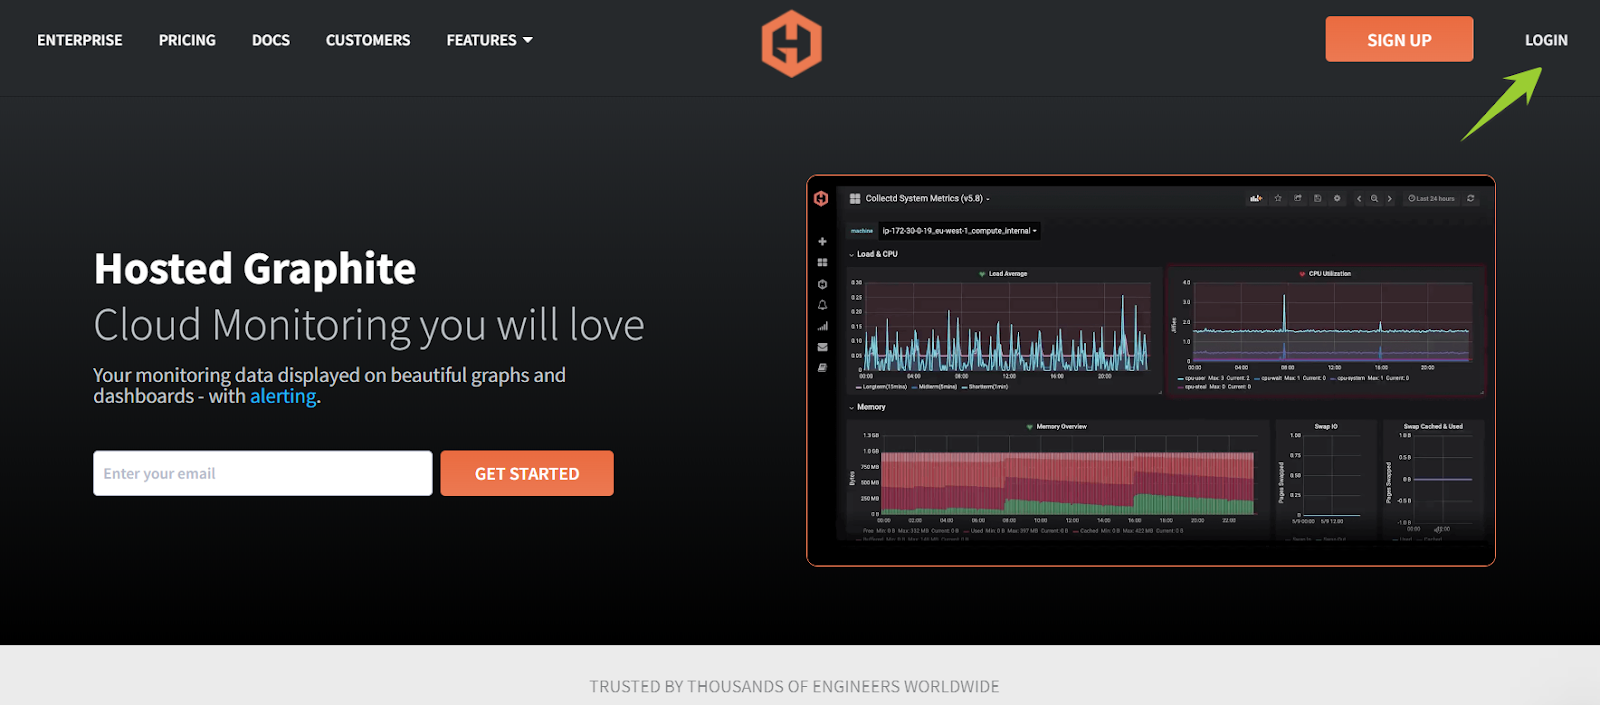
Go to the HostedGraphite managed by the MetricFire website.
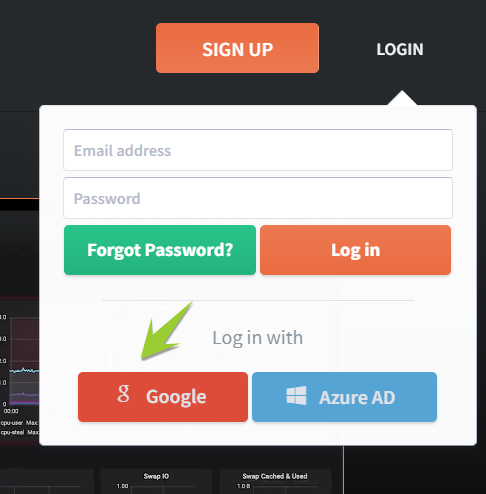
Click on ‘Google’ to log in using your Gmail account.
After login, the MetricFire dashboard will be shown with different properties.
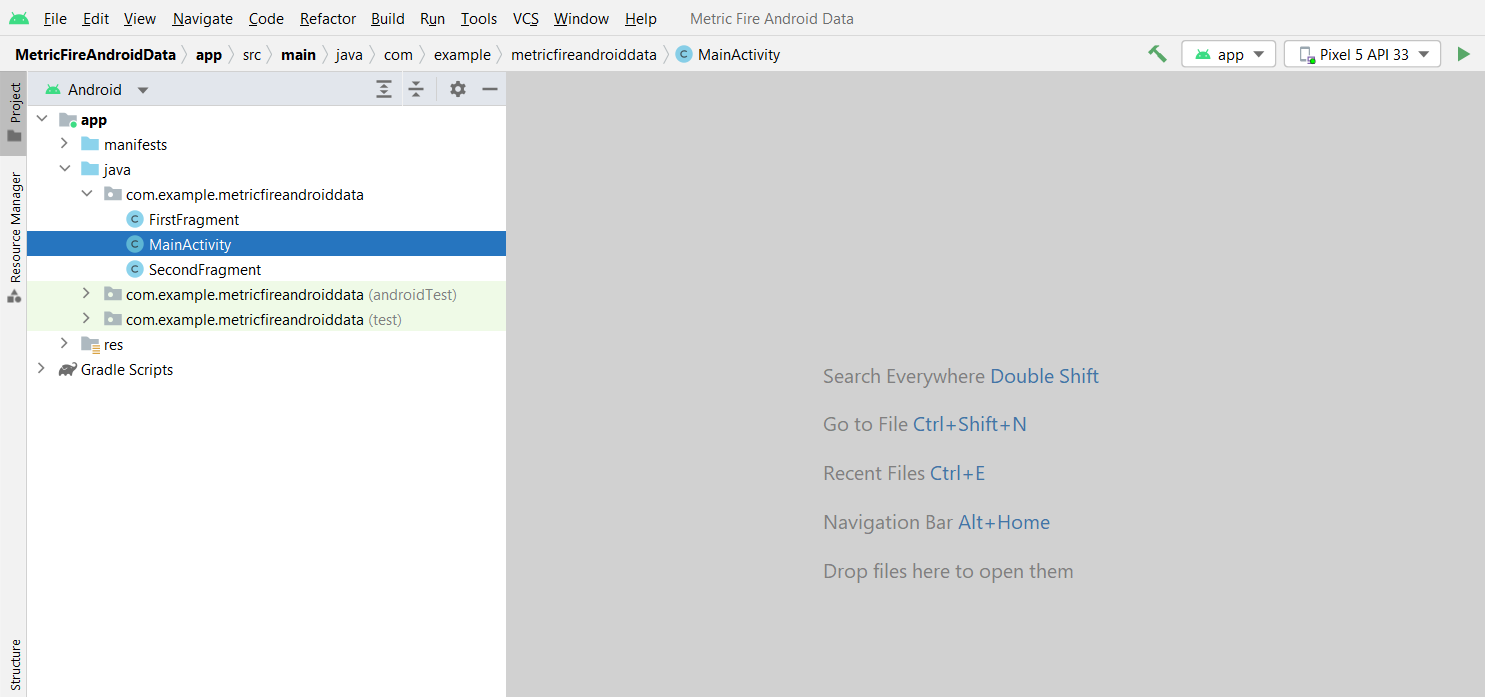
Step 2: Create an Android Project
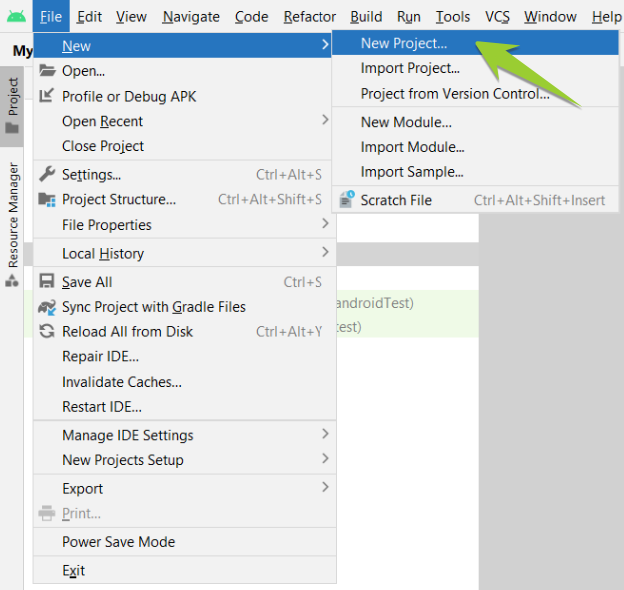
Now open the ‘Android Studio’ and create a new project.
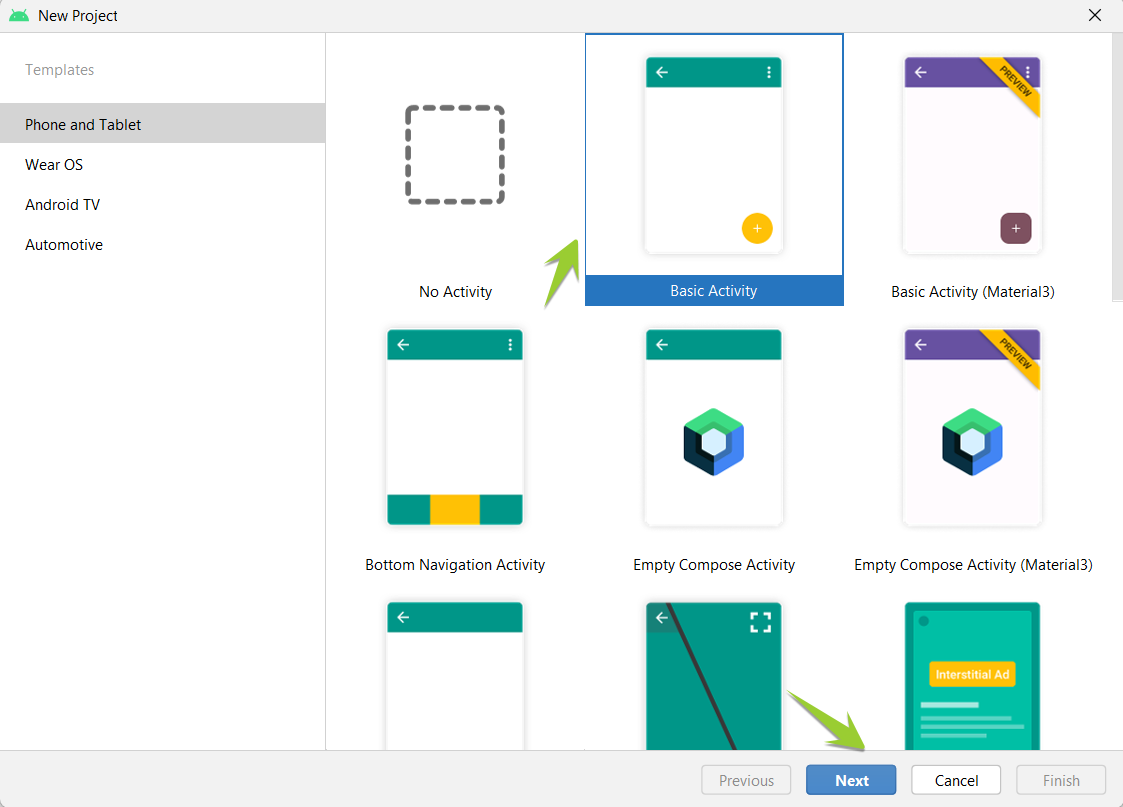
Select the ‘Basic Activity’ option here and click the ‘Next’ button.
Assign the name to your project and click on the ‘Finish’ button to complete the creation process.

Android Project has been created.
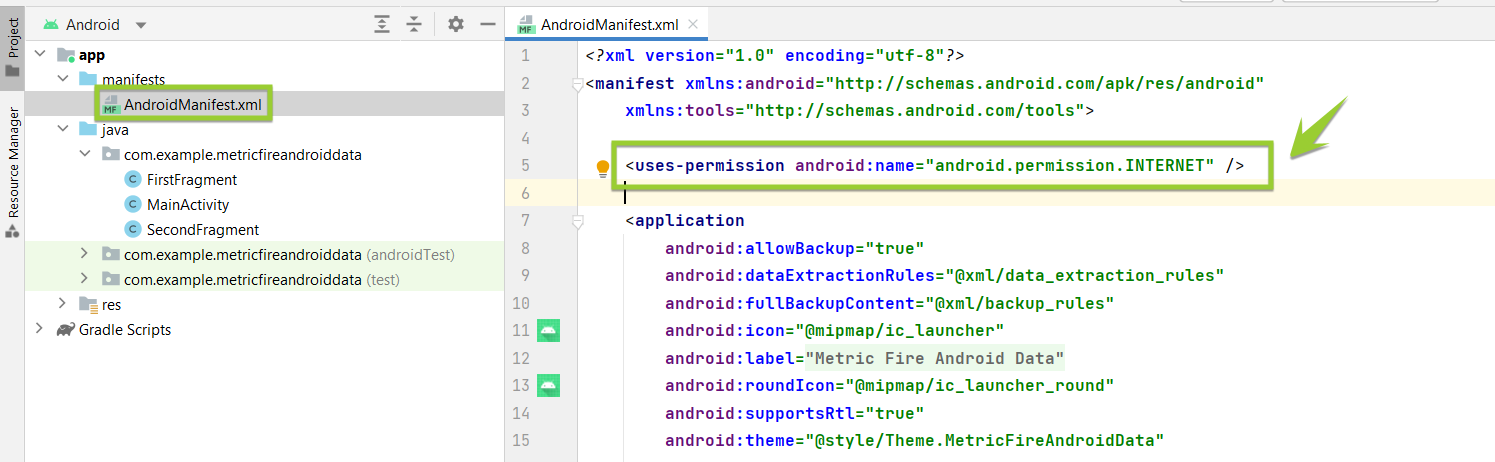
Open the ‘AndroidManifest.xml’ file in your project and add the following line of code to allow permission to use the internet.
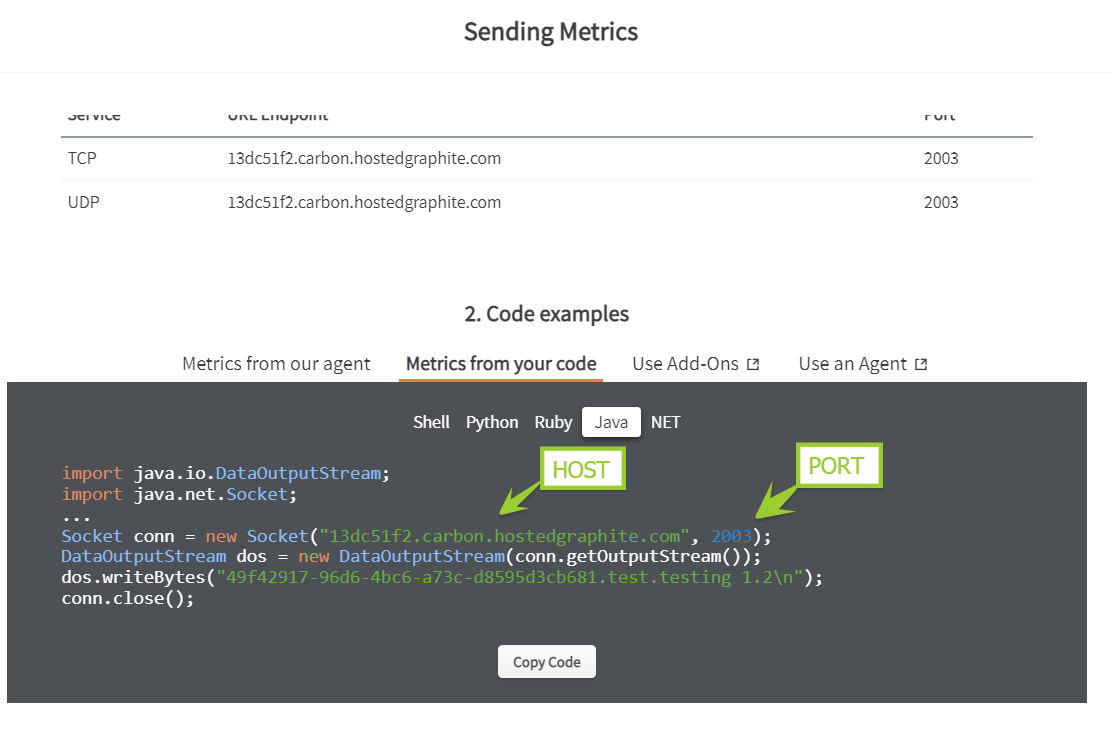
Step 3: Integrate MetricFire APIs with Android Project
Go to the MetricFire Platform, copy the API key, and press the ‘Send Metrics’ button to get the Host and Port.
Copy the Host and Port of your MetricFire account.
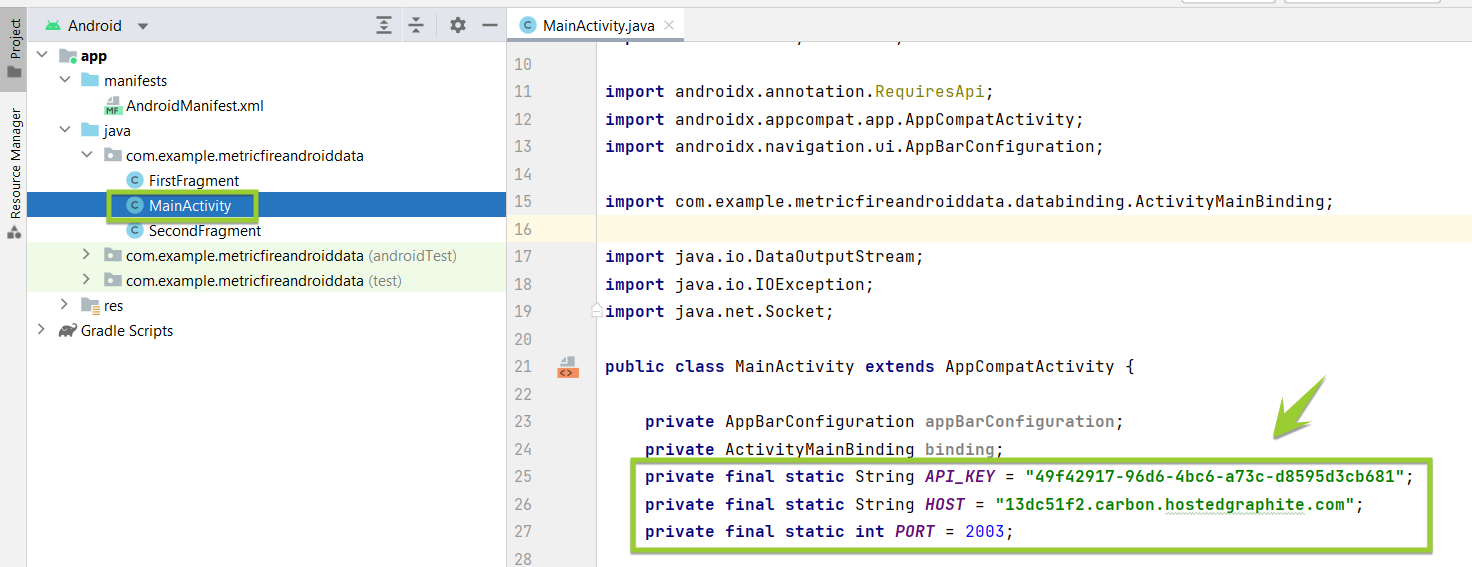
Go back to Android Project and paste the API Key, Host, and Port in the ‘MainActivity.java’ file.
Step 4: Building Code for Android Data Metrics
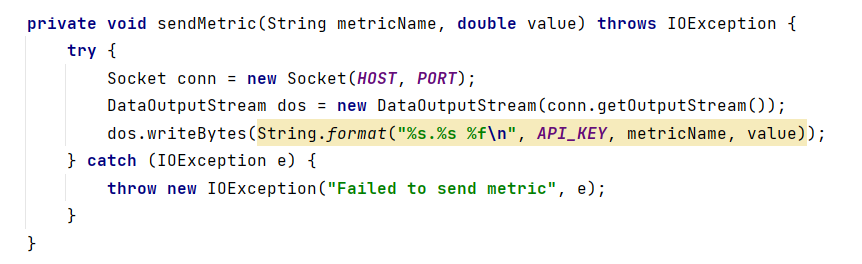
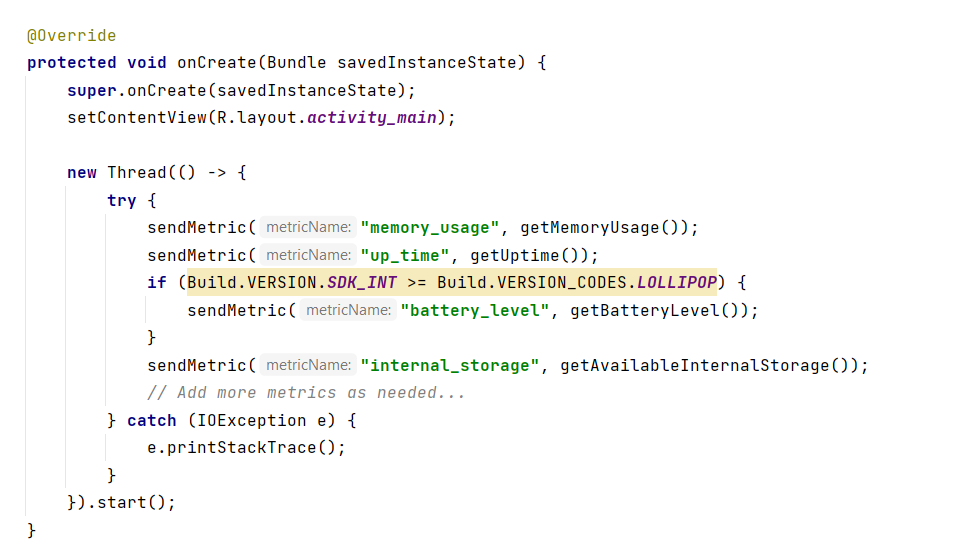
In the ‘MainActivity.java’ class, write the following code snippets:
-
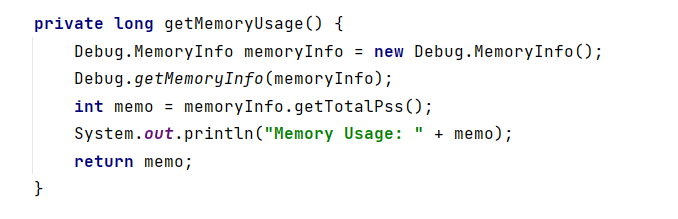
The getMemoryUsage () method returns the memory used by your app's processes.
-
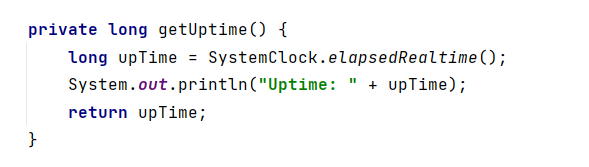
getUptime() method is used to return the time (in milliseconds) since the system was booted. This includes time spent in sleep mode.
-
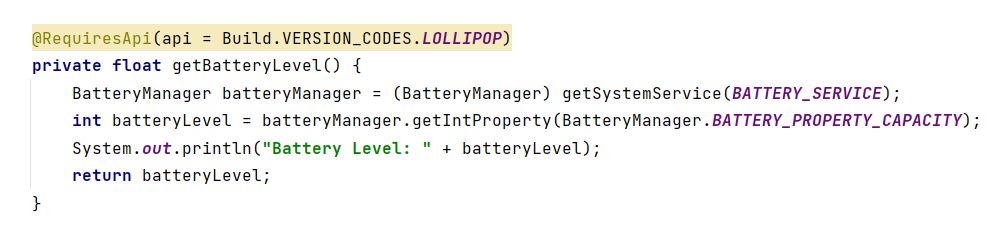
getBatteryLevel() method is used to retrieve the battery level by using the BatteryManager class.
-
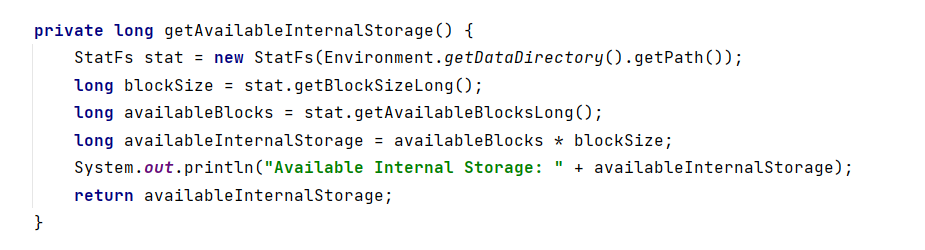
getAvailableInternalStorage() method retrieves information about the device's internal storage using the StatFs class.
-
sendMetric() method is used to send Android Data Metrics to the MetricFire.
-
onCreate() method will initiate the Android Project, run the following code snippet to print, and send the metrics.
Step 5: Send Android Data Metrics to the MetricFire
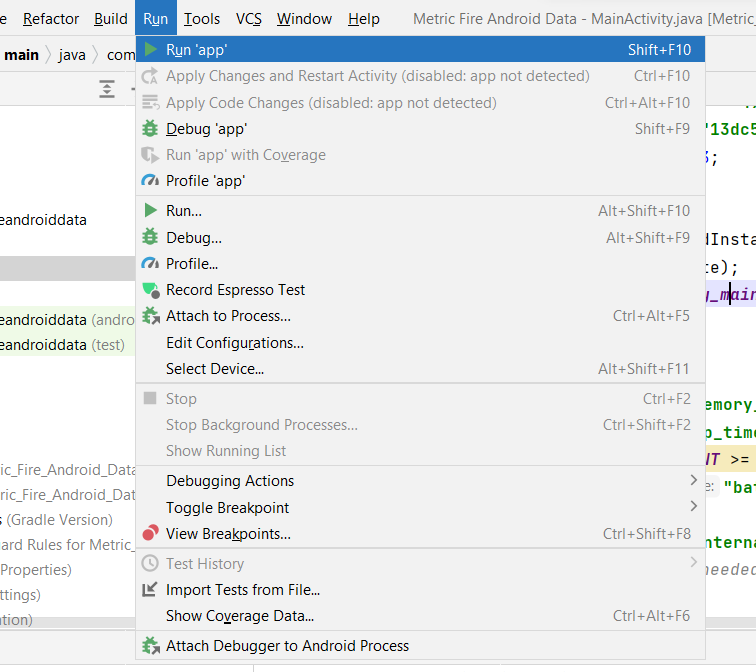
Now click on the ‘Run’ option shown below to run the Android Project.
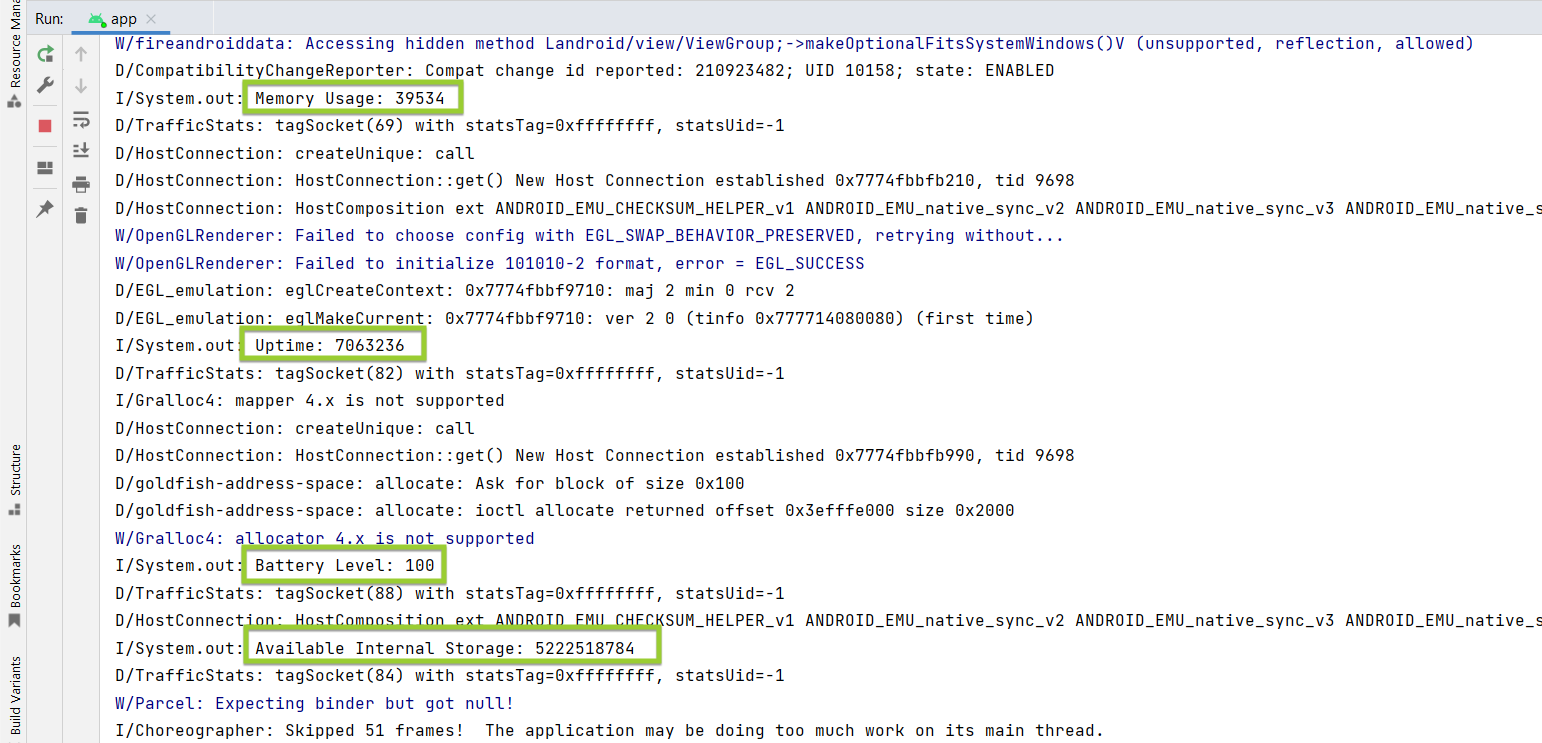
Android Project has been executed successfully. It prints your data metrics on the console and also sends this data to the MetricFire account. Save this data to verify your metrics data in the MetricFire dashboard.
Metrics have been sent successfully, and the value has been updated.
Now, follow these steps for monitoring Android data with MetricFire.
-
Click on the Dashboards and then select ‘Primary Dashboards’.
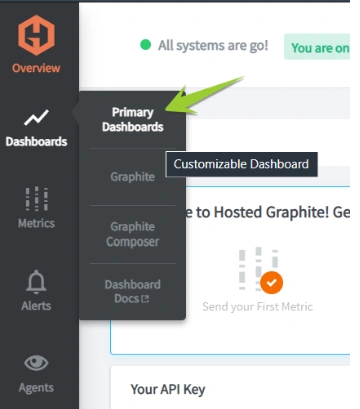
The Grafana dashboard’s platform will open.
-
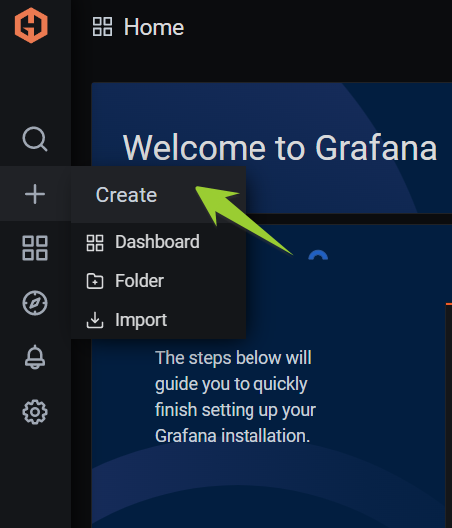
Click on the ‘Add New Panel’ to build a new dashboard.
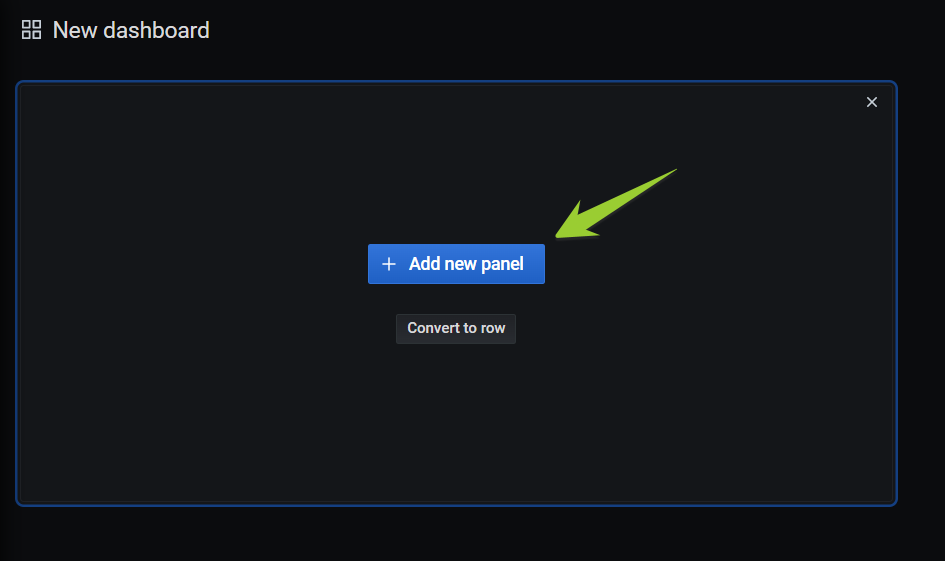
The dashboard has been initialized.
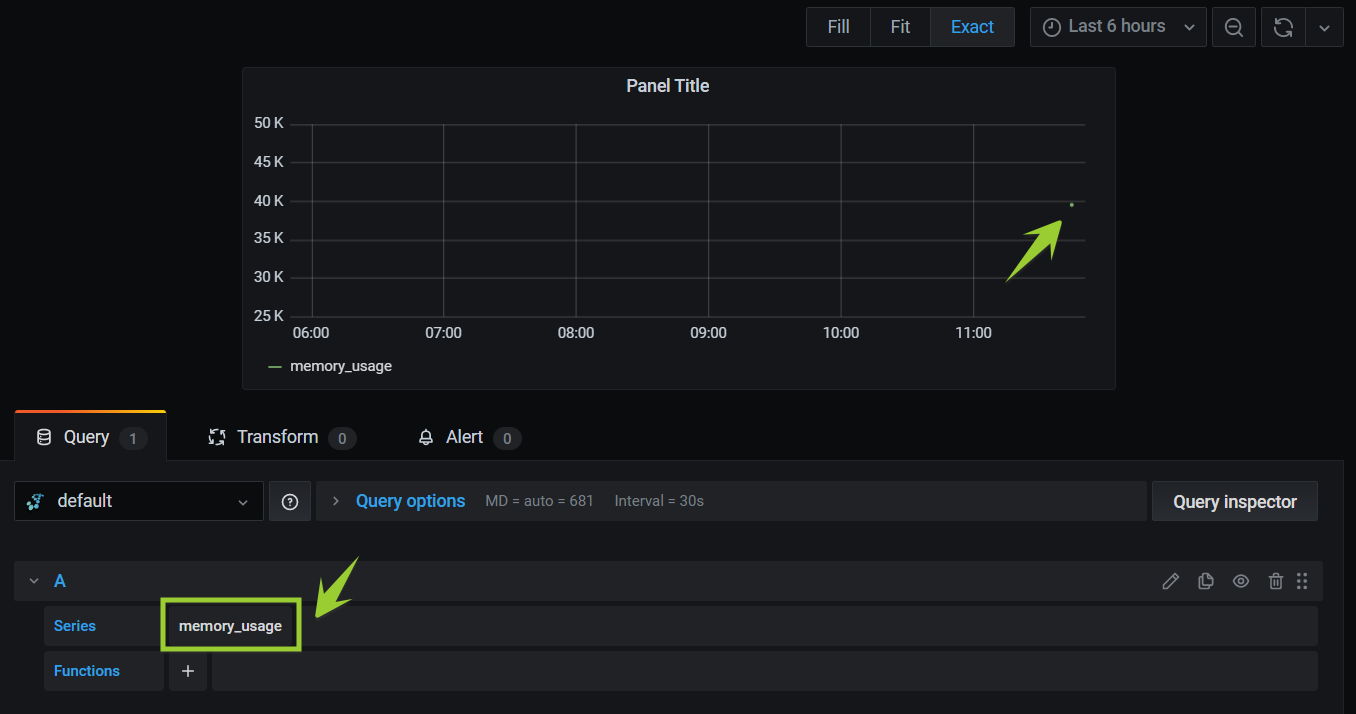
-
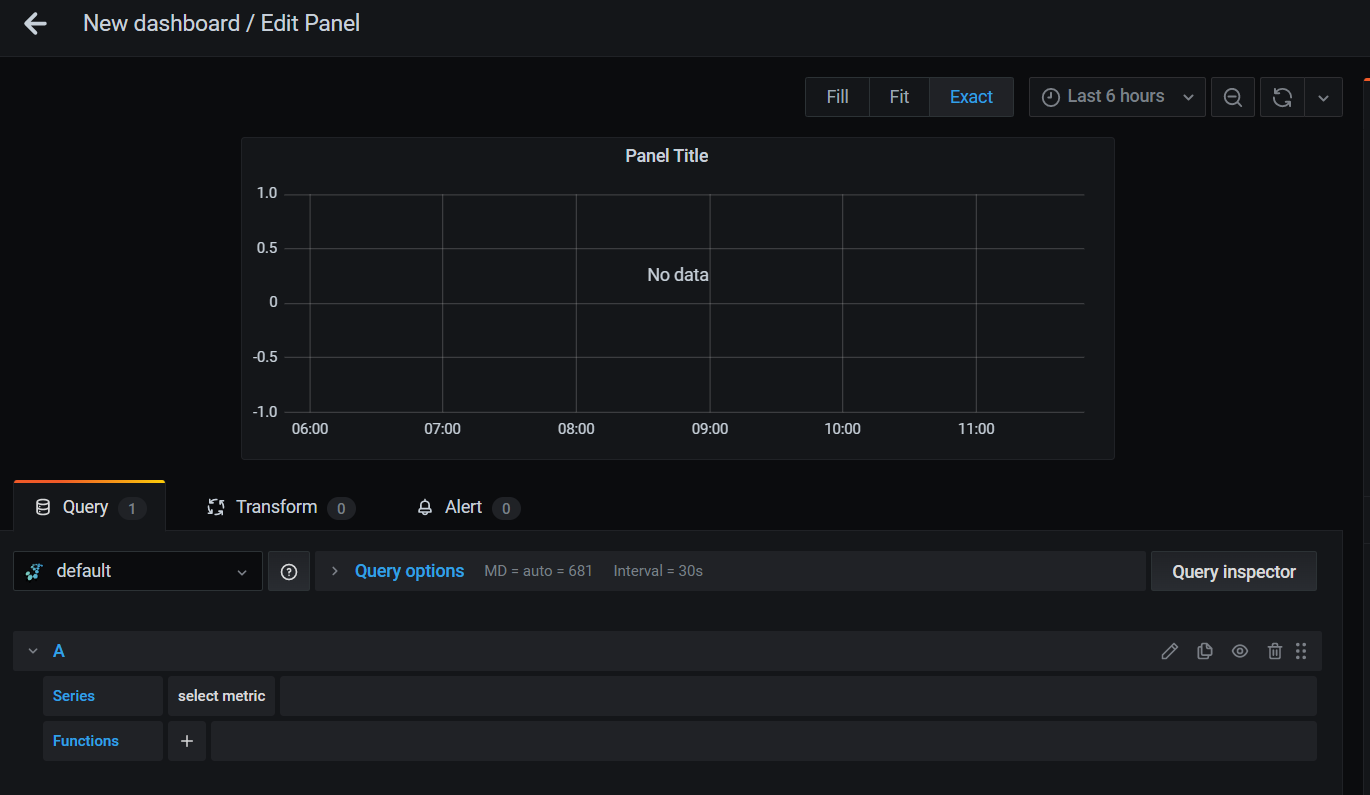
Write the name of your metric e.g., ‘memory_usage’ in the Series tab, and then the platform will reflect the data against this metric in the dashboard. During the execution of the Android Project, the same data of memory size ‘39534’ was shown in the console, and here the dot represents the same data.
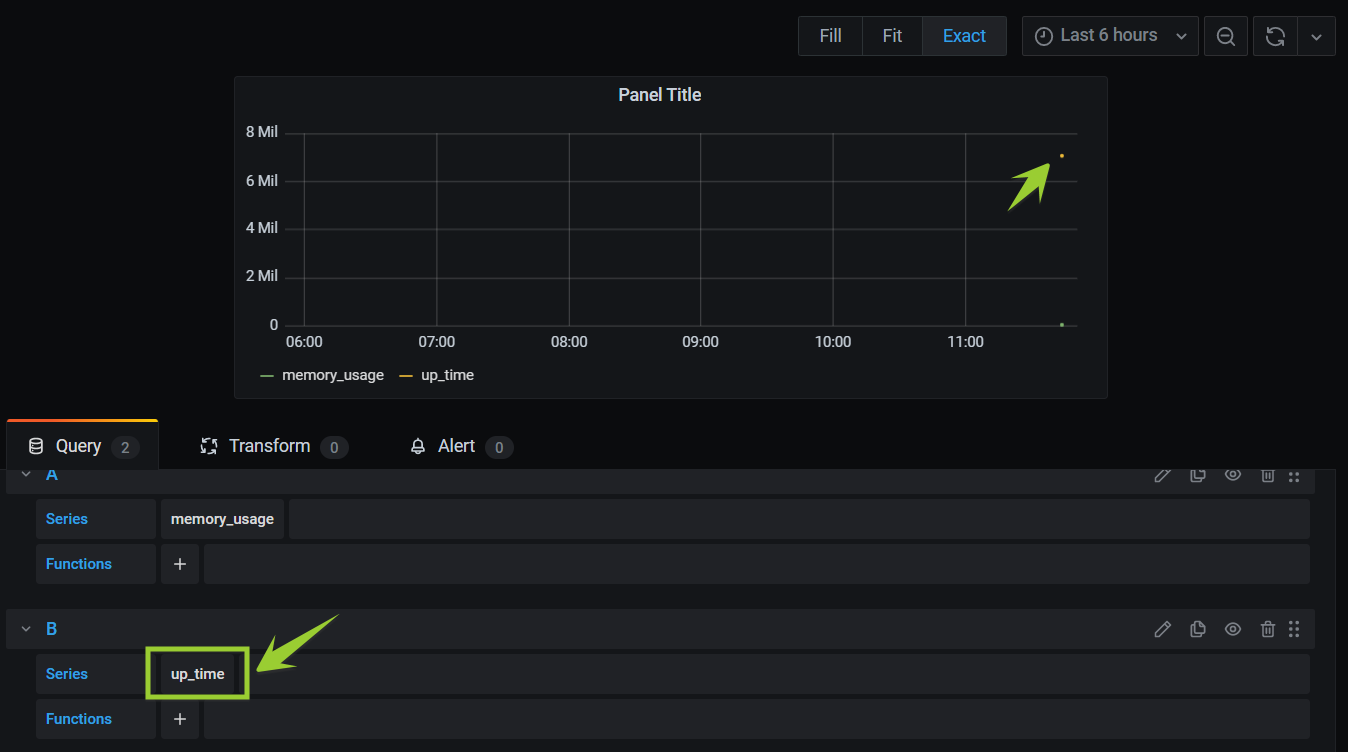
The following dot shows the data value of the ‘up_time’ metric.
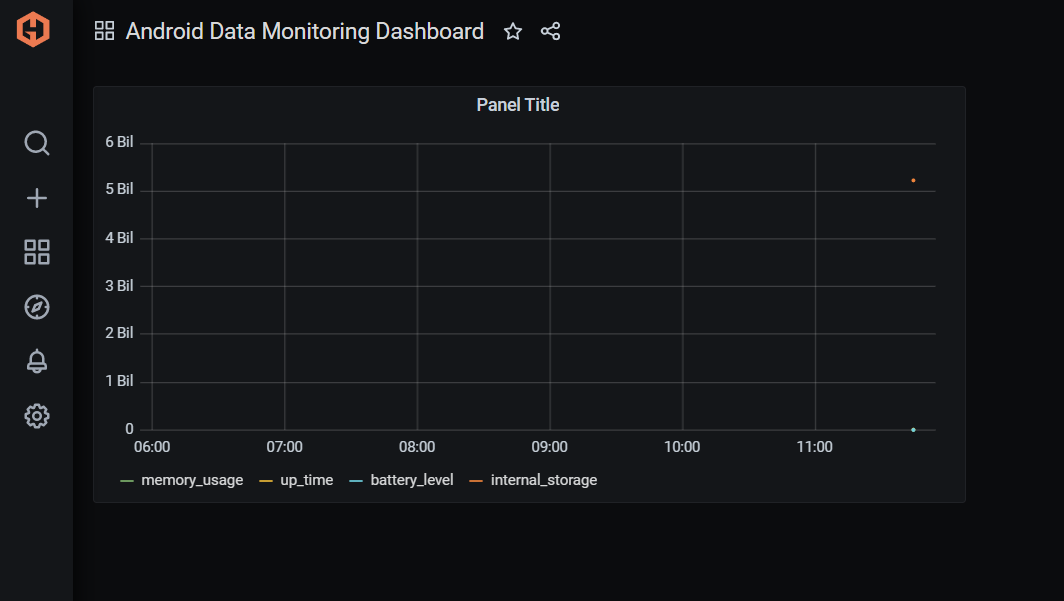
The following graph shows the data for all 4 metrics. Similarly, users can send and add more metrics to the MetricFire platform to visualize or analyze data.

-
Assign the name to your dashboard and click on the ‘Save’ button to save this dashboard.
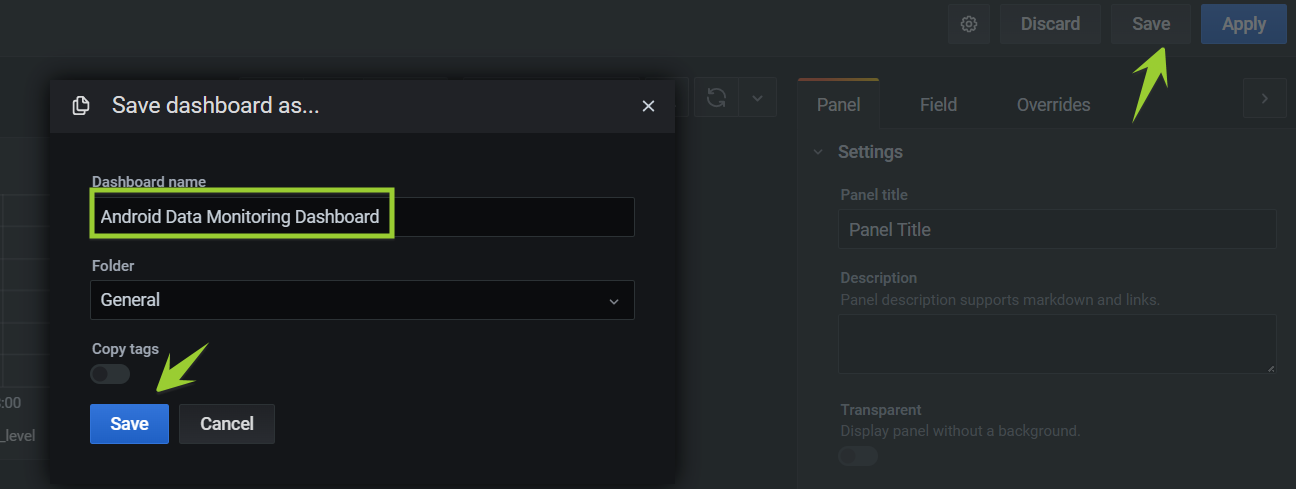
The MetricFire dashboard has been saved successfully.
Conclusion
In the continually evolving realm of mobile applications, adept Android data monitoring is key to maintaining a competitive stance. It yields valuable insights that boost not only the performance and features of the app but also enrich the overall user experience. MetricFire stands out as a comprehensive answer to this requirement, offering effortless setup, real-time tracking, tailor-made dashboards, scalability, and notification functions.
These attributes streamline the process of data monitoring and analysis, delivering actionable insights for informed decision-making. Whether you're a budding startup or a large-scale enterprise, MetricFire is a tool that adjusts to your needs, ensuring investment in your app's quality and user satisfaction. By utilizing MetricFire for Android data monitoring, you enable your app to continuously enhance, adapt, and offer superior service to your users, ensuring your app doesn't just endure but excels in the fast-paced digital environment.
How MetricFire Can Help?
MetricFire simplifies Android data monitoring with a comprehensive suite of tools, allowing developers and businesses to track metrics such as performance, user behavior, and security features. Its real-time data access and scalability make it ideal for growing startups and established enterprises. As the app scales, so do MetricFire's capabilities, providing consistent and effective monitoring.
Additionally, MetricFire's customizable dashboards cater to specific user needs, enhancing data comprehension and decision-making. Its alert system notifies users of potential issues based on predefined thresholds or unusual activity. Overall, MetricFire's robust, customizable, and scalable platform facilitates informed decision-making, ensuring efficient problem resolution and aiding in creating superior Android applications.


