

Table of Contents
Great systems are not just built. They are monitored.
MetricFire runs Graphite and Grafana as a fully managed service for growing engineering teams, taking care of storage, scaling, and version updates so your team doesn't have to. Plans start at $19/month, billed per metric namespace rather than per host, and include engineer-staffed support. Integrations work natively with Heroku, AWS, Azure, and GCP, and data is stored with 3× redundancy in SOC2- and ISO:27001-certified data centres.
Introduction
In today's digital age, the complexity and scope of dynamic system architectures are expanding at an unprecedented rate. As a result, IT teams find themselves grappling with the challenge of monitoring and addressing conditions across multi-cloud environments. With the increasing complexities, IT operations, DevOps, and SRE teams are searching for enhanced observability within these multifaceted computing environments.
This article will explore observability, its costs, how much to spend on these costs, how best to select observability tools, and how tools like MetricFire, which offers monitoring solutions, can help. MetricFire can also help businesses gain deep insights into application performance and system health.
If you would like to learn more about it, please book a demo with us, or sign on to the free trial today.
What Is Observability and Why Is It So Expensive?
Observability refers to the capability to identify the current state of a system through the logs, metrics, and traces it produces. This process depends on information derived from the endpoint and service instrumentation within multi-cloud computing environments.
The essence of observability lies in understanding the interactions across these diverse environments to promptly detect and rectify issues, ensuring system efficiency and customer satisfaction.
However, the journey to achieving comprehensive observability comes at a steep price. The surge in observability cost isn't attributed to a singular reason but a confluence of factors:
Data Saturation
Observability data can be overwhelming for organizations. Business enterprises deploy on average 207 applications, generating enormous amounts of data. With the shift to cloud-native architectures, the number of components and services that need monitoring has increased considerably, hence resulting in increased observability cost.
Inadequate Data Collection
A traditional observability tool, which relies on a data collector based on agents, often consumes a significant amount of CPU and memory, resulting in a significant increase in infrastructure costs.
Complicated Price Models
A major disadvantage of most observability tools is their complex observability cost structures, which vary depending on the amount of data collected, the number of agents, and the number of users.
Organizational Inertia:
As a result of the fact that observability solutions have traditionally been designed for developers rather than application owners, there is a potential mismatch between what is monitored and what is needed. The unpredictable nature of data volume, dependent on application demand, is therefore responsible for the fluctuating observability cost that result from unpredictability.
The next step is determining how much you can afford to spend on observability and where your efforts should be directed.
How Much To Spend on Observability
Observables can be difficult to navigate, especially when budgeting. In order to stay financially and operationally healthy, it is crucial to understand the cost of observability services.
Listed below are some guidelines to help you navigate these challenges.
Budget Allocation for Observability
-
General Rule: Allocate about 20-30% of your infrastructure costs to observability.
-
Exceptions: Some businesses might spend more or less, but spending less than 20% could mean sacrificing engineering time and service quality.
Consider Real-World Scenarios
-
Additional Costs: Beyond the basic fees, consider the costs of additional hardware or personnel needed to operate and maintain the observability infrastructure.
-
Evaluate Effectiveness: Ensure the observability solution adequately meets your needs and doesn’t require excessive additional investment to be functional.
Expense of Engineering
-
Recruitment and Retention: Good engineers are costly and hard to find. Ensure your observability solutions help rather than hinder their work.
-
Tool Quality: High-quality tools can help retain top engineering talent and keep focus on core business issues.
Understanding the Hidden Costs
-
Time Value: Often, we underestimate the value of our time. Setting up observability might seem quick, but the maintenance and context switching have their own costs.
-
Opportunity Costs: Time spent on setting up and maintaining observability tools is time not spent on creating business value.
Therefore, strive to maintain observability cost at 20-30% of total expenditure for optimal operational efficiency. Moreover, your observability stack should align with your specific needs, budget, and team capabilities.
Best Practices When Choosing an Affordable Solution
When selecting an observability tool, affordability and efficiency are paramount. Below are tailored best practices to guide you in making a cost-effective decision while ensuring optimal functionality:
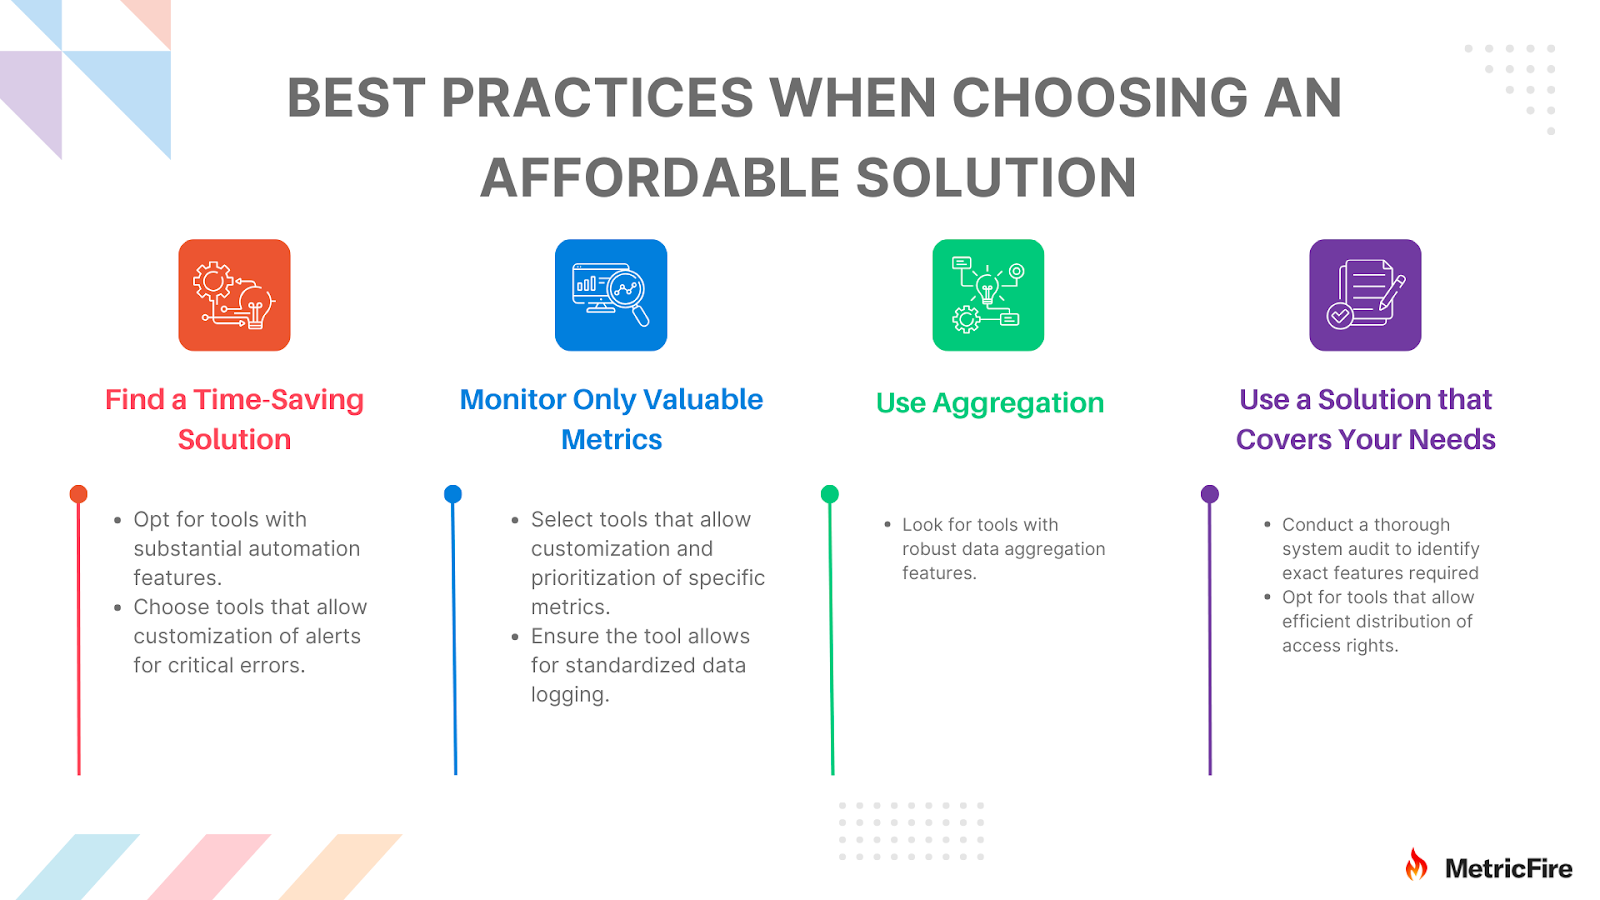
Find a Time-Saving Solution
Time is money, and selecting an observability tool that offers substantial automation features is crucial. Automated observability tools streamline various processes, reducing the time and human resources needed to manage and analyze your systems. This efficiency not only ensures optimal system monitoring and management but also translates to significant cost savings in the long term.
Moreover, efficient alert management is crucial for effective system management. Choose an observability tool that enables customization of alerts for critical errors. This feature ensures that your team is not overwhelmed by minor, non-critical alerts, allowing them to focus their efforts on addressing significant issues. This focus translates to enhanced efficiency and substantial labor cost savings.
Monitor Only Valuable Metrics
Monitoring only valuable metrics is another essential practice in choosing an affordable observability tool. Opt for tools that allow customization and prioritization of specific metrics. This focus ensures that you are not bogged down by excessive, irrelevant data, thereby saving costs related to data processing and storage and ensuring that your team’s efforts are directed toward genuinely impactful data analysis.
Standardized data logging is essential for efficient and effective observability. Ensure that the observability tool you select allows for a consistent and standardized data logging format. This standardization ensures that you only deal with relevant and structured data, enhancing efficiency and reducing the costs of handling chaotic and irrelevant data.
Use Aggregation
Data aggregation is a powerful feature to look for in an observability tool. Tools that provide robust data aggregation features allow you to minimize the volume of data you handle, effectively lowering both storage and processing costs. This functionality ensures that you can easily identify and analyze trends and patterns, enhancing your system’s management efficiency while keeping costs low.
Use a Solution that Covers Your Needs
Understanding your specific needs is fundamental when choosing an observability tool. Conducting a thorough system audit allows you to identify the exact features you require from an observability tool. This practice ensures that you only pay for functionalities that are essential to your operations, avoiding the extra cost of unnecessary features and ensuring that the tool you select aligns perfectly with your system requirements.
Moreover, efficient distribution of access rights is essential for swift problem resolution. Opt for an observability tool that allows for seamless and efficient distribution of access rights, ensuring that the right individuals have timely access to relevant data. This efficiency avoids costs associated with delays in problem resolution, ensuring that issues are promptly addressed and avoiding further complications and costs.
Observability with Metric Fire:
For organizations seeking a robust observability solution, MetricFire emerges as a frontrunner. By integrating MetricFire, businesses can gain profound insights into application performance and system health.
Incorporating MetricFire into your observability stack enhances your ability to gain detailed insights into application performance and system health. This platform is pivotal for efficient monitoring and analysis of vital metrics related to observability. Let's check out how you can measure observability metrics with Metricfire:
Observability Metrics Collection with Hosted Graphite
Hosted Graphite is an essential tool within the MetricFire suite for aggregating and analyzing observability metrics from a multitude of sources. It’s designed to collect any metric transmitted via HTTP or TCP protocol and custom code from diverse code bases, ensuring a broad spectrum of observability insights.
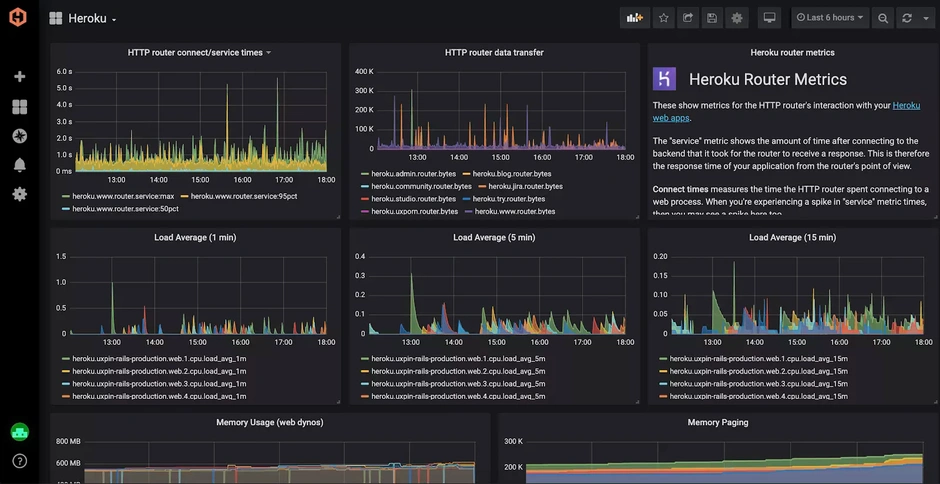
The built-in dashboarding capabilities of Hosted Graphite further augment the ease of visualizing data trends and multi-source data, enhancing your observability efforts.
If you would like to learn more about it, please book a demo with us, or sign on to the free trial today.
Enhancing Observability Dashboards with Grafana-as-a-Service
Grafana-as-a-service is another managed service by MetricFire that bolsters your observability initiatives. It allows for the rapid creation of detailed dashboards for your metrics data, enhancing your ability to observe and analyze system and application performance.
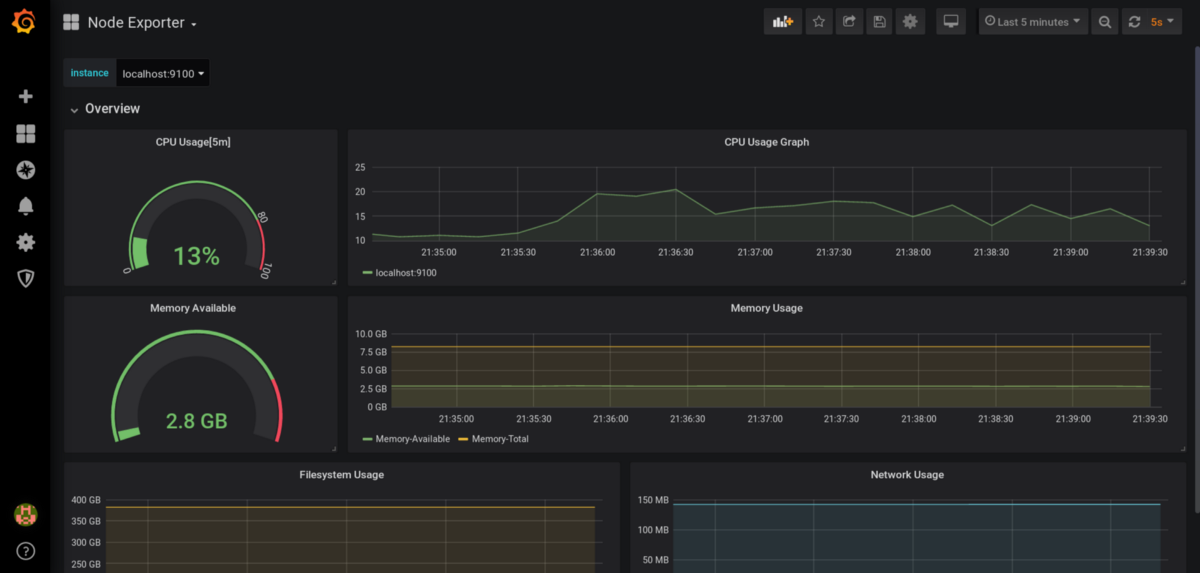
The service’s intuitive interface and customization options ensure that your observability dashboards are detailed, clear, and tailored to your specific needs.
MetricFire’s Integration in Observability Tools
The ease of integrating MetricFire with popular observability tools, such as StatsD, streamlines the enhancement of your existing observability stack.
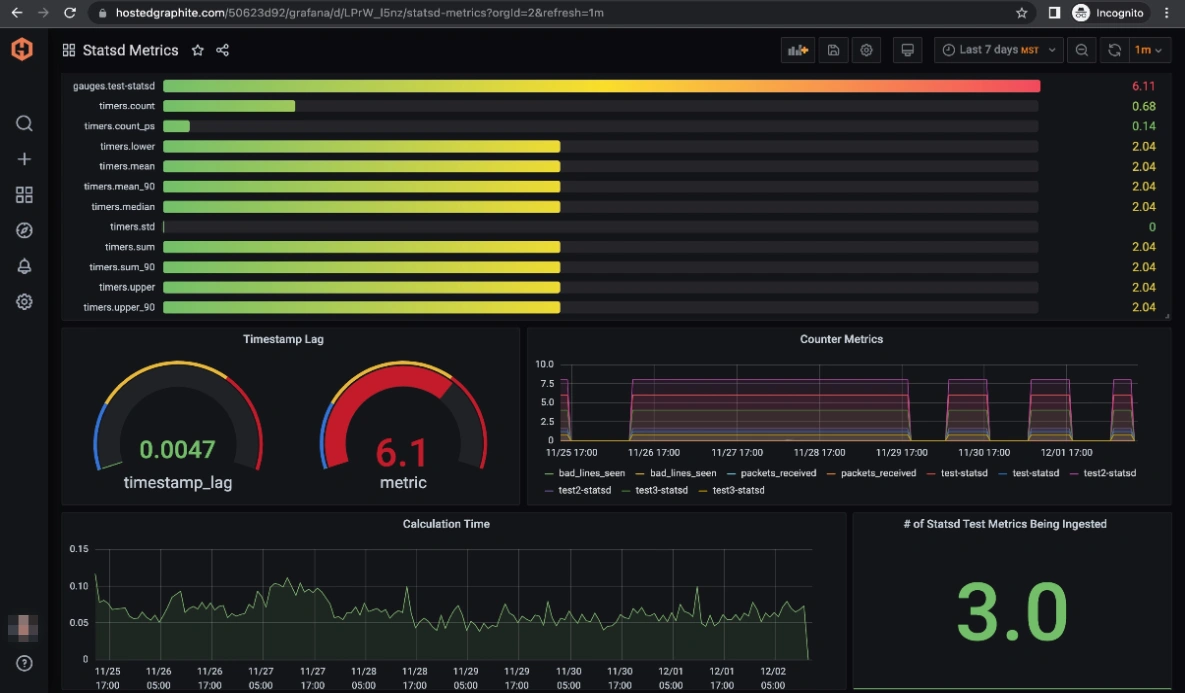
This integration ensures that all your current metrics related to observability can be easily collected, analyzed, and utilized for system improvement without the need for additional configuration or setup.
To augment your observability efforts, MetricFire also provides advanced alerting capabilities. These allow teams to set up alerts based on specific observability metrics and conditions, ensuring immediate notification and action can be taken based on real-time observability insights.
Conclusion
In the world of observability, keeping track of complex system states and interactions is crucial. The path to complete observability is essential but filled with its own hurdles, such as managing rising costs and handling extensive data effectively. Having the right tools and strategies is key to overcoming these obstacles, ensuring cost efficiency, improved system performance and customer satisfaction.
This is where MetricFire stands out. It offers a clear, affordable, and efficient solution for managing all aspects of observability. With tools like Hosted Graphite and Grafana-as-a-Service, and Alert management, MetricFire provides detailed insights into application performance and system health, making it easy to see how your systems and applications are performing.
If you would like to learn more about it, please book a demo with us or sign up for the free trial today.

