

Table of Contents
Great systems are not just built. They are monitored.
MetricFire runs Graphite and Grafana as a fully managed service for growing engineering teams, taking care of storage, scaling, and version updates so your team doesn't have to. Plans start at $19/month, billed per metric namespace rather than per host, and include engineer-staffed support. Integrations work natively with Heroku, AWS, Azure, and GCP, and data is stored with 3× redundancy in SOC2- and ISO:27001-certified data centres.
Introduction
Monitoring your NGINX server isn’t just about avoiding downtime - it’s about keeping your app fast, efficient, and resilient. Whether it's is acting as a reverse proxy, load balancer, or API gateway, tracking key metrics like active connections, request rates, and response times helps you catch slowdowns, optimize performance, and prevent cascading failures before they impact users. Pairing NGINX with performance stats around connections, requests, and sources, gives you a full-stack view of your infrastructure, so you can tweak configs, balance loads, and stay ahead of issues.
In this article, we'll detail how to use the Telegraf agent to collect NGINX performance statistics that you can forward to a data source.
Getting Started with the Telegraf Agent
Telegraf is a plugin-driven server agent built on InfluxDB that collects and sends metrics/events from databases, systems, processes, devices, and applications. It is written in Go, compiles into a single binary with no external dependencies, and requires a minimal memory footprint. Telegraf is compatible with many operating systems and has many helpful output plugins and input plugins for collecting and forwarding a wide variety of system performance metrics.
Install Telegraf (Linux/Redhat)
/etc/telegraf/wget https://dl.influxdata.com/telegraf/releases/telegraf_1.30.0-1_amd64.deb
sudo dpkg -i telegraf_1.30.0-1_amd64.deb
RedHat/CentOS
wget https://dl.influxdata.com/telegraf/releases/telegraf-1.30.0-1.x86_64.rpm
sudo yum localinstall telegraf-1.30.0-1.x86_64.rpm
Configure an Output
You can configure Telegraf to output to various sources, such as Kafka, Graphite, InfluxDB, Prometheus, SQL, NoSQL, and more.
In this example, we will configure telegraf with a Graphite output. If you're not currently hosting your data source, start a 14-day free trial with Hosted Graphite by MetricFire to follow these next steps.
A Hosted Graphite account will provide the data source, offer an alerting feature, and include Hosted Grafana as a visualization tool.
To configure the Graphite output, locate the downloaded telegraf configuration file at /etc/telegraf/telegraf.conf and open it in your preferred text editor. Then, you will need to make the following changes to the file:
First, uncomment the line:
[[outputs.graphite]]
Next, uncomment and edit the server line to:
servers = ["carbon.hostedgraphite.com:2003"]
Finally, uncomment and edit the prefix line to:
prefix = "<YOUR_API_KEY>.telegraf"
Configure the Telegraf NGINX Input Plugin:
Telegraf has many input plugins that can collect a wide range of data from many popular technologies and 3rd party sources. In this example, we'll demonstrate how to connect Telegraf to a local instance of MongoDB.
All you need to do is search for the inputs. In the NGINX section in your telegraf.conf file, uncomment the [[inputs.nginx]] line, and uncomment the urls line:
[[inputs.nginx]]
   urls = ["http://localhost/server_status/"]
Save your changes, and then locate your nginx.conf file to ensure a connection can be established with telegraf.
If you have NGINX running in a Linux environment, you likely need to modify your /etc/nginx/nginx.conf file. Within the http{} directive block of the nginx.conf file, define a server{} block with the following parameters:
server {
    listen 80;
    server_name localhost;

    location / {
        stub_status on;
        allow 127.0.0.1;
        deny all;
    }
}
Check for syntax errors in the config by running nginx—t—c/etc/nginx/nginx.conf. If the output is okay, you can restart your Nginx service.
Now you can manually run Telegraf using the following command to see if there are any configuration errors in the output:
telegraf --config telegraf.conf
Telegraf will now be forwarding several metrics to your data source; this is what they will look like in the Graphite format:
telegraf.<host>.80.<server_name>.nginx.accepts
telegraf.<host>.80.<server_name>.nginx.active
telegraf.<host>.80.<server_name>.nginx.handled
telegraf.<host>.80.<server_name>.nginx.reading
telegraf.<host>.80.<server_name>.nginx.requests
telegraf.<host>.80.<server_name>.nginx.waiting
telegraf.<host>.80.<server_name>.nginx.writing
The official GitHub repository contains additional configuration options and a complete list of metrics from the Nginx plugin.
Additionally, you can use the ProcStat input plugin to collect more performance metrics for your Nginx instance. For more details, see our article Monitoring Any Running Process with the Telegraf Agent.
Nginx Plus API Plugin
Telegraf also offers a plugin that returns valuable metrics if you use a Nginx Plus server.
If you want to test this for yourself, you can start a free trial for a Nginx Plus server and follow their documentation to set up and install the required repo/keys.
Modify your nginx.conf file (/etc/nginx) to allow metric collection from telegraf. Configure a similar server code block within the HTTP code block (default port is 80):
server {
  listen 80;

  location /api {
    api write=on;
    allow 127.0.0.1;
    deny all;
  }
}
Update your telegraf.conf file to connect to the nginx_plus_api:
[[inputs.nginx_plus_api]]
  urls = ["http://localhost/api:80"]
Now run telegraf to look for errors in the output:
telegraf --config telegraf.conf
If there's an error, check to make sure no other processes are using port 80, and modify the port in your telegraf/nginx.conf files if needed:
grep -r "listen" /etc/nginx/
You can also confirm a successful connection to the /api/ endpoint:
curl -i http://localhost:80/api/
See a list of possible metrics and more configuration details for the nginx_plus_api plugin in the official GitHub repository.
NGINX 502 Bad Gateway: PHP-FPM
This section is somewhat related and included here for your convenience! A 502 Bad Gateway error in NGINX, especially when paired with PHP-FPM, usually means that NGINX is trying to pass a request to PHP-FPM, but something is breaking the connection. This could be due to PHP-FPM crashing, misconfigured socket paths, incorrect upstream settings, or resource limits being hit. This is a somewhat common error, but when this happens, users might see intermittent or complete failures when accessing your site - making quick troubleshooting essential.
Check out our handy article HERE, that will help you understand and get to the bottom of this error. Spoiler alert, you're probably going to want to check your log file at: /var/log/nginx/error.log
Use Hosted Graphite by MetricFire to Create Custom Dashboards and Alerts
MetricFire is a monitoring platform that enables you to gather, visualize, and analyze metrics and data from servers, databases, networks, devices, and applications. Using MetricFire, you can effortlessly identify problems and optimize resources within your infrastructure. Hosted Graphite by MetricFire removes the burden of self-hosting your monitoring solution, allowing you more time and freedom to work on your most important tasks.
Once you have signed up for a Hosted Graphite account and used the above steps to configure your server with the Telegraf Agent, metrics will be forwarded, timestamped, and aggregated into the Hosted Graphite backend.
- Metrics will be sent and stored in the Graphite format of metric.name.path <numeric-value> <unix-timestamp>
- The dot notation format provides a tree-like data structure and makes it efficient to query
- Metrics are stored in your Hosted Graphite account for two years, and you can use them to create custom Alerts and Grafana dashboards.
Build Dashboards in Hosted Graphite's Hosted Grafana
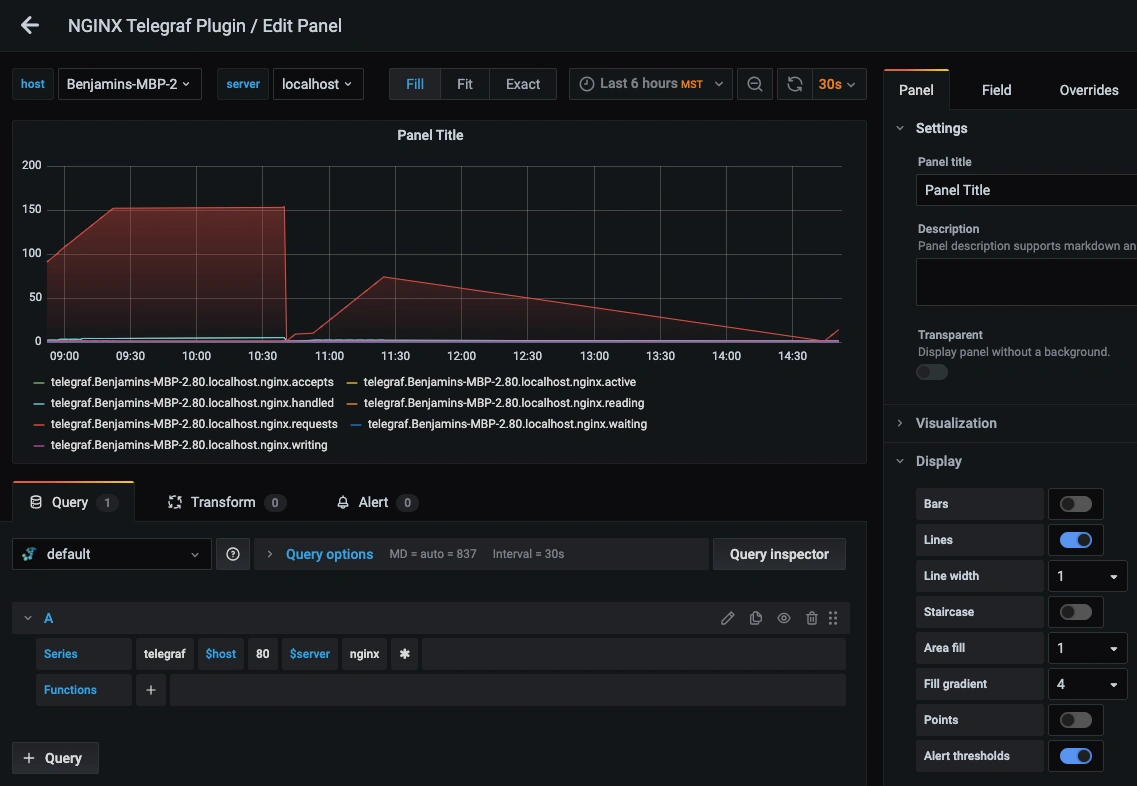
In the Hosted Graphite UI, navigate to Dashboards and select + New Dashboard to create a new visualization.
Then go into Edit mode and use the Query UI to select a graphite metric path (the default data source will be the HostedGraphite backend if you are accessing Grafana via your HG account).
The HG datasource also supports wildcard (*) searching to grab all metrics that match a specified path.
Then you can use the query UI to select a graphite metric path (the default data source will be the hosted graphite backend if you are accessing Grafana through your Hosted Graphite account):
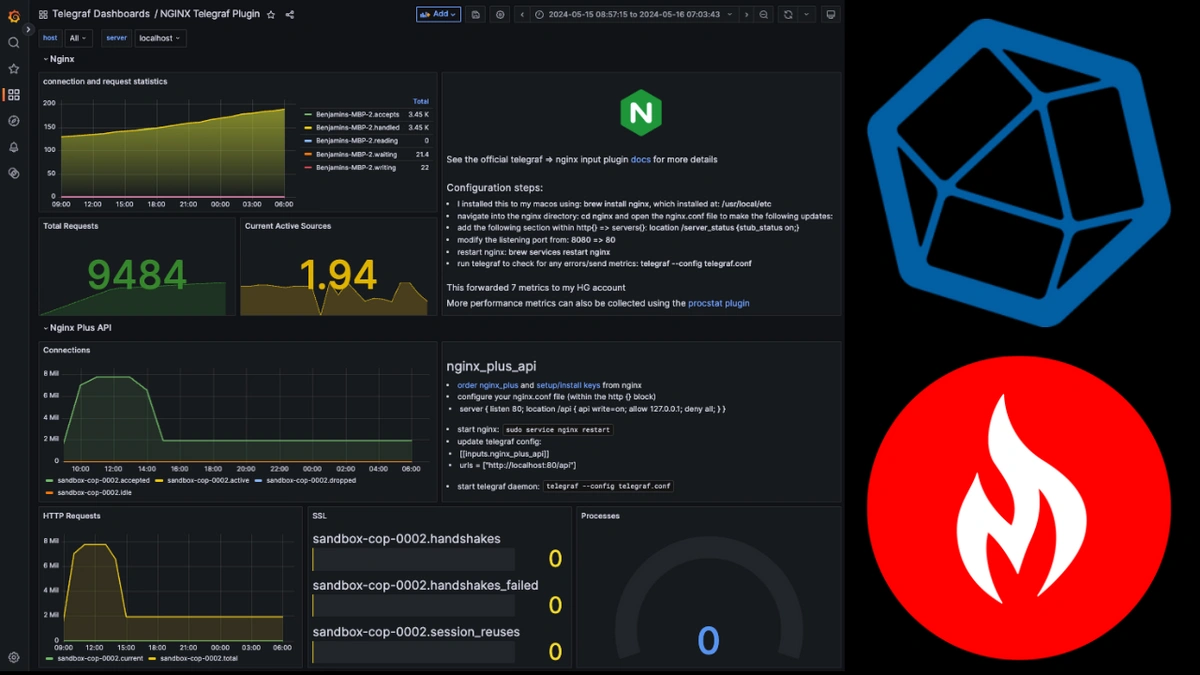
Here's a dashboard example of both NGINX and NGINX Plus metrics returned by Telegraf:
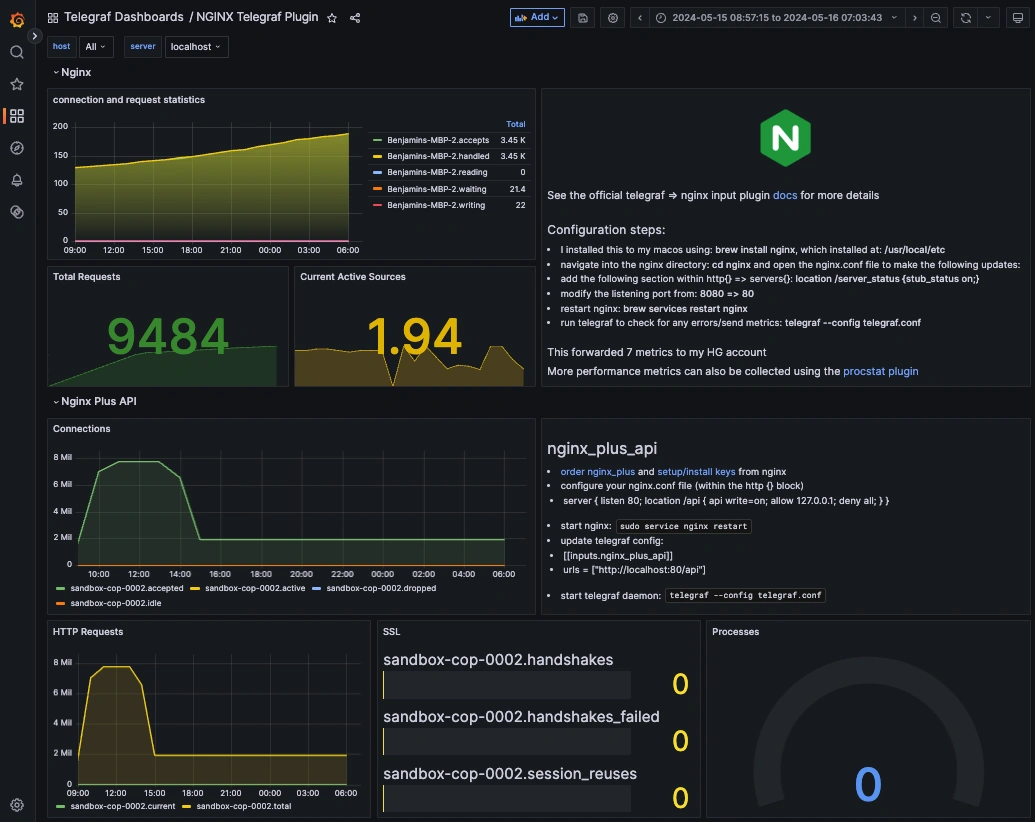
Grafana has many additional options to apply different visualizations, modify the display, set units of measurement, and some more advanced features like configuring dashboard variables (e.g: $host, $server, $env) and event annotations. See the Hosted Graphite dashboard docs for more details.
Creating Graphite Alerts
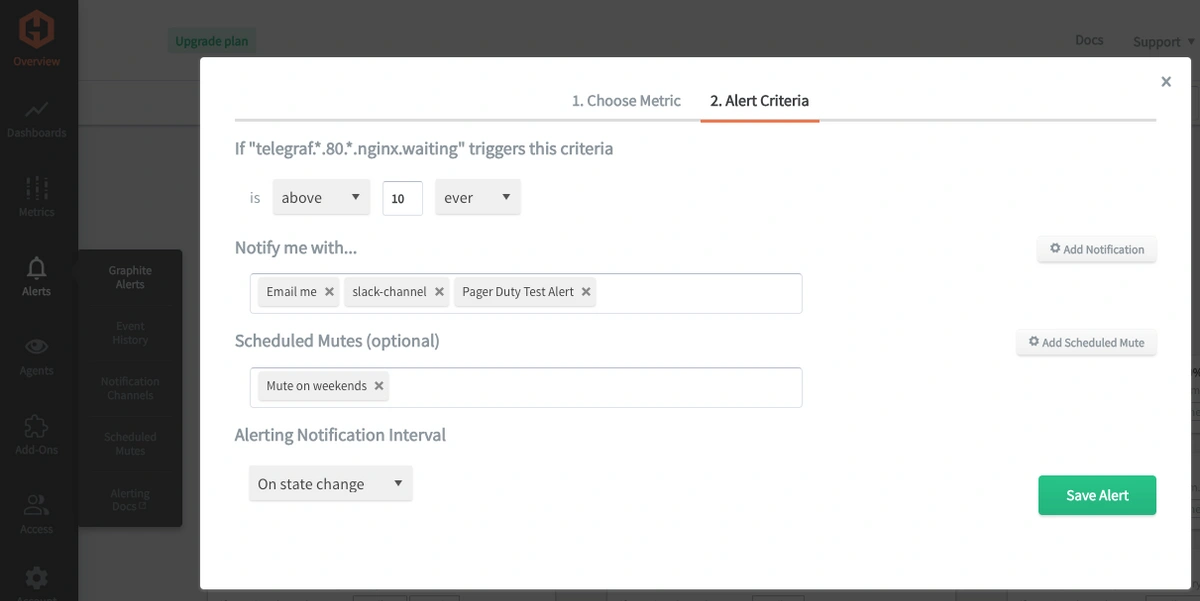
In the Hosted Graphite UI, navigate to Alerts => Graphite Alerts to create a new alert. Name the alert, add a query to the alerting metric field, and add a description of what this alert is:
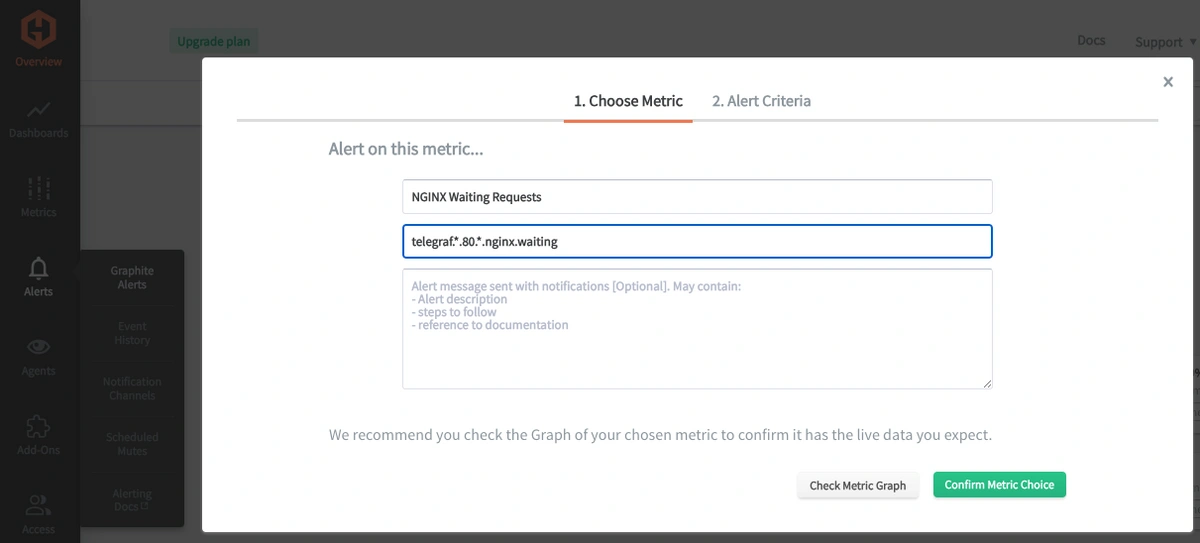
Then, select the Alert Criteria tab to set a threshold and select a notification channel. The default notification channel is the email you used to sign up for the Hosted Graphite account. Still, you can easily configure channels for Slack, PagerDuty, Microsoft Teams, OpsGenie, custom webhooks and more. See the Hosted Graphite docs for more details on notification channels:
Conclusion
Monitoring your NGINX instance is essential for ensuring seamless operations, maintaining security, enhancing user experiences, meeting compliance standards, and enabling scalability, ultimately contributing to your business's overall success and efficiency.
Web server performance monitoring provides valuable data, and tools like dashboards and alerts will complement this data by providing real-time visualization, proactive identification of issues, historical trend analysis, and facilitating informed decision-making. These are all essential for maintaining a robust and efficient infrastructure.
Sign up for the free trial and experiment with monitoring your NGINX instances today. You can also book a demo and talk to the MetricFire team directly about your monitoring needs.


