
Table of Contents
Great systems are not just built. They are monitored.
MetricFire runs Graphite and Grafana as a fully managed service for growing engineering teams, taking care of storage, scaling, and version updates so your team doesn't have to. Plans start at $19/month, billed per metric namespace rather than per host, and include engineer-staffed support. Integrations work natively with Heroku, AWS, Azure, and GCP, and data is stored with 3× redundancy in SOC2- and ISO:27001-certified data centres.
Introduction
For a successful business, you need to introduce an effective monitoring system covering all areas of your business and infrastructure - servers, databases, services, overall traffic, and even revenue collected. The users of this monitoring system can be system administrators, software engineers, information engineers, as well as all sorts of analysts. A modern efficient monitoring system should provide services for the collection of metrics, their storage, calculations/projections, visualizations, and alerts. Finding a tool that can achieve all of these things is a pretty big challenge.
In this article, we will consider two major service providers: Prometheus and Zabbix. Both Prometheus and Zabbix are great tools for monitoring time series, where Zabbix is the older-generation tool and Prometheus is cutting edge. Both tools are open source with hosted options available.
For ease-of-use and budget-friendly solutions, MetricFire’s Hosted Graphite solution provides a great alternative to Prometheus and is the fastest way to get your infrastructure monitoring up and running in a scalable way. You can use Hosted Graphite with minimal configuration to gain in-depth insight into your environment. If you would like to learn more about it, book a demo with MetricFire or sign on to the free trial today.
Prometheus short overview
Prometheus is an open-source monitoring system providing powerful query language, storage, and visualization features for its users. It collects real-time metrics and records them in a time-series database. Prometheus provides a multidimensional data model that allows defining metrics by name and/or tags to identify them as part of a unique time series. It is written in Go and licensed under the Apache 2 License, with source code available on GitHub. As an open-source project, Prometheus has broad community support and therefore it has a range of client libraries that enable simple interaction with it. Also, Prometheus has native support from services like Docker and Kubernetes.
Zabbix short overview
Zabbix is software for monitoring numerous parameters of networks, servers, applications, virtual machines, and cloud services. It can collect metrics, detect problems, visualize, notify, and send notifications. Zabbix has a web interface providing easy interaction with all statistics, visualizations, and parameter settings. Zabbix doesn’t store data itself, but it can use a broad range of databases. Zabbix’s backend is written in C and the web frontend is in PHP.
Comparison of important points
Сollection of metrics
Prometheus
Prometheus is a tool that has a wide set of built-in functionalities, so Prometheus users don’t need to install various plugins or daemons to collect metrics. Service detection is also automatic, making things quick. Thanks to a large community, many services can send metrics in Prometheus format. If some services cannot do this, then there are many libraries that help in exporting existing metrics from third-party systems such as Prometheus metrics. These libraries are called Exporters. Just to note, popular services such as Kubernetes and Docker support Prometheus metrics.
Prometheus is developed to pull metrics periodically from the target system. It is also possible to collect metrics using the push mechanism. This may be needed in situations where collecting metrics using pull is not possible. For example, when monitoring services are protected by a firewall or monitored services are connected to the network periodically and for a short time. For this purpose, a special pushgateway component is used, which is installed separately.
Zabbix
Since Zabbix was originally developed for monitoring servers, it focuses on hosts. From the user's point of view, Zabbix is divided into two large parts: server and agents. The server is located on one machine that collects and stores statistical data, and the agents are located on those machines from which data is collected. Zabbix agents support both passive (polling) and active checks (trapping). Passive checks mean that the Zabbix server requests a value from the Zabbix agent, and the agent processes the request and returns the value to the Zabbix server. Active checks mean that the Zabbix agent requests a list of active checks from the Zabbix server and then periodically sends the results.
In cases where there is no option to install an agent, Zabbix offers basic agentless monitoring. With it, you can check the availability of network services, as well as execute remote commands.
Data storage
Prometheus
Prometheus stores data in its own Time Series Database (TSDB). Having its own TSDB, Prometheus can receive and process incomparably more metrics than many other monitoring systems. Data can even be written by Prometheus with millisecond resolution timestamps. Prometheus by itself only stores data for up to 14 days, and this complicates record keeping and forecasting with your data. For longer storage of data, you can configure remote storage.
Zabbix
Zabbix uses an external database to store data. A Zabbix database must be created during its installation. The following databases are currently supported: MySQL, PostgreSQL, Oracle, IBM DB2, and SQLite.
The difference between Prometheus and Zabbix, which must be taken into account, is that Prometheus only stores the values of time series. It is not suitable for text, logs, or event logs. If you use your Prometheus with Grafana, which is the most typical way to do it, you can easily get a workaround for Prometheus by using Grafana's Loki. Although it is better to use specialized products for logs, Zabbix can give an out-of-the-box basic functionality for storing some text values, analyzing them, and setting up triggers.
Querying
Prometheus
Prometheus provides its own functional language for querying called PromQL (Prometheus Query Language). PromQL is incredibly flexible, easy, and powerful. It can apply functions and operators to your metric queries, filter, group by labels, and use regular expressions for improved matching and filtering. The result of an expression can either be shown as a graph, viewed as tabular data in Prometheus's expression browser, or consumed by external systems via the HTTP API.
Zabbix
Zabbix is not so flexible in querying. It uses item keys to get metrics. You can see supported item keys at this link.
Visualization
Prometheus
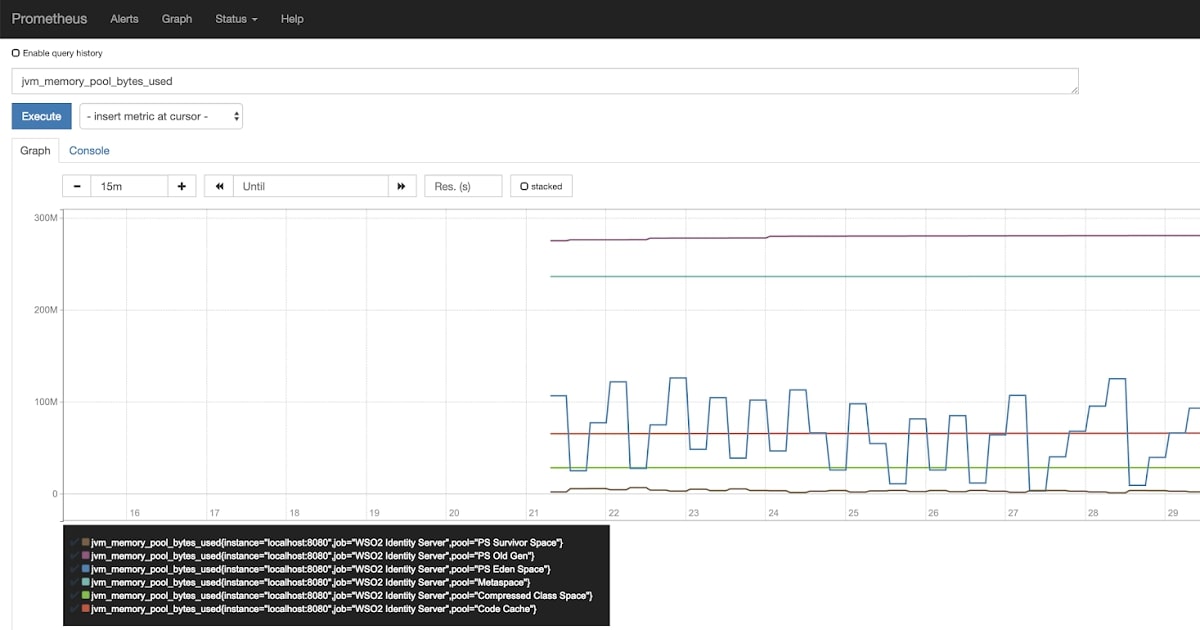
Prometheus has a simple but useful visualization tool called the Expression Browser. The Expression Browser doesn’t have the functionality of a complete monitoring panel. You can use it to perform in-depth querying into the stored metrics. The Expression Browser doesn’t display metrics that you are watching over a long period of time. It works like an exploration console, allowing you to query into your database, change a query on the fly, and find out the answers to your questions.
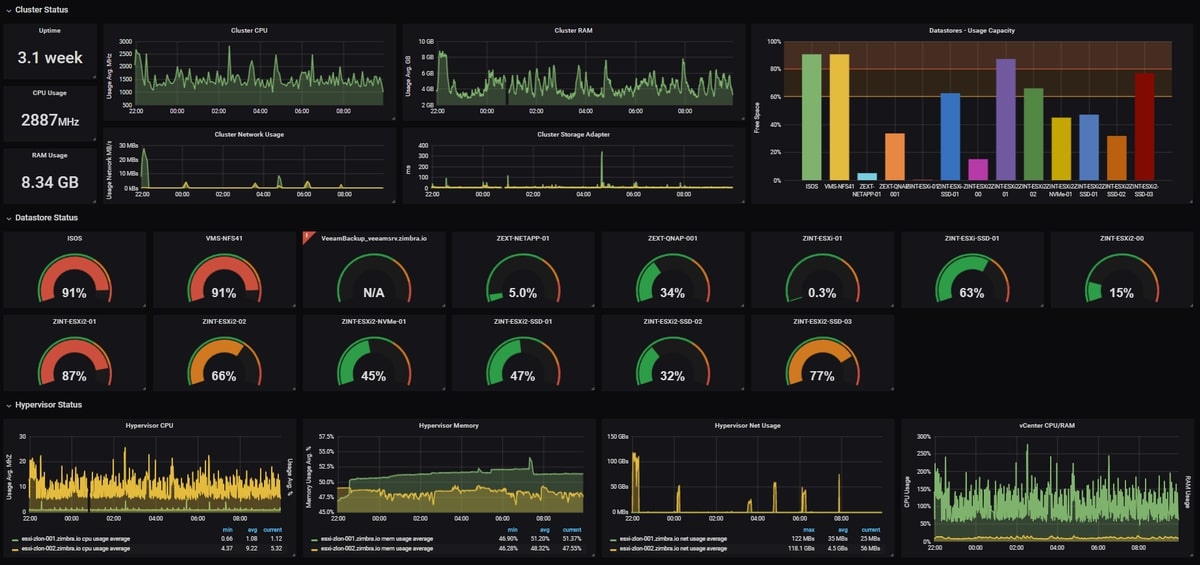
To be able to observe and analyze your charts to the fullest, you need to install a full-fledged visualization tool like Grafana. Grafana includes built-in support for Prometheus and it’s free. This allows you to take full advantage of both tools to build an efficient monitoring system.
The Prometheus Expression Browser:
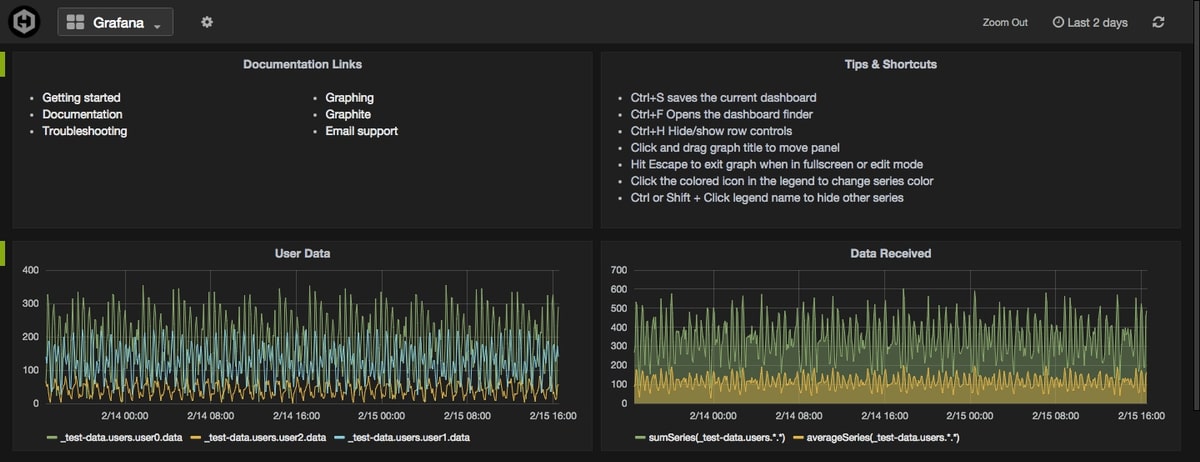
Grafana dashboards:
Zabbix
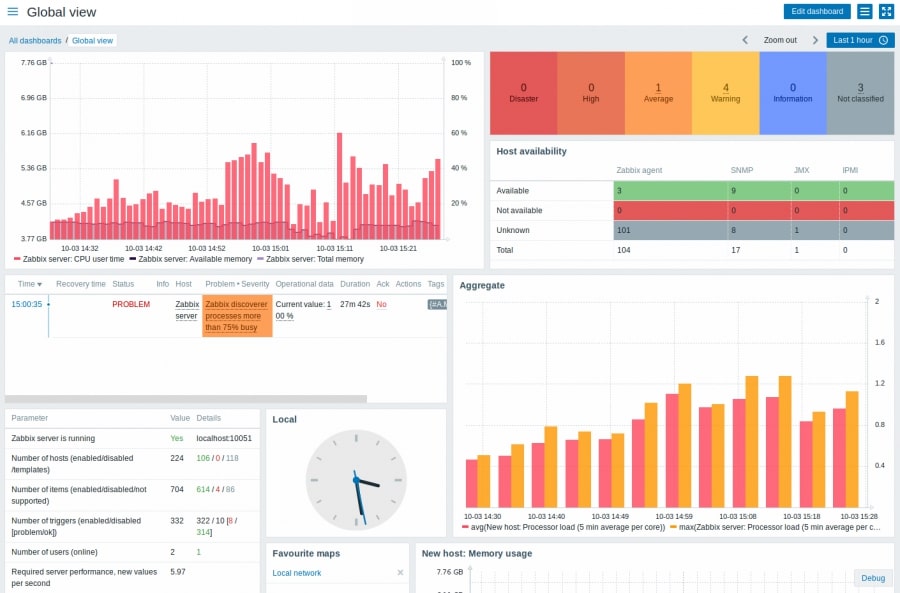
Zabbix includes a native web interface that provides a dashboard with flexible settings. This functionality is present initially and you don't have to install or configure anything else. Zabbix’s web interface provides multiple ways of presenting a visual overview of the IT environment: widget-based dashboards, graphs, network maps, slideshows, and drill-down reports. By default, the Zabbix front end provides several predefined themes. Also, users can create their own themes.
Alerting
Prometheus
To manage alerts with Prometheus you need to install Alertmanager. That’s because alerting with Prometheus is separated into two parts. First, you define alerting rules in the Prometheus server, which will send alerts to an Alertmanager.
Then Alertmanager manages those alerts by silencing, inhibitions, aggregation, and sending out notifications. Notifications can be sent via email, on-call notification systems, and chat platforms.
Alertmanager categorizes alerts of a similar nature into a single notification to avoid duplicating. This is especially useful during larger outages when many systems fail at once. Also, Alertmanager can suppress notifications for certain alerts if certain other alerts are already firing.
Zabbix
As in the case of visualization, Zabbix has a built-in alerting functionality. With Zabbix, it is possible to inform responsible personnel about the occurrence of events using many different channels and options. Zabbix alerting system allows managing events in different ways: sending messages, executing remote commands, escalating problems according to flexible user-defined Service Levels, and so on. It is also possible to customize messages based on the recipient's role by selecting which information to include, such as date, time, hostname, items' value, triggers' values, host profile, escalation history, etc.
About MetricFire
MetricFire provides a wide range of monitoring services, through their platform built on open-source Graphite and Grafana. This provides a complete monitoring stack and also solves all Prometheus' shortcomings to provide a full-fledged monitoring system. For businesses managing multiple data sources and systems, DreamFactory can complement your monitoring setup by providing governed API access to any data source, enabling seamless integration of your metrics and monitoring data across enterprise applications.
MetricFire provides long-term data storage of time series data and ensures redundancy of data by creating three copies of everything automatically. The visualization is provided by Grafana, where your data will be visualized on beautiful real-time dashboards. MetricFire can run on-premises or on the cloud and offers a whole suite of support options such as alerting design, analytics, and so on.
When to use Prometheus?
Use Prometheus when you …
- need a time-series database monitoring solution.
- need long-term storage for Prometheus metrics.
- need to use tags/labels for metrics.
- need to run alerts across different data sources.
When to use Zabbix?
Use Zabbix when you …
- need open source software with a C backend, and a PHP front end.
- you want to use MySQL, MariaDB, PostgreSQL, SQLite, Oracle, or IBM DB2 to store data.
- you have a small-scale business, with less than 1000 devices.
- need monitoring, but not necessarily great visualization/support documentation.
Pricing comparison
- Prometheus is open-source and free.
- Zabbix is open-source and free.
- Zabbix Enterprise is available through Zabbix.
Key takeaways
- Prometheus can provide a dimensional data model where metrics are identified by a metric name and tags with built-in storage, graphing, and alerting.
- Prometheus and Zabbix are open-source and free.
- Zabbix Enterprise is available through Zabbix.
- MetricFire's Hosted Graphite is a great tool to add to your stack for complete visibility into your infrastructure.
Conclusion
As we can see, Prometheus and Zabbix are both great products for monitoring, where Prometheus is the more cutting-edge tool. Like all products, they have their own strengths and weaknesses, and everyone must determine for themselves which tool to use for their infrastructure and services. Prometheus has a range of features that make it a good instrument for metrics monitoring, graphing, and alerting.
At MetricFire we provide a Hosted version of Graphite, which includes storing your data for one year, a complete Grafana dashboard setup for data visualization, and much more. You can use Hosted Graphite with minimal configuration to gain in-depth insight into your environment. If you would like to learn more about it, please book a demo with us, or sign on to the free trial today.