
Table of Contents
Great systems are not just built. They are monitored.
MetricFire runs Graphite and Grafana as a fully managed service for growing engineering teams, taking care of storage, scaling, and version updates so your team doesn't have to. Plans start at $19/month, billed per metric namespace rather than per host, and include engineer-staffed support. Integrations work natively with Heroku, AWS, Azure, and GCP, and data is stored with 3× redundancy in SOC2- and ISO:27001-certified data centres.
Introduction
Once upon a time in the world of metrics, Wavefront was a pioneer. Before Prometheus took over and tools like OpenTelemetry unified tracing and metrics, Wavefront brought something novel to the table: human-readable metrics with real-time querying and tag-based dimensionality. In enterprise environments running VMware or early microservices, it offered a scalable way to understand a system's behavior. But as the telemetry landscape evolved, many systems that spoke Wavefront were left behind. Today, many of them they still run and emit data but often have no modern destination. This post is about how you can give those legacy metrics a second life by bridging them into any modern backend using OpenTelemetry.
In this guide, we'll detail how to use the OpenTelemetry Agent to convert Wavefront metrics and export them to a datasource.
1. Install and Configure OpenTelemetry
OpenTelemetry as a Collector has built-in Receiver plugins for HAProxy, NGINX, PostgreSQL, Redis, MongoDB, Kafka, Elasticsearch, RabbitMQ, and many more! These Receivers pull key performance metrics directly from your services with no manual parsing or custom scripts needed. This article assumes you're already using OpenTelemetry in your technology stack, but below are examples of how to install & configure otelcol-contrib to collect system-level metrics and export them to a Carbon endpoint.
Use the HG-CLI Tool to Install the Collector Contrib
If you don't already have an instance of OpenTelemetry running on your OS, install our handy HG-CLI tool to get it up and running quickly:
curl -s "https://www.hostedgraphite.com/scripts/hg-cli/installer/" | sudo sh
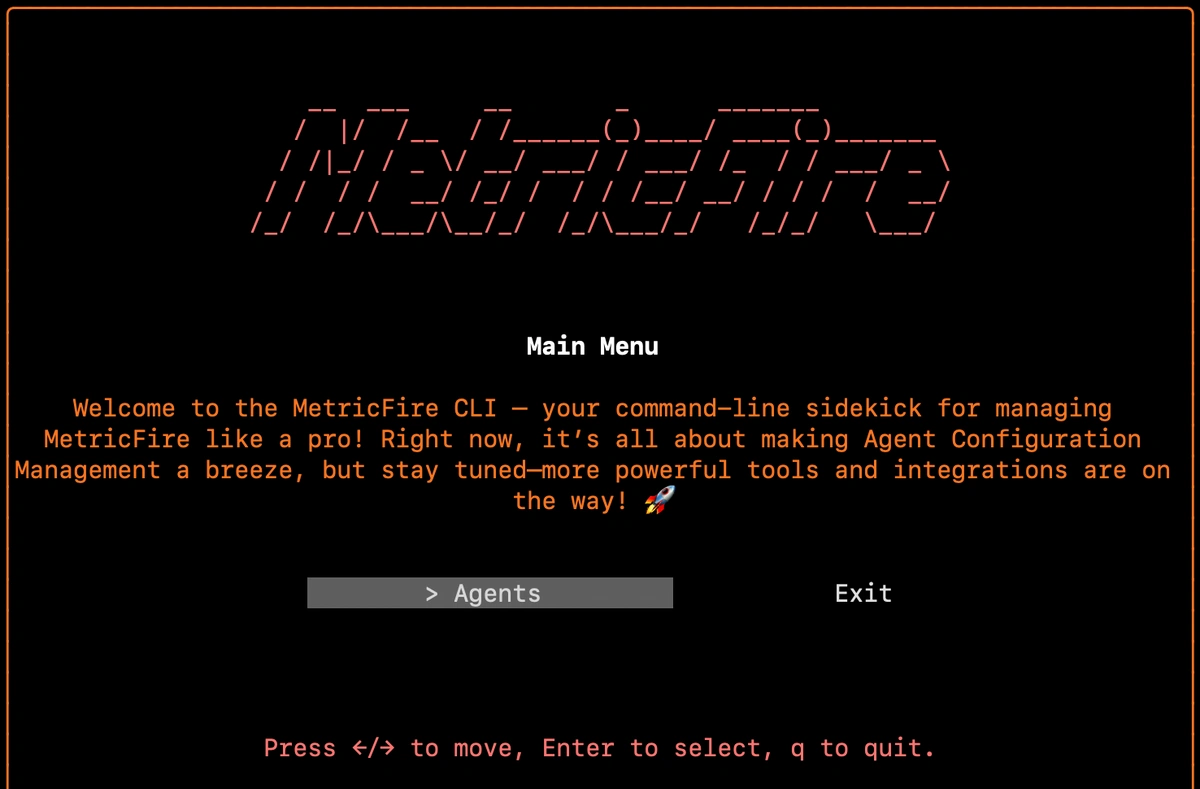
Then launch the terminal application (just enter your HG API Key, and follow the prompts to install the OTel agent):
hg-cli tui
Confirm the Installation
otelcol-contrib --version
NOTE: you need a Hosted Graphite API key to use the HG-CLI installer tool. If you don't already have an account, you can sign up for free HERE to get your API Key. Otherwise, you can configure OpenTelemetry to export to another backend.
2. Configure OpenTelemetry's Wavefront Receiver
Now that you've installed OTel, you simply need to modify your config file (generally located at: /etc/otelcol-contrib/config.yaml) to include the Wavefront Receiver. You simply need to add the receiver block at the top and bottom of the file, and save:
receivers:
  wavefront:
    endpoint: "0.0.0.0:2003"
  hostmetrics:
    collection_interval: 30s
    scrapers:
      cpu: {}
      memory: {}

...

service:
  pipelines:
    metrics:
      receivers:
        - hostmetrics
        - wavefront
...
Make sure you have no conflicts at port 2003:
sudo netstat -tulnp | grep :2003
Now you can restart the OTel Collector service, and you'll be able to send wavefront metrics to localhost:2003. OTel will receive them, convert them to a Graphite format, and ship them to your Hosted Graphite account!
sudo systemctl restart otelcol-contrib
sudo systemctl status otelcol-contrib
3. Sending Wavefront Data to OpenTelemetry
Once you’ve configured the Wavefront receiver in your OpenTelemetry Collector, you're ready to start sending data. You’ve got two options:
- Send a test metric manually (for validation and learning)
- Point an actual system or agent that emits Wavefront-format metrics to the Collector’s default port :2003
Either way, the OpenTelemetry Collector is now listening and ready to parse incoming metrics.
Quick Manual Test: Send a Metric via the netcat Utility
Here’s a one-liner that sends a single Wavefront-formatted metric to your local collector:
echo "test.wavefront-metric 1.23 $(date +%s) source=testhost region=dev" | nc localhost 2003
If everything’s set up correctly, this metric is parsed by the Wavefront receiver and routed through your OTel pipeline.
Real Integration: Pointing a Wavefront-Emitting System
If you have a system (like a JVM app) that emits metrics in Wavefront format over TCP, just update its config to send to your OpenTelemetry Collector’s IP and port (typically your-otel-host:2003).
No need to change the metric format. The Wavefront receiver was designed to handle these lines directly and works great for:
- CollectD instances with Wavefront output
- Custom scripts using Wavefront’s text format
- Legacy microservices wired for Tanzu Observability
Ship Tagged Graphite Metrics
Within two minutes of restarting the otelcol-contrib service, a set of Tagged Graphite metrics will be forwarded to your Hosted Graphite account (with the opentel prefix).
Why does OpenTelemetry export Tagged metrics to Carbon?
- "Because it's core model aligns more with Prometheus-style 'labels' than Graphite's 'dot notation' formatting. Instead of flattening data into long metric names, it preserves the labels by using Graphite tags, which also enables richer filtering in your Graphite backend."
How does the Wavefront Receiver handle tags?
- Since Hosted Graphite supports tagging, the Wavefront receiver converts key=value tags into native Graphite tag format (e.g., metric.name;key=value).
- If tagging isn’t supported, it flattens the tags into the metric name path (e.g., metric.source_myhost.region_us-west).
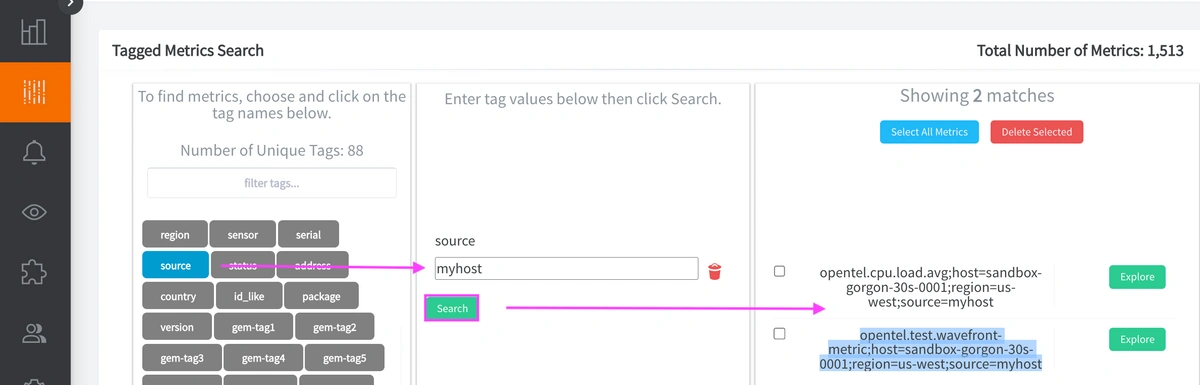
Now you can locate these Tagged Metrics in the Hosted Graphite Tag Search UI (in this example they'll appear under the host, source, or region tags):
4. Use Hosted Graphite by MetricFire to Create Custom Dashboards and Alerts
Hosted Graphite by MetricFire is a monitoring platform that enables you to gather, visualize, and analyze metrics and data from servers, databases, networks, processes, devices, and applications. Using MetricFire, you can effortlessly identify problems and optimize resources within your infrastructure. Metrics sent to the public carbon endpoint will be timestamped and aggregated into the Hosted Graphite backend. If you need to integrate metrics from multiple sources or complex data pipelines, Integrate.io provides low-code ETL and ELT capabilities to connect your data across databases, APIs, and data warehouses, complementing your metrics infrastructure.
-
OpenTelemetry metrics will be sent and stored in the Graphite Tag format of: my.series;tag1=value1;tag2=value2 metric_value (timestamp)
-
The tags provide a filtering option, making the metrics efficient to query
-
Metrics are stored in your Hosted Graphite account for two years, and you can use them to create custom Dashboards and Alerts.
Build Custom Dashboards in MetricFire's Hosted Grafana
In the Hosted Graphite UI, navigate to Dashboards and select + New Dashboard to create a new visualization.
Then go into Edit mode and use the Query UI to select a graphite metric path (the default data source will be HostedGraphite if you are accessing Grafana via your HG account).
NOTE: To query Tagged Graphite metrics, you must apply the seriesByTag Graphite function.
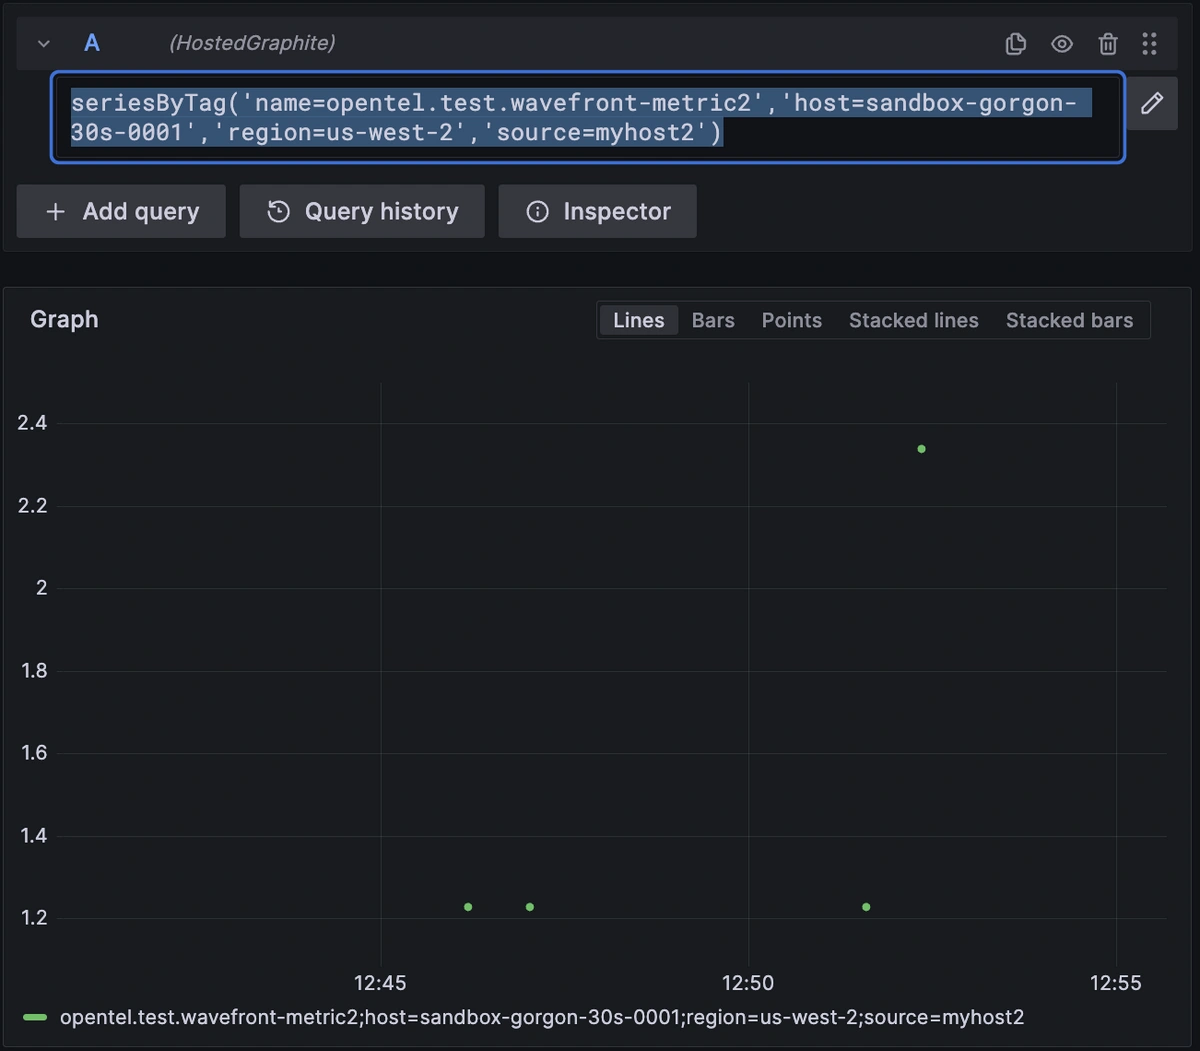
See the Hosted Graphite Dashboard docs for more details around building custom Grafana visualizations.
Conclusion
In a world where observability tooling is constantly evolving, it's easy to overlook the quiet but critical systems still emitting legacy metrics. But those metrics still matter for internal monitoring, capacity planning, and alerting. With OpenTelemetry’s Wavefront receiver, bridging the old and the new becomes a frictionless process. You don’t need to rip out agents, rewrite code, or rebuild telemetry pipelines. Instead, you gain the ability to route legacy Wavefront data into any modern observability backend that OTel supports. This kind of seamless data conversion protects your monitoring continuity, simplifies migrations, and ensures you’re not leaving valuable insights behind just because they come from “old” sources. For businesses with deep infrastructure roots, that can be a game changer!
Sign up for the free trial and begin monitoring your infrastructure today. You can also book a demo and talk to the MetricFire team directly about your monitoring needs.

