
Table of Contents
Great systems are not just built. They are monitored.
MetricFire runs Graphite and Grafana as a fully managed service for growing engineering teams, taking care of storage, scaling, and version updates so your team doesn't have to. Plans start at $19/month, billed per metric namespace rather than per host, and include engineer-staffed support. Integrations work natively with Heroku, AWS, Azure, and GCP, and data is stored with 3× redundancy in SOC2- and ISO:27001-certified data centres.
What is Grafana?
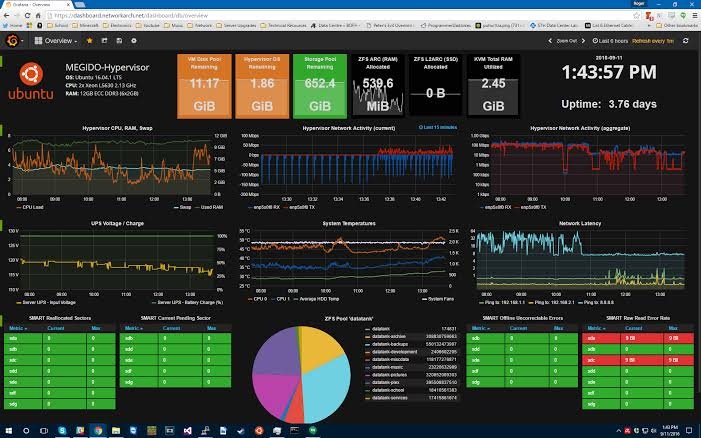
Grafana is a visualization tool that allows you to see and analyze all of your metrics in one unified dashboard. Grafana can pull metrics from any source, such as Graphite and Prometheus, display that data, then enable you to annotate and understand the data directly in the dashboard.
Many businesses choose hosted Graphite because it has:
- An extensive community of users who support each other.
- Features that serve diverse cases, including those that involve analytics, predictions, and DevOps.
- Intuitive graphs and charts that make it easy for people to understand time-series metrics.
- An interface that makes it easy for new users to learn.
Recommended reading: Graphios – Connecting Graphic and Nagios
Grafana dashboards are designed to allow you to visualize information in a ton of ways, from histograms and heatmaps to world maps. Grafana also has an alerting feature that can communicate with you through Slack, PagerDuty, and more.
Dashboards can be shared, downloaded, or expanded with hundreds of plugins that make analysis easier. Grafana is open source, and Grafana as a Service is available through MetricFire.
Get on our free trial and start to make Grafana dashboards in minutes. You can see if Grafana is the right fit for you. If you have any questions you can book a demo and talk to us directly.
What Is Nagios?
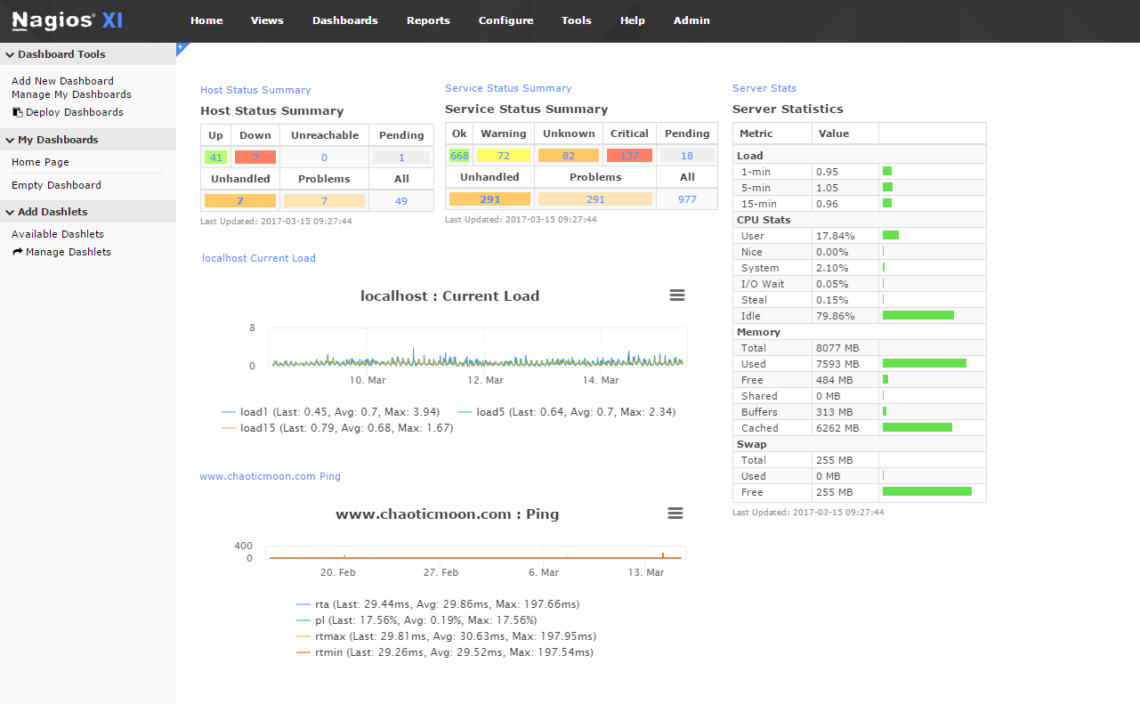
Nagios is a proprietary software for server, network, and log monitoring. Nagios can monitor all parts of an infrastructure such as applications, services, operating systems, network protocols, systems metrics, and network infrastructure. Nagios can integrate with hundreds of third-party plugins. Nagios also has really powerful server performance, allowing Nagios to process limitless scalability of metrics, with high uptime.
Nagios has a web interface and advanced dashboarding for visualization. Nagios also allows users to do capacity planning, snapshot configurations so they can be saved and reused, and infrastructure management. Different products are required if you want to monitor network infrastructure or logs, and a third product called Nagios Fusion ties them both together.
Recommended reading: 9 Best Open Source Network Monitoring Tools
When to Use Grafana?
Use Grafana when you:
- Need beautiful, simple, annotated graphs.
- Have multiple sources of metrics or logs and need to see them in one place.
- Need to share your dashboards across the organization.
- Need to reorganize information based on specific team needs.
- Need an easy-to-use query builder.
- Need alerting for events.
When to Use Nagios?
Use Nagios when you:
- Want to monitor servers.
- Want to monitor networks.
- Want to monitor applications.
- Need Windows or Linux monitoring.
- Need log monitoring.
Try MetricFire now!
If you're interested in trying it out for yourself, sign up for our free trial. You can also sign up for a demo and we can talk about the best monitoring solutions for you.
Pricing Comparison
- Grafana is open source, and free.
- Business-ready Grafana as a Service by Metricfire, including hosted Graphite and Prometheus, starts at 99 USD a month.
- Nagios Enterprise starts at 3,495 USD per month.
Key Takeaways
- Grafana can integrate with a huge range of collectors, agents, and storage engines.
- Grafana is open source, and free.
- Nagios is a legacy IT infrastructure monitoring tool with a focus on server, network, and application monitoring.
Get to know our Grafana as a Service better, and check out how MetricFire can fit into your monitoring environment! Get a free trial and start making Grafana dashboards right away. Feel free to book a demo if you have questions about what Grafana can do for you.


