Table of Contents
Great systems are not just built. They are monitored.
MetricFire runs Graphite and Grafana as a fully managed service for growing engineering teams, taking care of storage, scaling, and version updates so your team doesn't have to. Plans start at $19/month, billed per metric namespace rather than per host, and include engineer-staffed support. Integrations work natively with Heroku, AWS, Azure, and GCP, and data is stored with 3× redundancy in SOC2- and ISO:27001-certified data centres.
Introduction
In this article we explore the basics of monitoring Amazon Web Services (AWS) by feeding metrics to Grafana through Hosted Graphite’s agent and also through Hosted Graphite’s AWS add-on. This will allow us to monitor metrics from applications and servers hosted in AWS with clarity and depth.
This article assumes you have created a Hosted Graphite account. If you haven’t yet created an account, jump onto the MetricFire free trial and get monitoring!
What is Amazon Web Services?
What is Amazon Web Services or AWS? Launched in 2002, AWS is one of the world’s most popular platforms for building and deploying cloud-based applications and offers a myriad of services from computing, storage, analytics, management and governance, and more. You can view the full list of services right here. According to Canalys, AWS was the world’s largest cloud infrastructure provider in 2018, possessing 38% of market share, and most likely remains a market leader today.
Many corporations of the world that you know of utilize AWS. One such company is Netflix, which according to Amazon, utilizes AWS for almost all of their computation and storage needs. So if you were watching Stranger Things the other night, the video files were hosted on a AWS server.
Getting Started
First head over to Amazon Web Services and create an account. As of June 2020, AWS offers 12 months of free tier usage access which offers popular services such as Amazon EC2, Amazon S3 and Amazon DynamoDB.
Once logged in, you should get this dashboard.
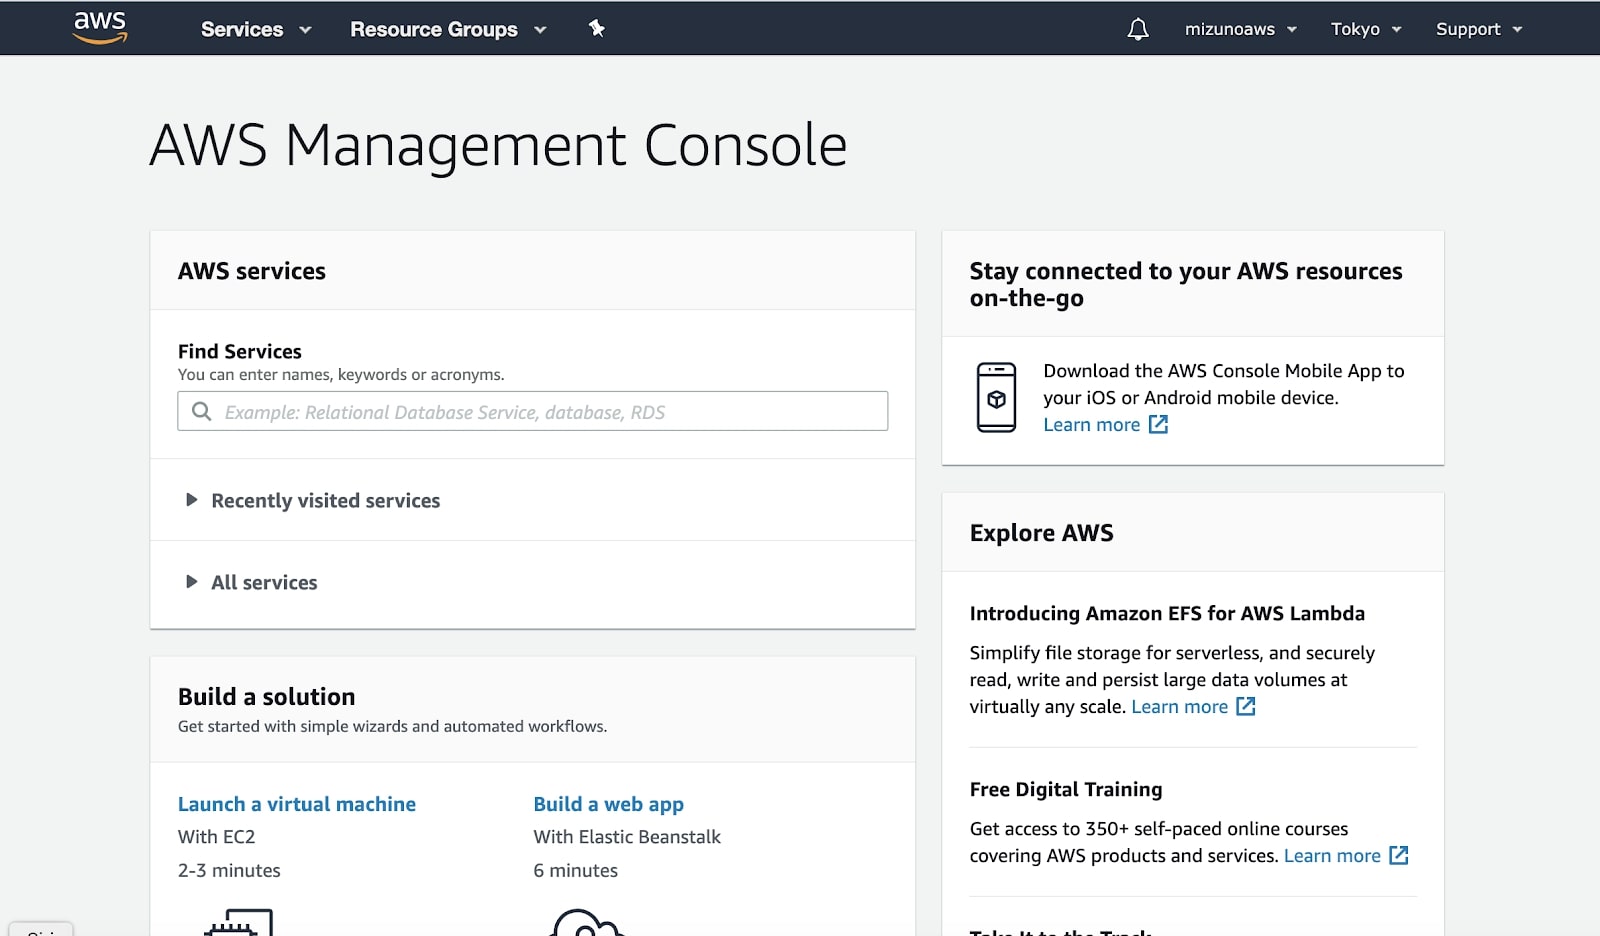
This is your management console where you will be able to create and use any service Amazon offers.
Creating a Virtual Linux Machine and Monitoring It with Hosted Graphite
For free tier access, Amazon offers two virtual machine services: Elastic Cloud Computing (EC2) and Lightsail.
EC2 provides scalable computing capabilities by offering virtual computing environments known as instances, which can customized in various ways from: operating system, server location, CPU, storage, network capacity, and more. It boasts a powerful flexibility for any team wishing to create a robust computing environment, but it is also quite complicated for many novice users. You can check the general offerings and documentation here.
For users who are not sure about the exact specifications for optimal computation and capabilities, Amazon offers a simpler virtual environment: Amazon Lightsail.
Amazon Lightsail offers users a version of EC2, but with pre-configured settings and options. Currently, Amazon offers free use of an instance for the first month, if using the smallest capabilities, so we will use Lightsail for the purposes of this article.
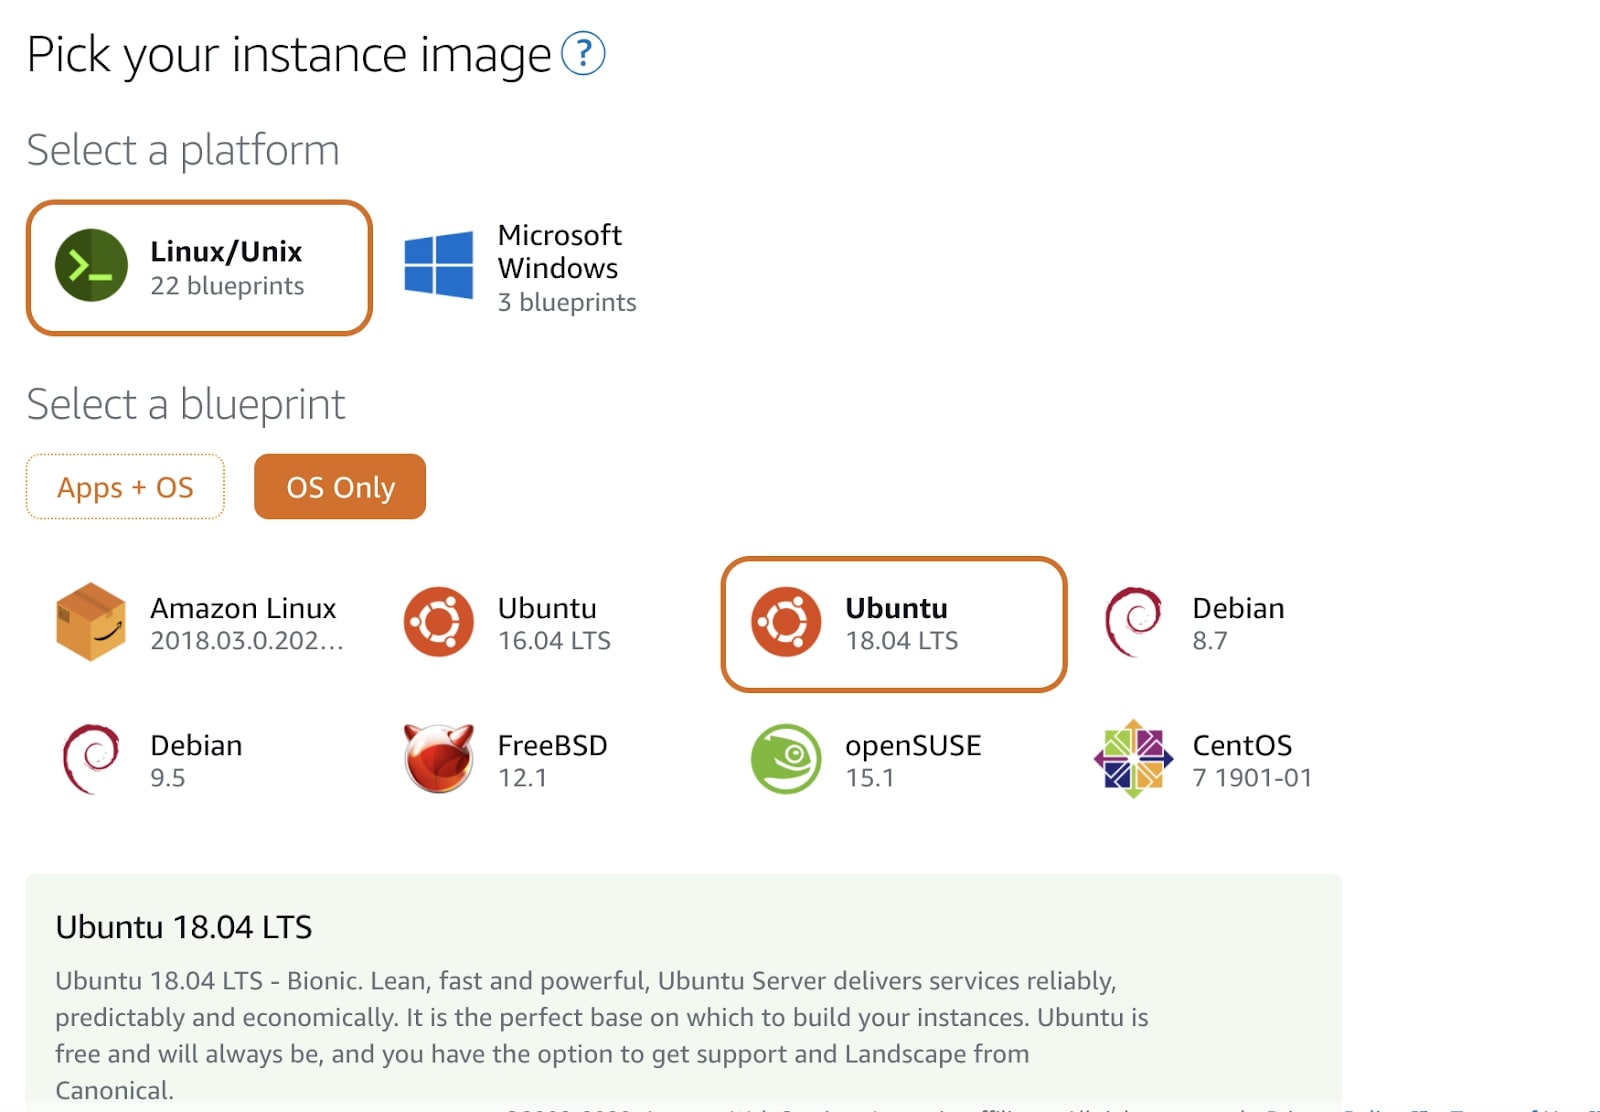
First, go to AWS’s Lightsail console and click on “create instance”.
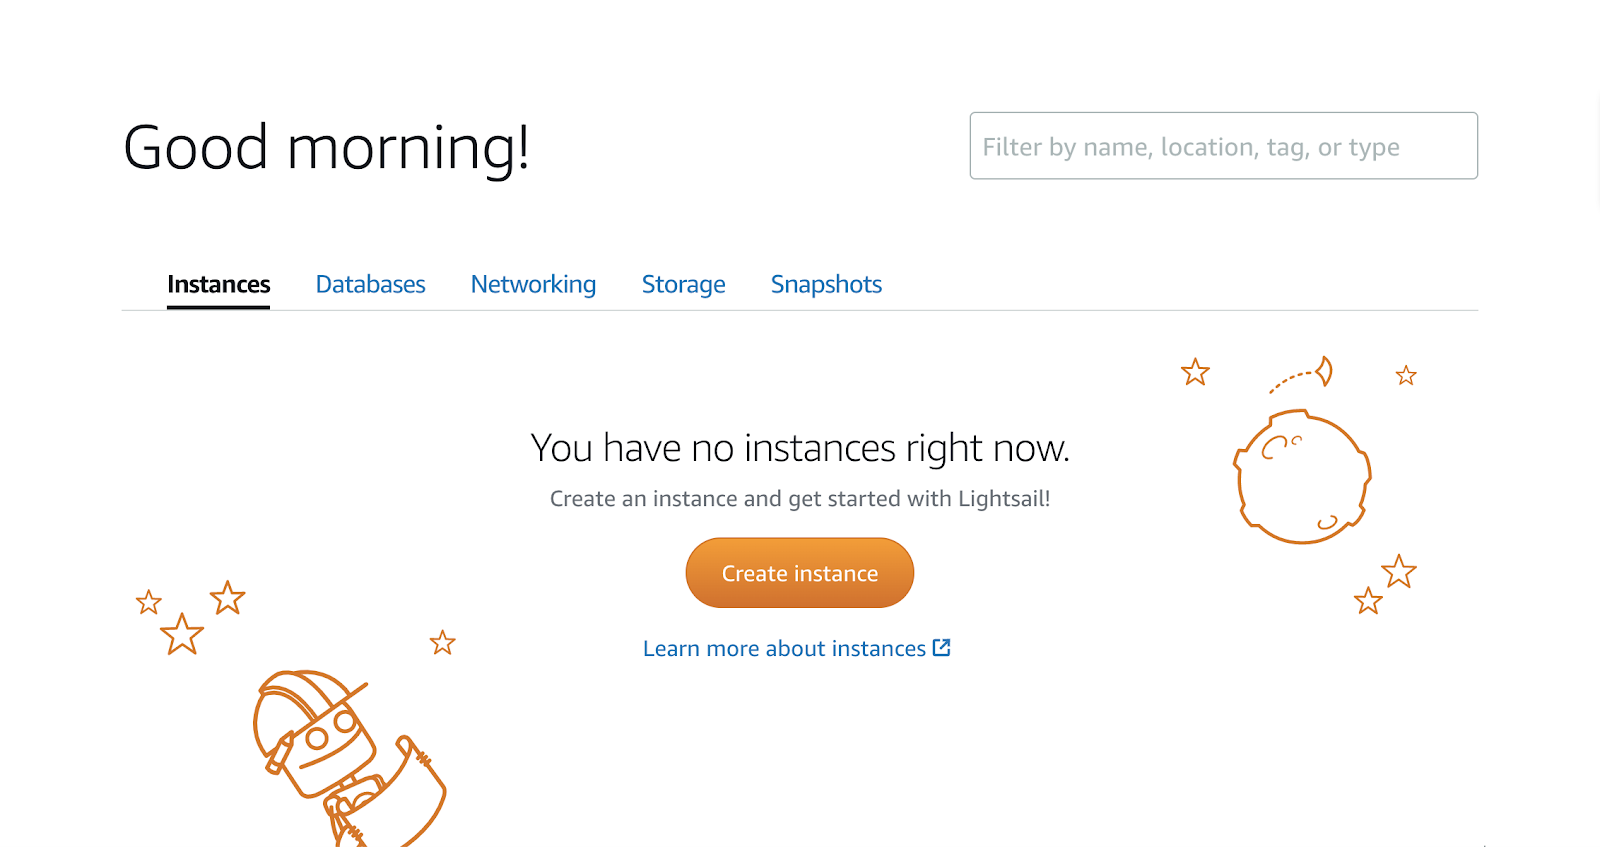
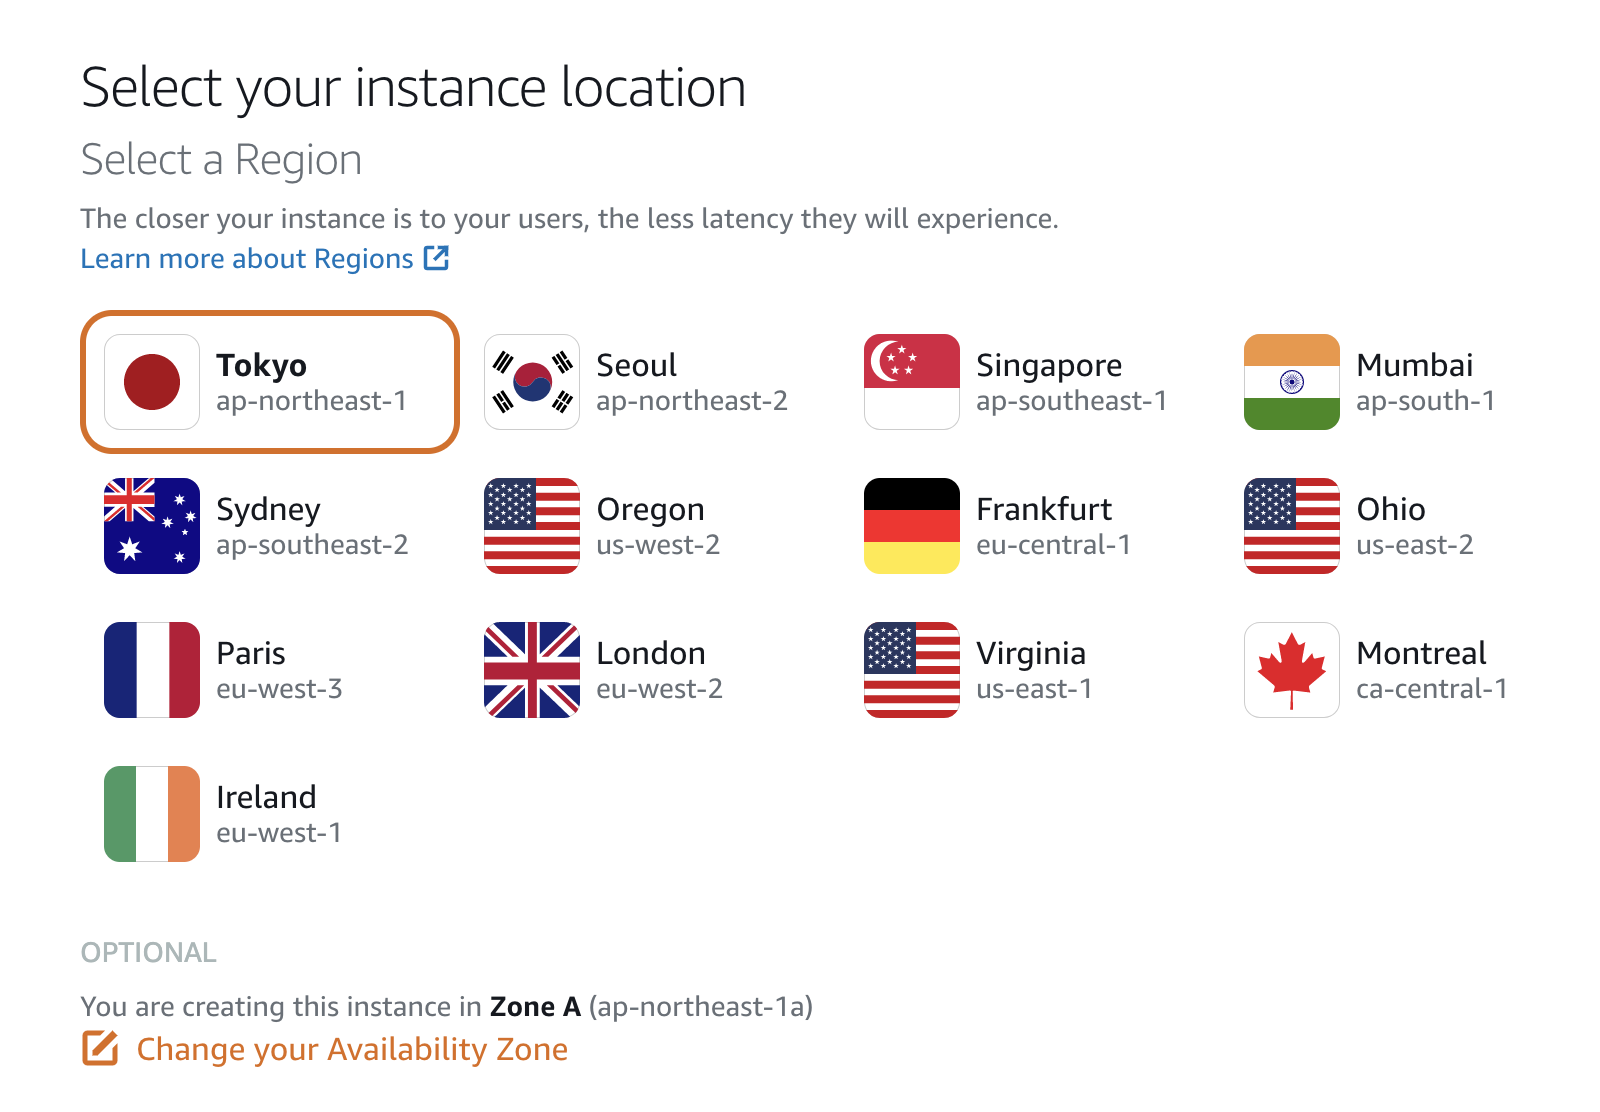
Choose an appropriate instance location.
Choose a linux instance. I chose Ubuntu because it’s the distribution I’m personally most familiar with.
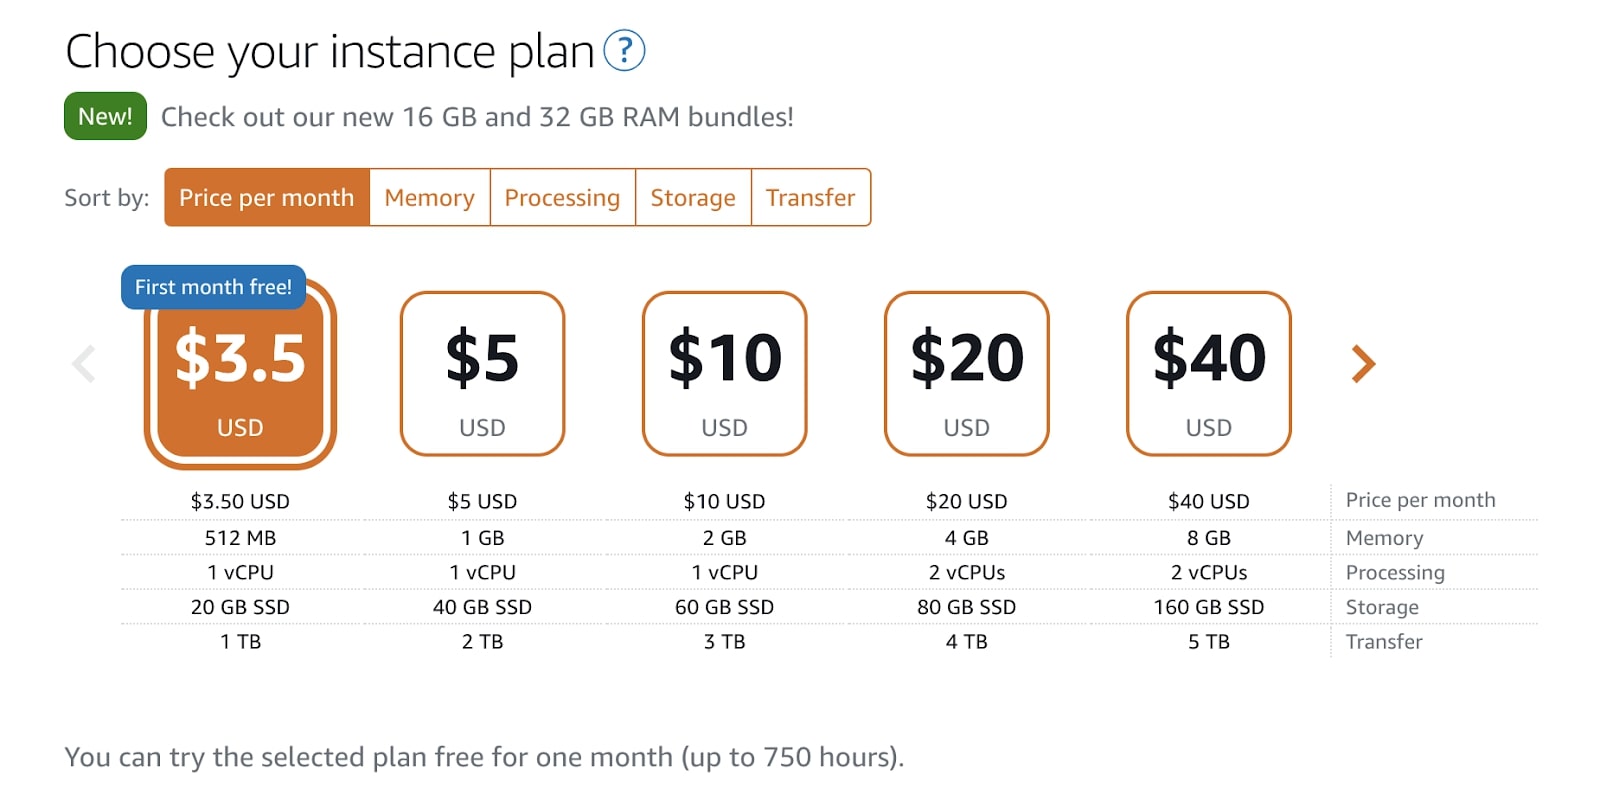
Choose an instance plan. For this article we won’t be doing much so let’s use the cheapest option, the $3.5 per month with first month free.
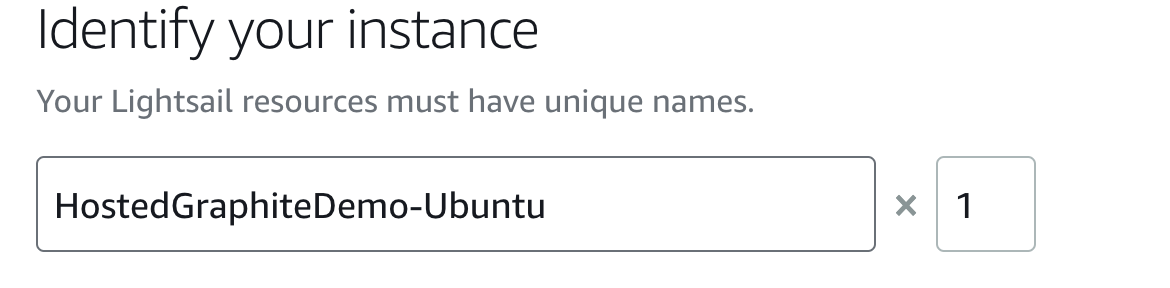
Name it something recognizable.
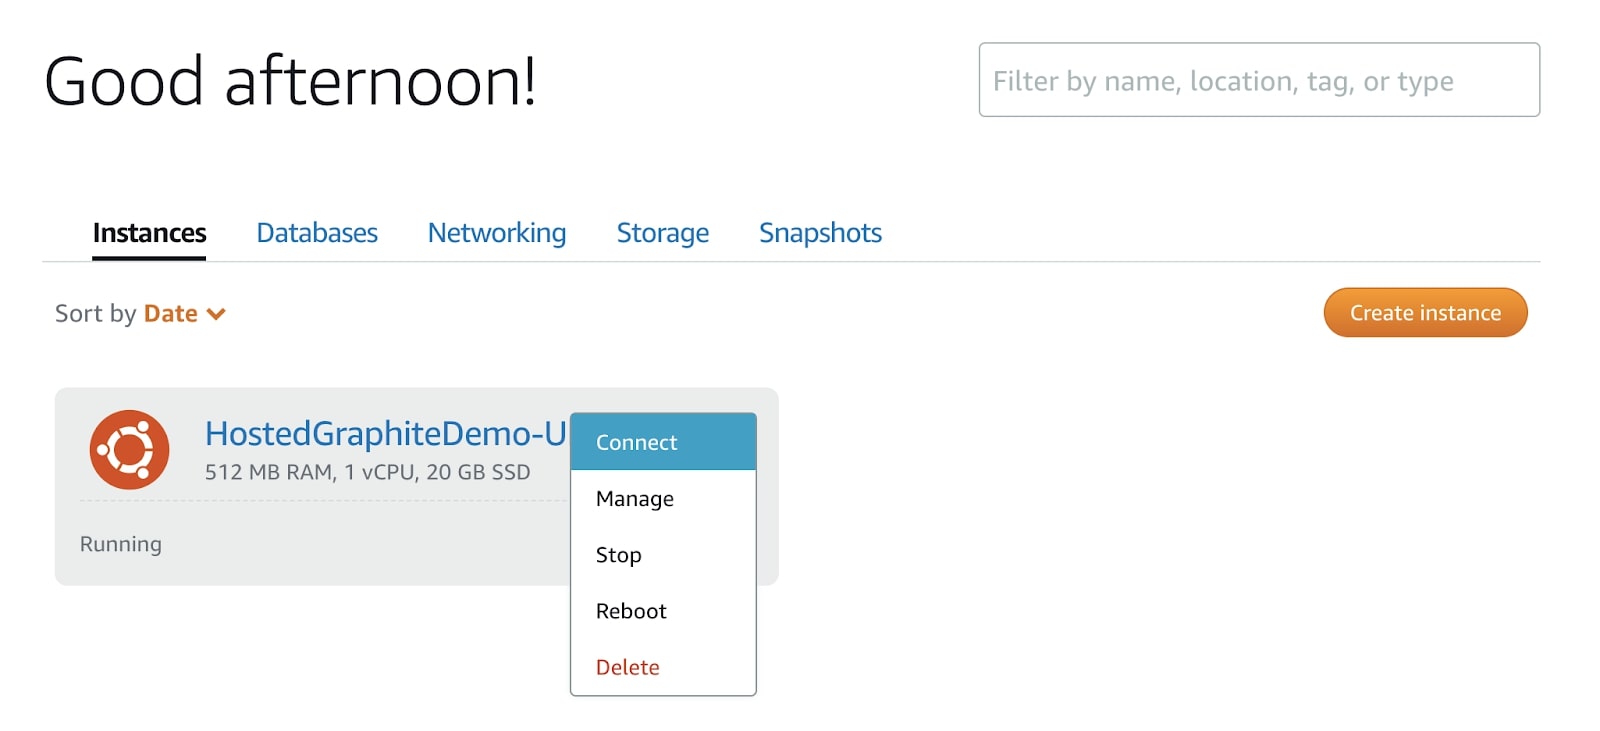
Now let’s create the instance!

Once the instance is created, you can connect to the server by clicking on the “connect” tab.
Once the instance starts up you should get this:
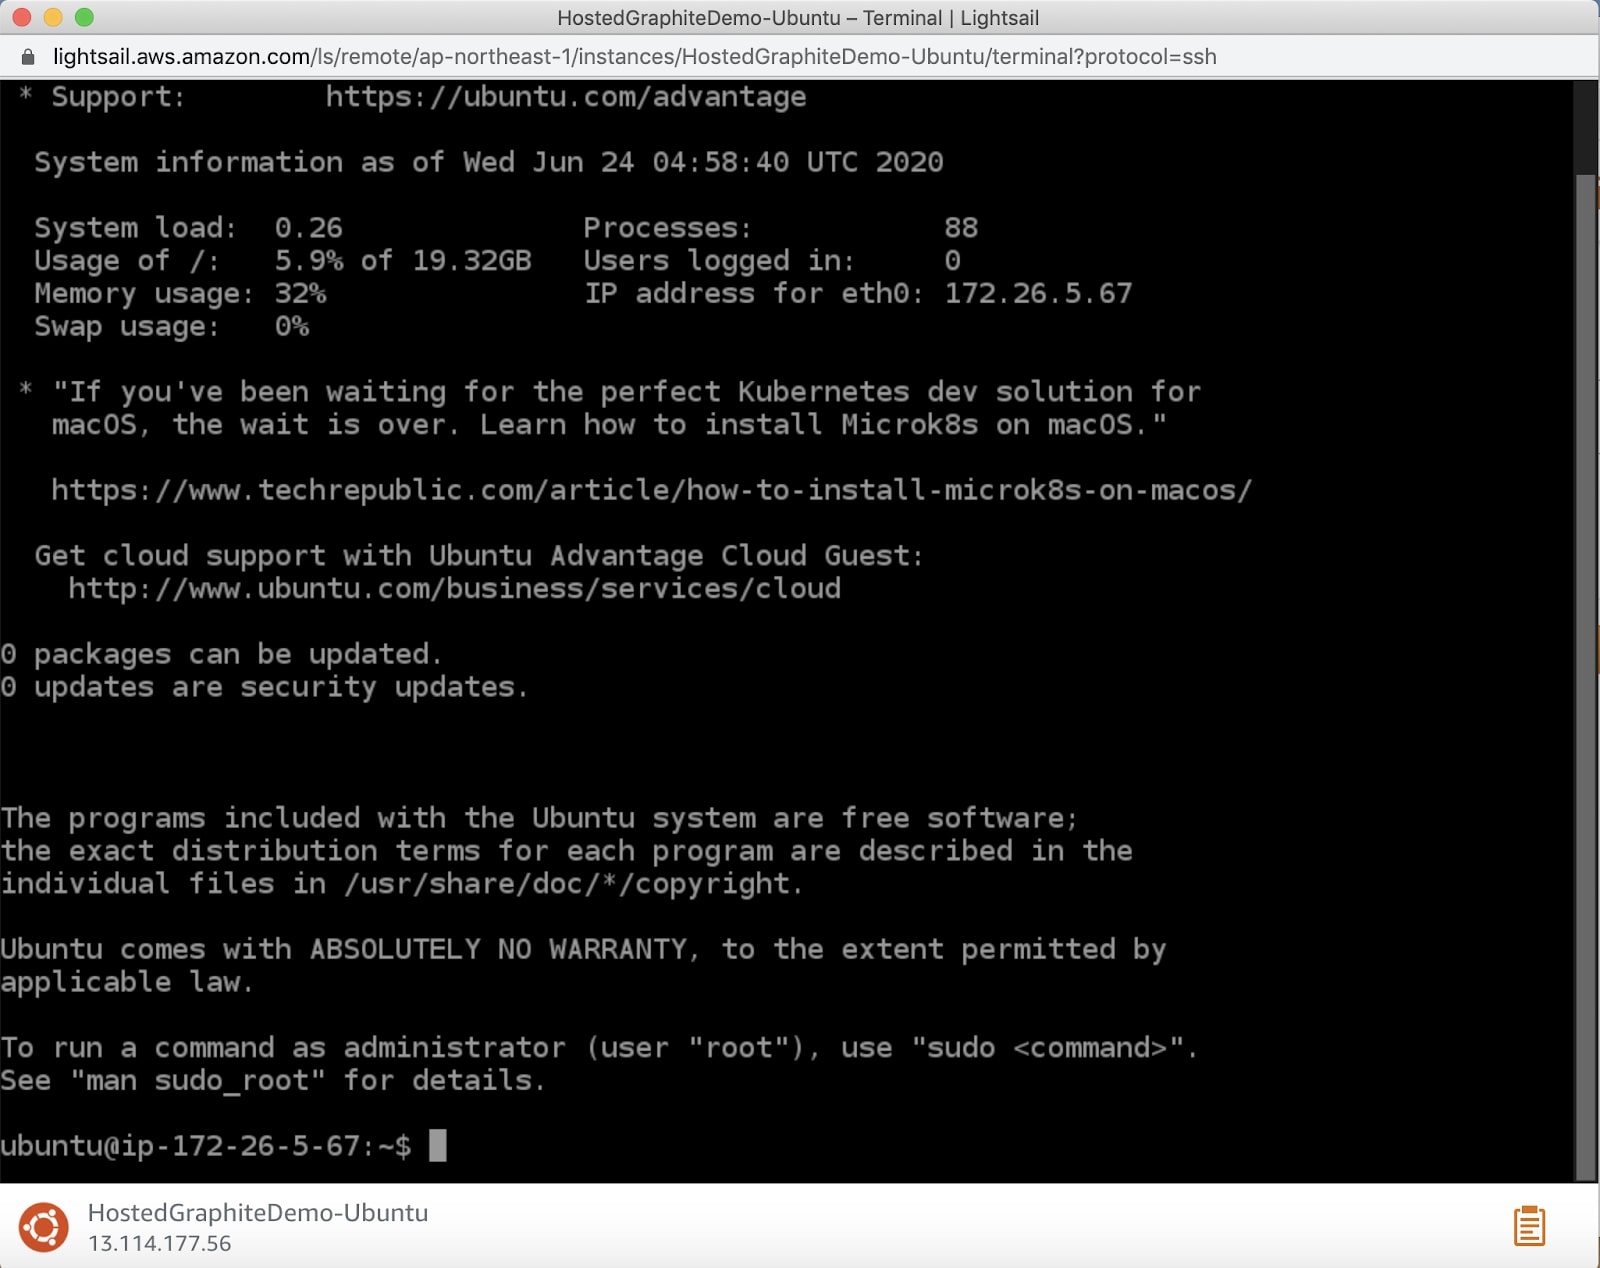
Once the instance is connected, you can now download the Hosted Graphite agent to start monitoring this server’s metrics. As you can see, my current IP address is 172.26.5.67 which will be the label of the metrics that come through Hosted Graphite.
As the Hosted Graphite document suggests, type:
curl -s https://YOUR-API-KEY@www.hostedgraphite.com/agent/installer/deb/ | sudo sh
Once you have downloaded the agent, metrics should start flowing into your Hosted Graphite page.
Now, go to your Hosted Graphite page and check your metric tree to confirm that your metrics have arrived.
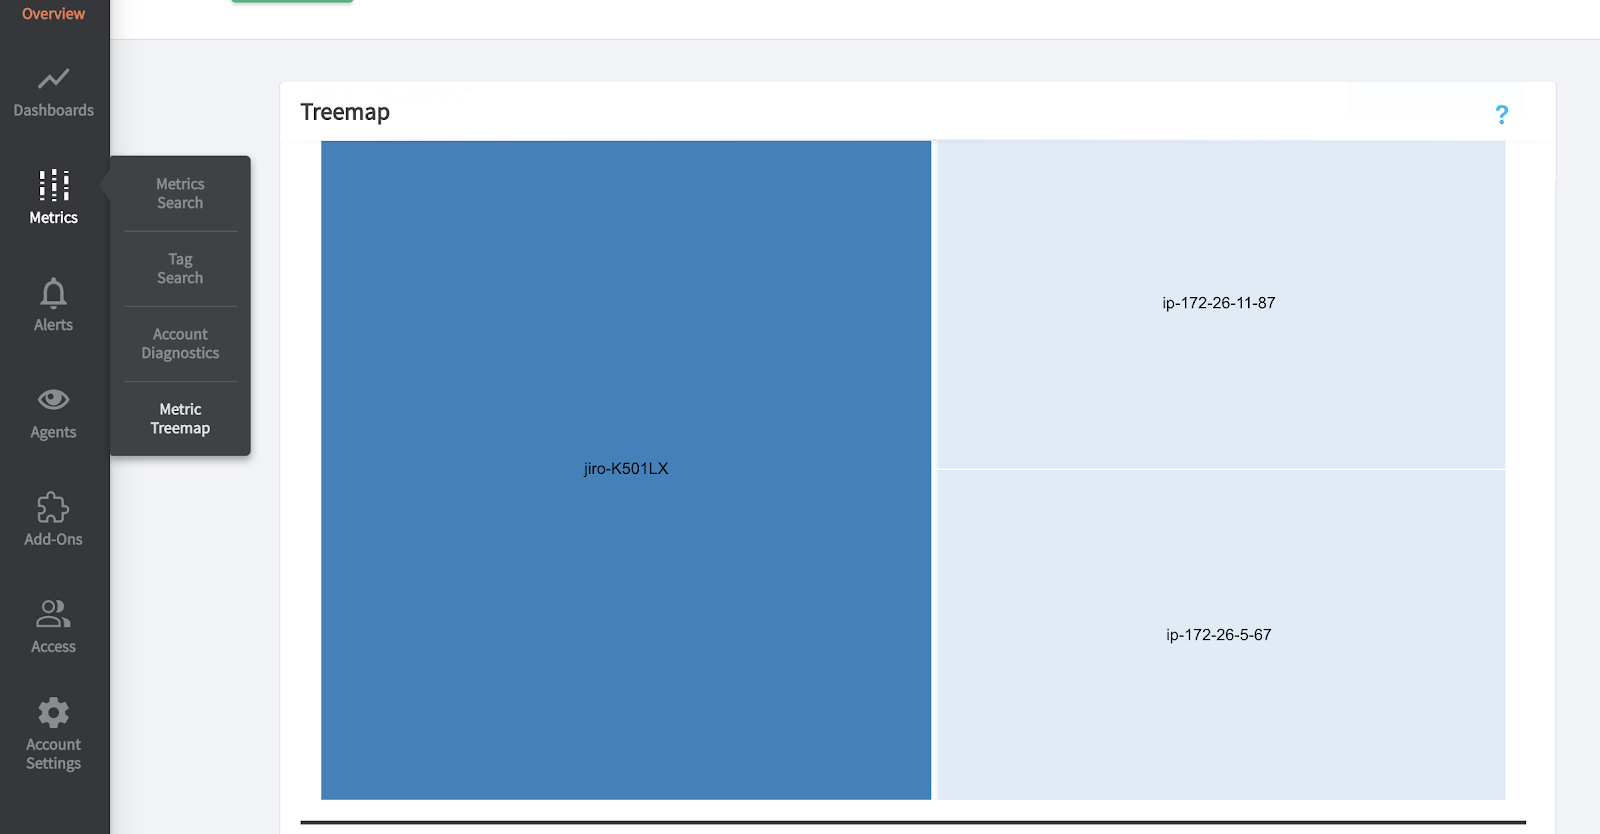
As you can see, metrics from the ip address of the new ubuntu instance (172.26.5.67) have arrived.
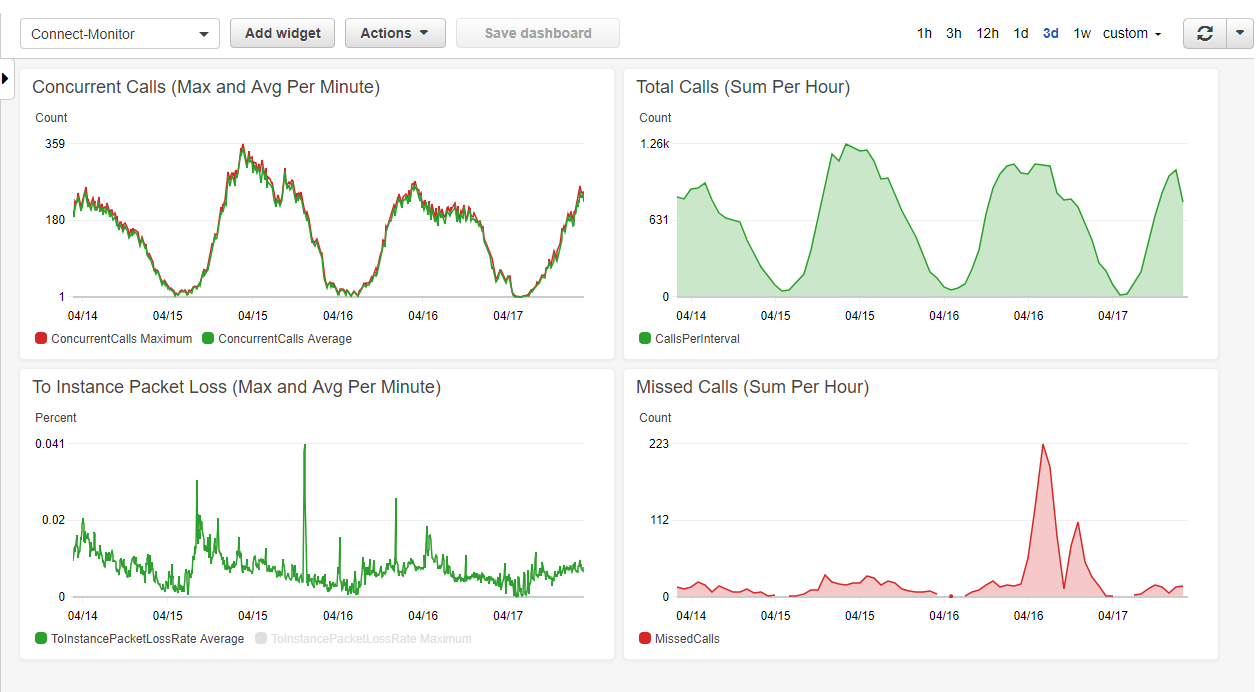
Now you can go to the dashboards, and create metrics to monitor your new ubuntu instance. Mine looks like this:
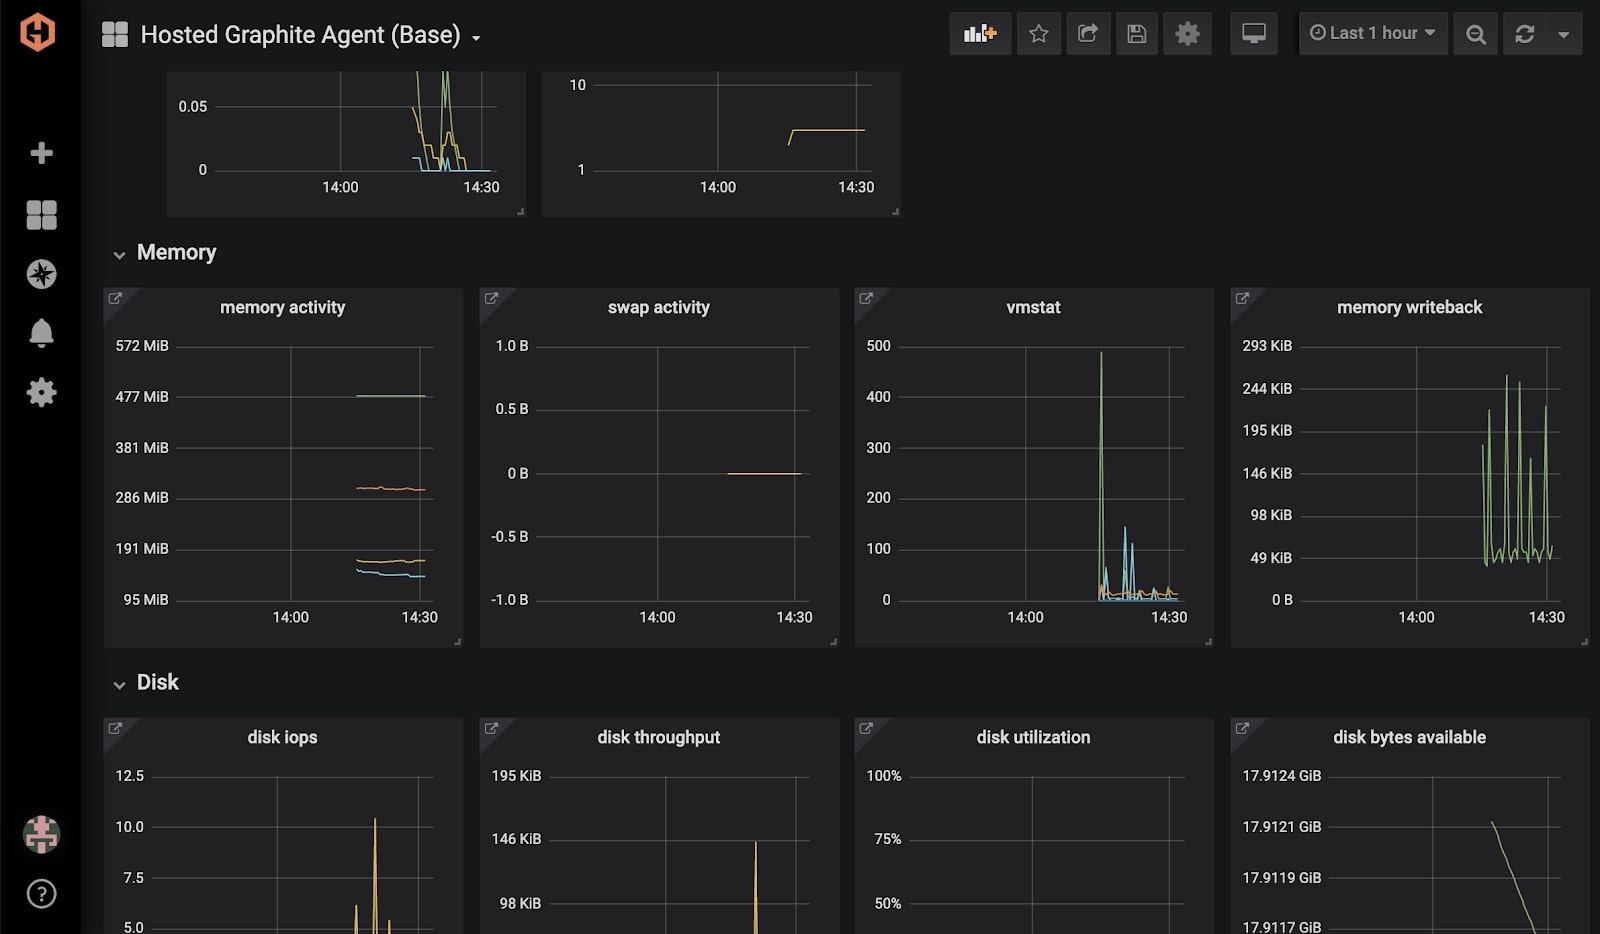
Now you can start creating your own Amazon servers and monitor them with Hosted Graphite.
Amazon Cloudwatch vs Hosted Graphite
It is important to note here that Amazon itself offers their own monitoring service known as CloudWatch which can be used to monitor Amazon servers and other AWS products.
Cloudwatch offers systemic diagnostics similar to those offered by Hosted Graphite’s own agent so for any company that only specializes in AWS products, like Netflix as discussed earlier, using CloudWatch may be a simpler and more efficient option.
Why should I use Hosted Graphite then?
I can guess what you’re thinking: if Amazon has their own service, why should I pay more for a different one?
In short, because Hosted Graphite offers consolidated and flexible diagnostics for those who require metrics from a variety of sources. For enterprises that are partially reliant on AWS and/or possess applications that are hosted elsewhere, Hosted Graphite offers varied application metrics to allow users to find correlations between different types of metrics such as web traffic, cpu usage per user, infrastructure load and much more.
Furthermore, via customizable dashboards, alerts and tags, rapidly growing operations can manage their increasing metrics and still keep track of their entire system, while other monitoring services can get increasingly byzantine and unwieldy as many engineers have experienced before.
Finally, and most importantly for a lot of enterprises, Amazon’s Cloudwatch can be very expensive. Billing on a per metric basis, Cloudwatch charges:
- $0.30 per month for the first 10,000 metrics
- $0.10 per month for the next 240,000 metrics
- $0.05 per month for the next 750,000 metrics
- $0.02 per month for any over 1,000,000
API requests : generally $0.01 per request
Dashboards: $3.00 per month for each
Standard Alerts (60s): $0.10 per month for each
To show how expensive this is: let’s say there’s a large enterprise that uses around 150,000 metrics, 100 standard alerts and 200 dashboards. Each month that costs around $17,000 for metrics, $10 for alerts, and $600 for dashboards for a total of $17,610 every month. Annually, that adds up to a hefty $223,320! That’s not even accounting for log storage, api request, events and higher resolution alarms. You can check detailed CloudWatch prices here.
For comparison, MetricFire’s Hosted Graphite will only charge $3,849 per month for the same example as detailed above. Those with quick math skills will agree that Hosted Graphite offers nearly 80% savings in contrast to CloudWatch with such an example. You can check Hosted Graphite prices here.
Overall, while AWS offers great flexibility and scalability through EC2, Lightsail and other services, their monitoring service can leave much to be desired. To synergize your enterprise for maximum cost efficiency, a viable solution may be to utilize AWS’s many services and servers, while leaving the actual monitoring to Hosted Graphite and other services.
If you are curious about the capabilities of MetricFire’s Hosted Graphite, you can click here to have a free two week trial, and also talk with one of our engineers to determine if this service is the right choice for you!
Related articles for further reading: