
Table of Contents
Great systems are not just built. They are monitored.
MetricFire runs Graphite and Grafana as a fully managed service for small engineering teams, taking care of storage, scaling, and version updates so your team doesn't have to. Plans start at $19/month, billed per metric namespace rather than per host, and include engineer-staffed support. Integrations work natively with Heroku, AWS, Azure, and GCP, and data is stored with 3× redundancy in SOC2- and ISO:27001-certified data centres.
Introduction
Monitoring your machine's internal temperatures is essential for maintaining system health, optimizing performance, and ensuring the longevity of your computer hardware. It allows you to take proactive measures to prevent damage caused by overheating and helps diagnose and address cooling-related issues effectively.
In this article, we'll detail how to use the Telegraf agent to collect temperature readings from a Mac computer that you can forward to a data source.
Getting Started with the Telegraf Agent
Telegraf is a plugin-driven server agent built on InfluxDB, and it is used to collect and send metrics/events from databases, systems, processes, devices, and applications. Telegraf is written in Go, compiles into a single binary with no external dependencies, and requires minimal memory footprint. It is compatible with many operating systems and has many helpful output plugins and input plugins for collecting and forwarding a wide variety of system performance metrics.
Install Telegraf (MacOS)
brew install telegraf
For up-to-date versions and installation commands for other operating systems (Ubuntu/Debian, RedHat/CentOS, Windows, Linux binaries), see the Telegraf docs.
For MacOS, packages and files are generally installed in the /usr/local/etc/ directory.
Configure an Output
You can configure Telegraf to output to various sources, such as Graphite, Kafka, InfluxDB, Prometheus, SQL, NoSQL, and more.
In this example, we will configure Telegraf with a Graphite output. If you're not currently hosting your own data source, you can start a free trial with Hosted Graphite by MetricFire to follow these next steps.
A Hosted Graphite account will provide the data source, offer an alerting feature, and include Hosted Grafana as a visualization tool.
To configure the Graphite output, locate the downloaded telegraf configuration file at ~/usr/local/etc/telegraf/telegraf.conf and open it in your preferred text editor. Then, you will need to make the following changes to the file:
Locate and comment out the line:
# [[outputs.influxdb]]
Then, uncomment the line:
[[outputs.graphite]]
Next, uncomment and edit the server line to:
servers = ["carbon.hostedgraphite.com:2003"]
Finally, uncomment and edit the prefix line to:
prefix = "<YOUR_API_KEY>.telegraf"
Configure the Telegraf Temp Input Plugin:
Telegraf has many input plugins that can collect a wide range of data from many popular technologies and 3rd party sources. In this example, we'll demonstrate how to configure the temp plugin.
All you need to do is search for the inputs.nginx section in your telegraf.conf file, and uncomment the [[inputs.temp]] line:
[[inputs.temp]]
Save your changes, and then run Telegraf using the following command to see if there are any configuration errors in the output:
telegraf --config telegraf.confTelegraf will now be forwarding 21 metrics to your data source; this is what they will look like in the Graphite format:
telegraf.<host-name>.TA0P.temp.temp
telegraf.<host-name>.TA1P.temp.temp
telegraf.<host-name>.TB0T.temp.temp
telegraf.<host-name>.TB1T.temp.temp
telegraf.<host-name>.TB2T.temp.temp
telegraf.<host-name>.TB3T.temp.temp
telegraf.<host-name>.TC0D.temp.temp
telegraf.<host-name>.TC0H.temp.temp
telegraf.<host-name>.TC0P.temp.temp
telegraf.<host-name>.TG0D.temp.temp
telegraf.<host-name>.TG0H.temp.temp
telegraf.<host-name>.TG0P.temp.temp
telegraf.<host-name>.TH0P.temp.temp
telegraf.<host-name>.TI0P.temp.temp
telegraf.<host-name>.TI1P.temp.temp
telegraf.<host-name>.TM0P.temp.temp
telegraf.<host-name>.TM0S.temp.temp
telegraf.<host-name>.TN0D.temp.temp
telegraf.<host-name>.TN0H.temp.temp
telegraf.<host-name>.TN0P.temp.temp
telegraf.<host-name>.TW0P.temp.temp
See the official GitHub repository for more information on the temp input plugin.
Use Hosted Graphite by MetricFire to Create Custom Dashboards and Alerts
MetricFire is a monitoring platform that enables you to gather, visualize, and analyze metrics and data from servers, databases, networks, devices, and applications. Using MetricFire, you can effortlessly identify problems and optimize resources within your infrastructure. Hosted Graphite by MetricFire removes the burden of self-hosting your monitoring solution, allowing you more time and freedom to work on your most important tasks.
Once you have signed up for a Hosted Graphite account and used the above steps to configure your server with the Telegraf Agent, metrics will be forwarded, timestamped, and aggregated into the Hosted Graphite backend.
- Metrics will be sent and stored in the Graphite format of: metric.name.path <numeric-value> <unix-timestamp>
- The dot notation format provides a tree-like data structure and makes it efficient to query
- Metrics are stored in your Hosted Graphite account for two years, and you can use them to create custom Alerts and Grafana dashboards.
Build Dashboards in Hosted Graphite's Hosted Grafana
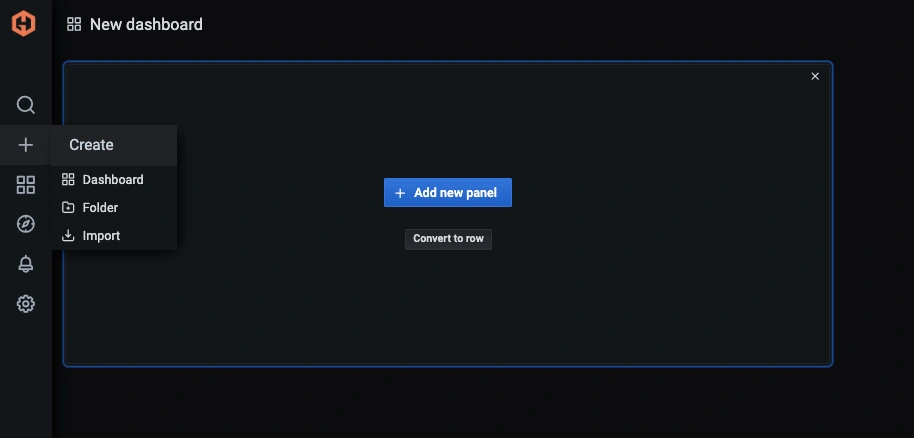
In the Hosted Graphite UI, navigate to Dashboards => Primary Dashboards and select the + button to create a new panel:
Then you can use the query UI to select a graphite metric path (the default data source will be the hosted graphite backend if you are accessing Grafana through your Hosted Graphite account):
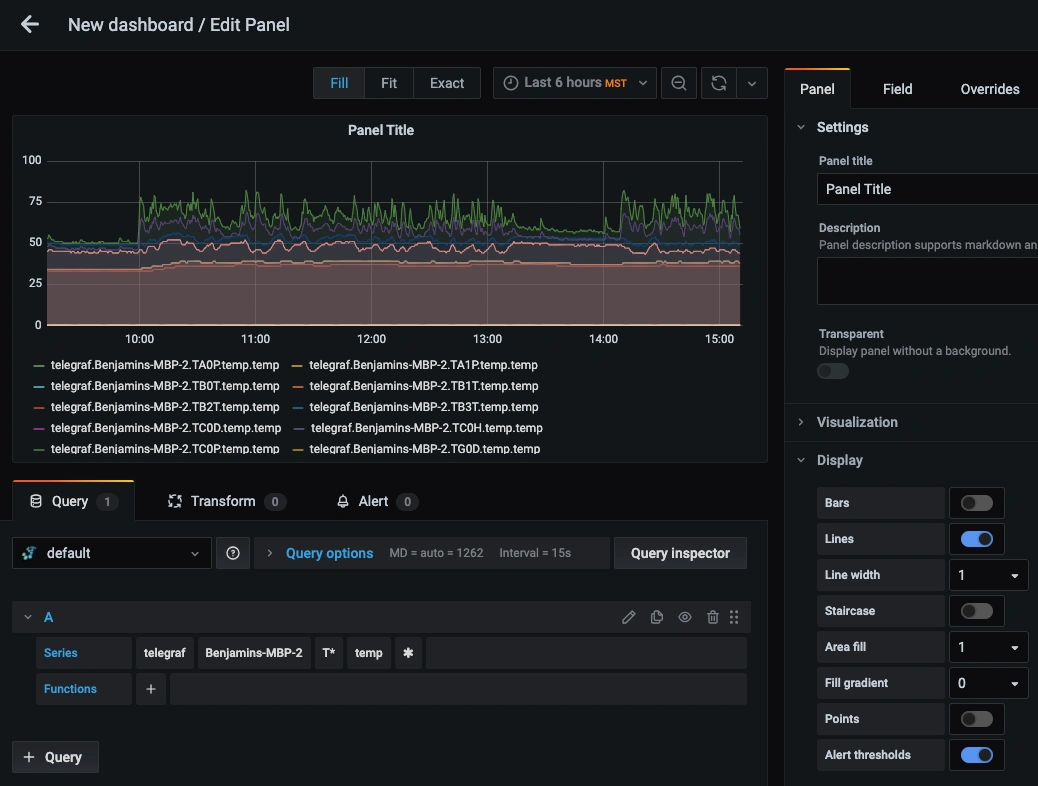
The Hosted Graphite datasource also supports wildcard (*) searching to grab all metrics that match a specified path.
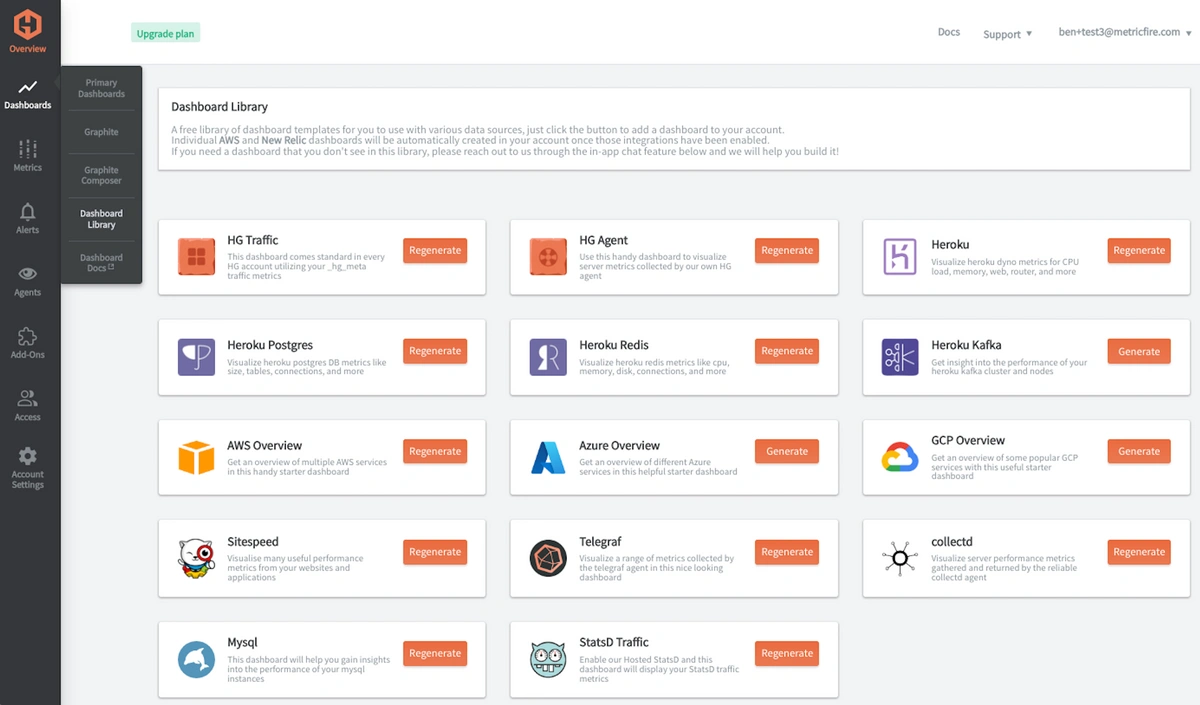
Hosted Graphite also has a pre-configured dashboard for Telegraf metrics located in their Dashboard Library:
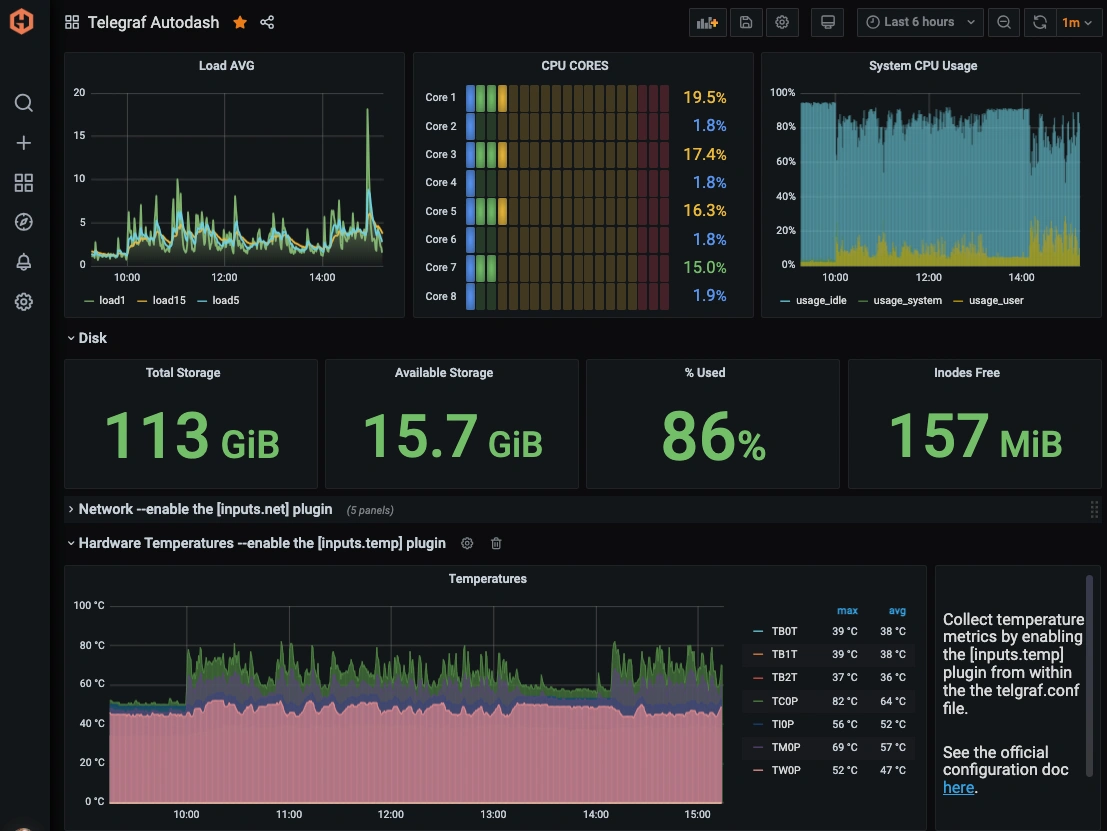
Once this dashboard is generated in your account, you can locate it in your Primary Dashboards to see system metrics (CPU, mem, disk) displayed, including a row for hardware temperatures:
Creating Graphite Alerts
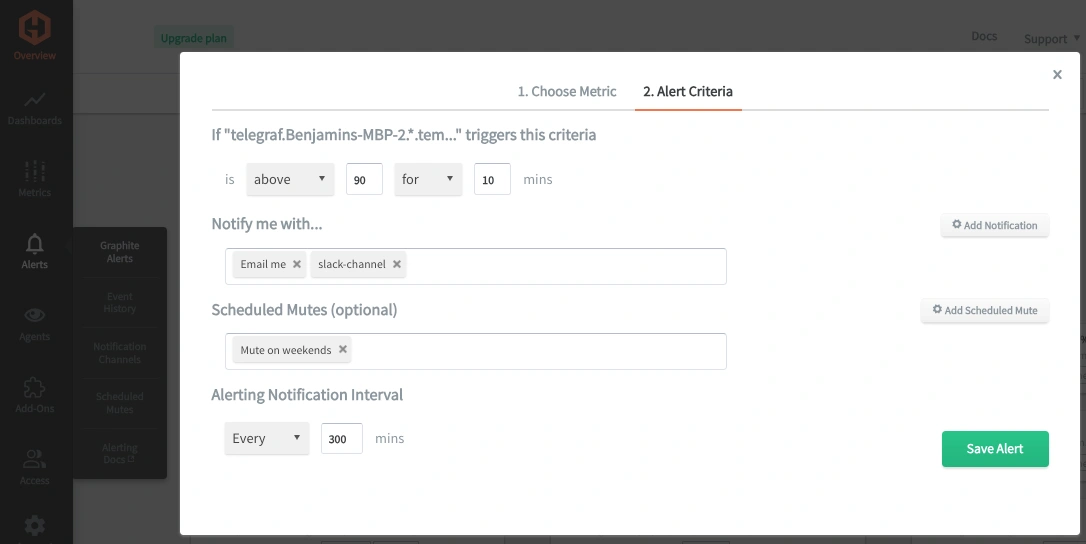
In the Hosted Graphite UI, navigate to Alerts => Graphite Alerts to create a new alert. Name the alert, add a query to the alerting metric field, and add a description of what this alert is:

Then, select the Alert Criteria tab to set a threshold and select a notification channel. The default notification channel is the email you used to sign up for the Hosted Graphite account. Still, you can easily configure channels for Slack, PagerDuty, Microsoft Teams, OpsGenie, custom webhooks and more. See the Hosted Graphite docs for more details on notification channels:
Conclusion
High temperatures in your machine can potentially damage hardware components and lead to reduced lifespan or failure of components like CPUs, GPUs, and hard drives.
Monitoring your machine's system performance provides valuable data, and using tools like dashboards and alerts will complement this data by providing real-time visualization, proactive identification of issues, historical trend analysis, and facilitating informed decision-making. All of these are essential for maintaining a robust and efficient infrastructure.
Sign up for the free trial and experiment with monitoring your machine's internal temperatures today. You can also book a demo and talk to the MetricFire team directly about your monitoring needs.

