
Table of Contents
Great systems are not just built. They are monitored.
MetricFire runs Graphite and Grafana as a fully managed service for growing engineering teams, taking care of storage, scaling, and version updates so your team doesn't have to. Plans start at $19/month, billed per metric namespace rather than per host, and include engineer-staffed support. Integrations work natively with Heroku, AWS, Azure, and GCP, and data is stored with 3× redundancy in SOC2- and ISO:27001-certified data centres.
Introduction
Tracking the International Space Station (ISS) as it orbits Earth is not just a captivating endeavor for space enthusiasts, it's also an excellent demonstration of how real-time data collection and visualization can be achieved using readily available open-source tools. To monitor the ISS location and trajectory, we'll demonstrate how to set up a simple cron job to fetch it's coordinates every five minutes, parse the data into a suitable format, and visualize it on a Grafana Geomap dashboard.
While this project is engaging and educational, it also mirrors the foundational practices of monitoring and analytics in the software industry. SaaS companies rely heavily on real-time data to monitor application performance, user engagement, and system health. Implementing a similar setup in your technology infrastructure allows you to collect/process metrics, and visualize key performance indicators to allow for proactive decision-making within your company.
If you want to follow along and don't already have an account with MetricFire, sign up for a free 14 day trial HERE. This will provide you with the necessary data source and visualization tools to move forward with this example.

Fetching the ISS Location
The Open Notify API provides real-time data about the ISS's current position, e.g:
curl -s http://api.open-notify.org/iss-now.json
To retrieve this data on a schedule, here's an example of a cron job configured on a Linux server:
*/5 * * * * curl -s http://api.open-notify.org/iss-now.json | jq -c '{"lat": .iss_position.latitude|tonumber, "long": .iss_position.longitude|tonumber}' > /tmp/iss_position.json
The above command will execute every 5 minutes and call the public ISS API. Using jq to parse the JSON response extracts the latitude and longitude as numeric values (ensuring compatibility with Graphite). This data is then written to a file in the server at: /tmp/iss_position.json and is updated after each API call.
Use Telegraf to Collect and Forward the Coordinates
Telegraf is an easy to use monitoring client compatible with many operating systems that has a Graphite output plugin, and many useful input plugins for collecting a wide variety of system metrics. If you don't already have Telegraf installed on your machine, you can accomplish this easily with MetricFire's HG-CLI tool, which makes installing/configuring Telegraf very easy.
Just run this command on your system, and follow the prompts to install/configure/start Telegraf:
curl -s "https://www.hostedgraphite.com/scripts/hg-cli/installer/" | sudo sh
NOTE: You will need a Hosted Graphite API key to continue with this example. Once you have Telegraf configured, you simply need to enable the [[inputs.file]] plugin by adding the following code block to your /etc/telegraf/telegraf.conf file:
[[inputs.file]]
  files = ["/tmp/iss_position.json"]
  data_format = "json"
  name_prefix = "iss_position."
Update and save the file, then restart the Telegraf service:
sudo systemctl restart telegraf
Each time the cron job on your server executes, it rewrites the coordinates on the /tmp/iss_position.json file. Then Telegraf (which runs in the background) will continuously read the contents of the file, convert the data to the Graphite format, and forward the data as time series metrics to your Hosted Graphite account.
Create a Geomap Visualization with Hosted Grafana
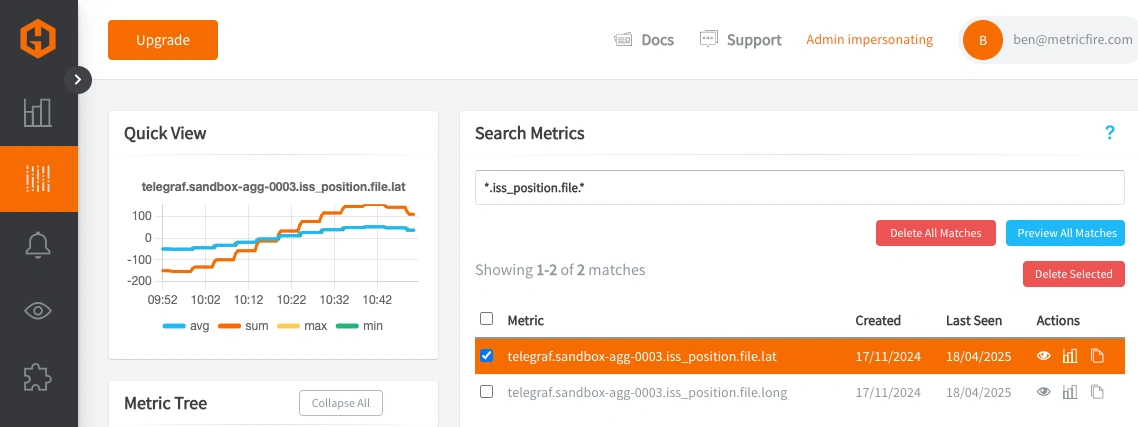
You can use your new iss_position metrics to create a dashboard in MetricFire's Hosted Grafana. In this step, we'll detail how to use these metrics with Grafana's Geomap panel. Login to your HG account to see the ISS metrics in the Metrics Search UI (prefixed with telegraf.<host>.iss_position):
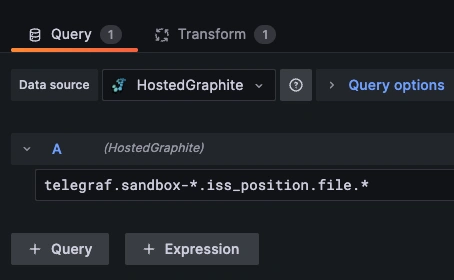
Navigate to Dashboards => and + Add New to create a new dashboard panel. Then enter the panel in 'Edit' mode to query the latitude/longitude metrics that are being stored in the HostedGraphite data source:
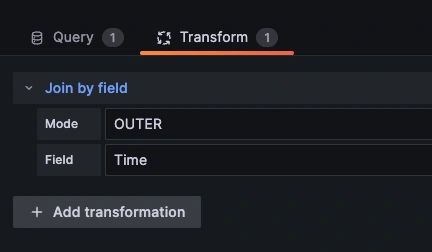
Now you need to transform your query. Since your data comes from multiple queries, use the "Join by field" transformation to combine them based on the time field:
Now select the 'Geomap' visualization option, select 'Coords' for the Location Mode, and add the corresponding latitude/longitude metrics:
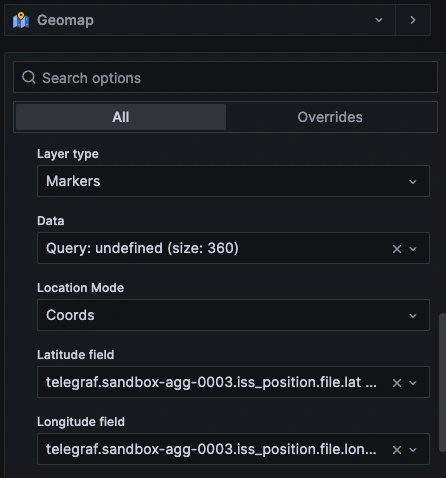
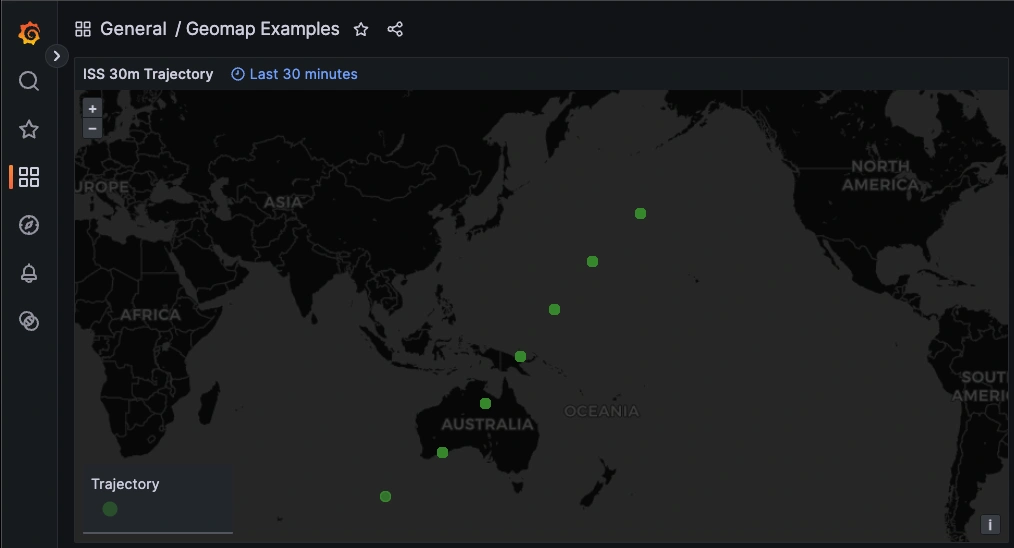
Now your Geomap panel will display the trajectory and current location of the ISS, and is updated with each API call (from the cron job running every 5min):
Conclusion
What begins as a hobbyist's project can serve as a microcosm of the data monitoring and visualization strategies employed by many software companies. The tools and techniques used are the same components that underpin robust monitoring systems in production-level environments.
For most SaaS businesses, the ability to monitor real-time metrics is crucial for maintaining service reliability, optimizing user experience, and driving growth. By adopting similar methodologies, companies can gain insights into user behavior, system performance, and operational efficiency. This not only enhances the ability to respond to issues promptly but also supports strategic planning and continuous improvement. In essence, this project exemplifies how open source tools can be leveraged to build powerful monitoring solutions, bridging the gap between a fun experiment and a critical business function.
Want to learn more about observability and infrastructure monitoring? Book a call with us today to start a conversation!


