

Table of Contents
Great systems are not just built. They are monitored.
MetricFire runs Graphite and Grafana as a fully managed service for growing engineering teams, taking care of storage, scaling, and version updates so your team doesn't have to. Plans start at $19/month, billed per metric namespace rather than per host, and include engineer-staffed support. Integrations work natively with Heroku, AWS, Azure, and GCP, and data is stored with 3× redundancy in SOC2- and ISO:27001-certified data centres.
Introduction
Monitoring infrastructure is an essential process for any organization. It is crucial to have visibility into the operations of your systems to detect and resolve any issues that may arise. It ensures the performance, accessibility, and security of your systems and applications. Fortunately, various tools, notably the open-source monitoring system Graphite, can assist with this. In this article, we will define what infrastructure monitoring is, the benefits of Graphite Monitoring, and how to monitor your infrastructure using Graphite.
Do you want to get a comprehensive system overview without spending much time configuring it? Then MetricFire is the perfect product for you! Our monitoring solutions can provide in-depth data and analysis quickly and easily. To find out more, schedule an informative demonstration with us or take advantage of our free trial offer today!
Infrastructure Monitoring
Infrastructure monitoring is critical to managing modern, complex systems, ensuring seamless connectivity, and optimizing overall performance. By continuously gathering data on system components and analyzing them in real-time, infrastructure monitoring allows IT professionals to identify potential problems early, troubleshoot existing issues, and maintain peak performance. This data-driven process also facilitates informed decision-making, allowing professionals to allocate resources strategically and update infrastructure components as needed.
As a part of a comprehensive IT management strategy, infrastructure monitoring fosters a proactive approach to system maintenance. It plays a vital role in preventing unplanned downtime, boosting productivity, and safeguarding essential data. In today's fast-paced and ever-evolving technology landscape, infrastructure monitoring remains indispensable for businesses seeking to maintain an edge in their industries.
What is Infrastructure Monitoring?
Infrastructure monitoring proactively tracks and manages systems' performance, availability, and security as part of an organization's IT infrastructure. It helps ensure that all system components work together to meet the needs of users and customers. Organizations can achieve better customer experience and more efficient operations by creating an environment optimized for performance.
Infrastructure monitoring requires a comprehensive understanding of all components within an IT infrastructure. This includes hardware, software, networks, applications, services, processes, and end-user experience. It also involves analyzing system data to identify trends or anomalies to improve performance.
Organizations must use specialized tools such as monitoring software or hardware sensors to monitor IT infrastructure properly. These tools are used to collect data from all components in the system and alert administrators when something goes wrong or if there is a potential issue on the horizon. With this information at their fingertips, administrators can make informed decisions about optimizing their systems for maximum efficiency and reliability.
Why is infrastructure monitoring crucial for any organization?
-
Infrastructure Monitoring Helps Detect Issues Early On:
One of the key benefits of infrastructure monitoring is that it helps identify issues early on before they become significant problems. Businesses can discover potential challenges by collecting and analyzing data in real-time before they become severe issues.
This enables them to take proactive efforts to remedy them before they cause irreversible damage or costly downtime. Also, businesses can plan and have solutions ready when needed by predicting when a system might have issues.
-
Infrastructure Monitoring Increases Efficiency:
Another benefit of infrastructure monitoring is enhancing efficiency within a business. Organizations can prevent costly downtime by spotting potential concerns before they become serious problems and directing resources to more productive tasks.
Also, by having precise reports regarding their IT systems’ performance, businesses may make informed decisions about how best to employ those resources for optimal efficiency.
-
Infrastructure Monitoring Enhances Security:
One critical benefit of infrastructure monitoring is that it helps enhance security within an organization’s IT systems. By collecting data from multiple sources and analyzing it in real-time, organizations can identify potential threats quickly and respond accordingly with appropriate security measures such as patching vulnerable software or taking other corrective actions.
Additionally, by spotting suspicious activity quickly, organizations can act swiftly to prevent cyberattacks or other malicious activity from occurring in the first place.
Graphite
What is Graphite, and How does it work?
Graphite is an open-source monitoring tool that enables the collection of time-series data from several sources. It uses a simple text-based protocol called Carbon or Pickle to receive data from other services or apps. By collecting data from numerous sources in one location, Graphite makes it easier for users to comprehend the performance of their system. You will be able to observe how different components perform to one another, which can be extremely valuable for diagnosing problems.
The operation of Graphite is relatively simple. First, users must install the application on the server or application. Once deployed, it will collect data from databases, web servers, and application logs, among other sources. The collected data is saved in a database that may be searched using bespoke queries or through a web interface supplied by Graphite. Queries can also generate graphs that help visualize the monitoring tool's collected data. This makes it far easier for users to recognize trends or potential system performance issues.
Benefits of Graphite Monitoring
-
Data Visualization:
Graphite monitoring provides graphical representations of system data, which makes it easier for administrators to identify trends or anomalies quickly. This allows them to spot potential problems more efficiently and take corrective action sooner rather than later. The graphical representation also helps administrators better understand how their systems perform over time, making troubleshooting easier.
-
Alerts and Notifications:
Administrators can configure Graphite monitoring to send alerts or notifications when certain thresholds are met or exceeded. This ensures that administrators can address any potential problem quickly before it has a chance to cause significant disruption or downtime. Administrators can also configure Graphite to send out notifications when the performance of a system or application deviates from an expected range or standard operating conditions. This allows administrators to make sure their systems are always running optimally.
-
Scalability:
One of the most significant advantages of graphite monitoring is its scalability; it can easily handle multiple servers and hundreds of metrics without substantial performance degradation. This makes it ideal for organizations with large infrastructures needing comprehensive and detailed real-time reporting on their systems’ performance. It also allows organizations to deploy new applications and services more quickly since they don’t have to wait for existing tools or processes to catch up with their growth plans.
Graphite Architecture
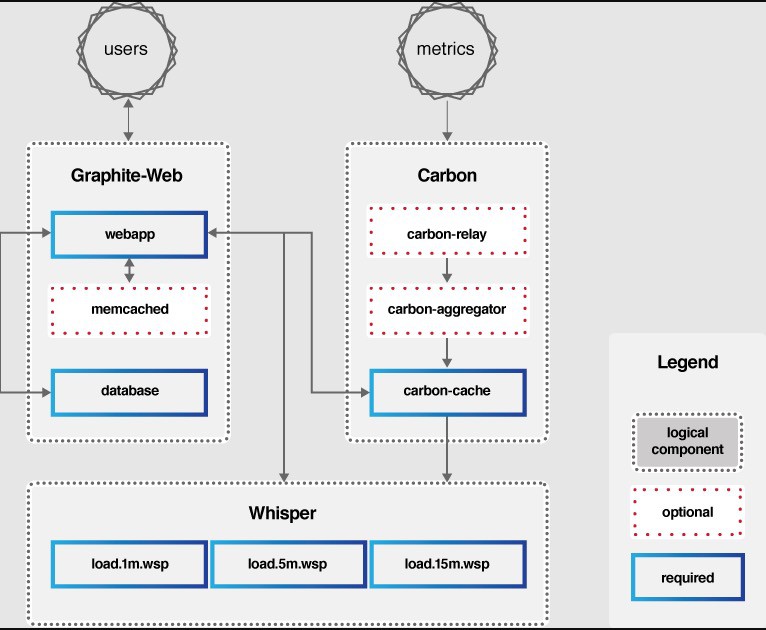
Source: https://graphiteapp.org/
How to Integrate Graphite with Your Infrastructure?
Basics of integrating Graphite monitoring with your infrastructure so that you can take advantage of its powerful features:
Metrics Collection
The first step in integrating Graphite monitoring is collecting the data you want to track. You can do this using an agent-based system like StatsD or collectd, which makes it easy to gather metrics from your applications and servers. Alternatively, you can use a log-based system such as Fluentd or Logstash to collect logs from various sources and then forward them to Graphite for analysis. Once the data has been collected, data-collecting agents must send it to Graphite for further processing.
Metrics Forwarding
Once the data has been collected, it must be sent to Graphite for further processing. This is done using a message broker like RabbitMQ or Apache Kafka or a streaming protocol like MQTT or gRPC. The type of protocol used will depend on the type of data being sent and where it’s coming from. For example, a message broker may be more suitable than a streaming protocol if you collect logs from multiple sources.
Metrics Visualization
Finally, once the data has been forwarded to Graphite, it needs to be visualized to be helpful. This can be done using Grafana or another tool that supports Graphite’s API. With these tools, you can create custom dashboards that display your metrics in real-time so that you can quickly identify any issues with your infrastructure and take action accordingly. Many of these tools also allow you to set alerts to be notified if certain thresholds are met or exceeded.
MetricFire offers a comprehensive monitoring solution, utilizing Graphite and Grafana-as-a-service to track performance metrics.
Conclusion
Infrastructure Monitoring with Graphite is essential for organizations looking to stay ahead of their performance and security health. Graphite offers superior scalability, alerts and notifications, data visualization, and much more - enabling easy integration into your infrastructure. You can monitor IT infrastructures reliably and efficiently with metrics collection, forwarding, and visualization components that work together harmoniously.
Investing the time to integrate Graphite into your IT infrastructure could be the first step towards a secure, productive work environment that future-proofs your business. Embracing the benefits of infrastructure monitoring will help you remain compliant with regulations while improving the uptime of your IT services – something all companies should strive for!
Unlock powerful insights into your environment with MetricFire's Hosted Graphite. Our product offers a two-year data storage solution, intuitive Grafana dashboards for visualization, and much more - all with minimal setup time! If you want to learn more about what we can do for you, book a demo or sign up today to start your free trial!


