


Table of Contents
Great systems are not just built. They are monitored.
MetricFire runs Graphite and Grafana as a fully managed service for growing engineering teams, taking care of storage, scaling, and version updates so your team doesn't have to. Plans start at $19/month, billed per metric namespace rather than per host, and include engineer-staffed support. Integrations work natively with Heroku, AWS, Azure, and GCP, and data is stored with 3× redundancy in SOC2- and ISO:27001-certified data centres.
Introduction
This post will look at different tools and strategies for Network Performance Monitoring.
To follow along with this blog article, book a demo and sign up for MetricFire's free trial. During this trial, many of our customers do network performance monitoring using the Hosted Graphite service. These tools are part of MetricFire's offering.
What is Network Performance Monitoring
Network Performance Monitoring is monitoring the performance of your organization's network, which connects applications to your users and partners. It is the backbone of any IT services / digital company today.
Network performance monitoring is one of organisations' most critical business functions. This is because a breakdown in any of the network lines can cripple the entire suite of applications that depend on those networks.
An organization is likely to suffer financial loss during network downtime and brand damage because of the “network effects” in social media.
Thus, it is very important to set up proper monitoring and alerting for all of your network infrastructure. Any issue or outage should be detected immediately so that it can be mitigated.
Tools available for Network Performance Monitoring
There are various tools available in the market available for network performance monitoring. We are going to take a quick look at some of these to give you a feature comparison so that you can make an informed decision when opting for one of these tools for your own network monitoring.
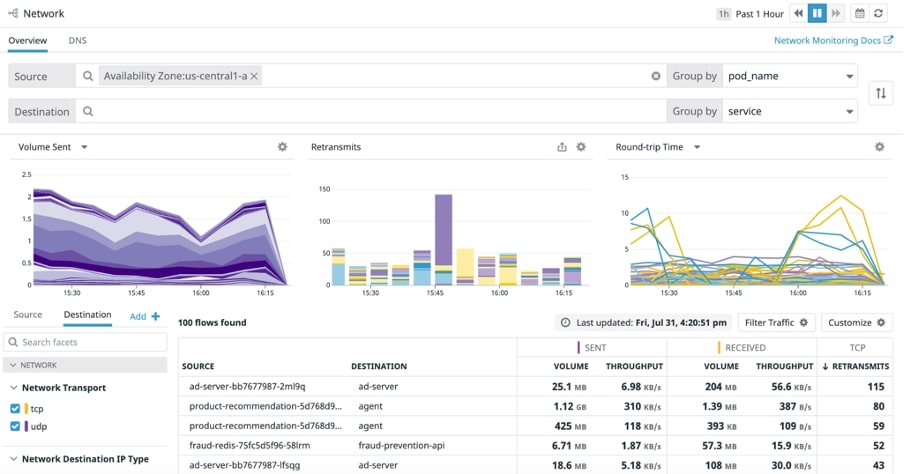
Datadog Network Performance Monitoring
Datadog network performance monitoring integrates into the existing Datadog monitoring suite. Available for monitoring Linux Hosts and Windows (in beta), it gives a view of network performance from hosts, containers, services, and cloud regions.
It can monitor key network metrics such as TCP retransmits, latency, and connection churn. Datadog claims to use eBPF tracing technology for network monitoring on the hosts, which provides low overhead. As with other monitoring tools, Datadog requires a special agent to be installed and run on each host to be monitored.
PRTG Network Monitor
PRTG is another popular network monitoring tool. One of the critical differences in PRTG Network Monitor is that it is agentless, i.e., it does not require an agent to be installed and run on each of the devices or hosts that are to be monitored.
PRTG uses a variety of publicly available APIs, technologies such as Simple Network Management Protocol (SNMP), and sensors to retrieve information and services on the hosts. The PRTG sensors page gives the full list of available and supported sensor types.
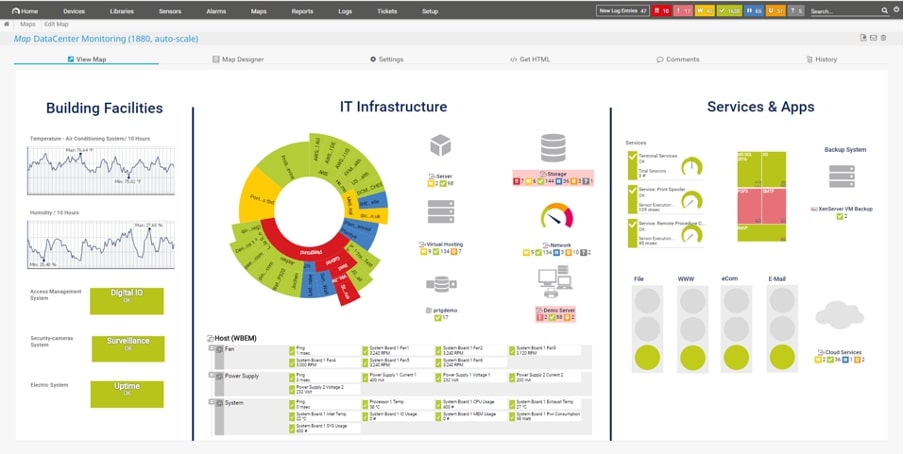
It is worth mentioning that though the PRTG monitor itself is agentless, it does require a powerful Windows Server Machine to install and run the tool. Many organizations completely rely on open-source Operating Systems such as Linux / Unix.
As of this writing, according to PRTG Network Monitor, a license for 1,000 sensors is enough to monitor about 100 devices.
Pros:
- Agentless. Does not require any agent installations.
Cons:
- Requires investment into Windows Server machines.
Get started with a quick MetricFire demo today or a 14-day free trial to take charge of your network performance! We can integrate with your existing platforms to produce top-of-the-line performance metrics.
SolarWinds Network Performance Monitor
SolarWinds is another tool for Network Performance Monitoring. SolarWinds offers features such as network availability monitoring, critical path visualization, intelligent mapping, performance analysis, and advanced alerting, which are the key features of its network monitoring suite.
Just like the PRTG Network Monitor, setting up SolarWinds Network Monitor requires heavy investment in Windows Server Machines for the installation of the tool. SolarWinds offers real-time statistics from SNMP-, API-, or WMI-enabled devices. SolarWinds Network Performance Monitor also integrates with its Orion Platform.
Pros:
- Agentless. It uses publicly available technologies such as SNMP to monitor the hosts.
Cons:
- It requires investment in Windows Server machines and licenses. Recently, SolarWinds software was used in a cyberattack. However, as per the company, the vulnerability has been patched in the latest versions since then.
Network Performance Monitoring using Hosted Graphite and Hosted Prometheus
MetricFire's Hosted Graphite is based on open-source Graphite and provides powerful network performance monitoring capabilities. One key advantage of MetricFire's tools is that since they are based on open-source tools, they are completely customizable and offer higher flexibility than other tools, such as those based on proprietary agents.
Thus, users can customize the monitoring and alerting capabilities using customized shell scripts that pull the required data from the hosts and push it to Hosted Graphite. One other advantage with Hosted Graphite and Hosted Prometheus is that they are designed to be completely cloud-based. They do not require any software installation whatsoever on the user's on-premise hosts.
Pros:
- Based on open source tools. Does not require investment into Windows licenses.
- Cloud-based as a first-class citizen.
Cons:
- Might have a slightly higher learning curve for non-IT professionals
Conclusion
When choosing a solution to evaluate and eventually implement, you should consider budget, convenience, scope, and scalability. If you have been tied to a legacy vendor for too long, feel free to explore solutions in the cloud or from different vendors.
Numerous network monitoring solutions are available, from open-source configure-it-yourself software to tailored turnkey solutions that meet your environment's specific parameters, whether on-premise or in the cloud. MetricFire brings the best of both worlds by offering a hosted open-source solution.
To get started immediately, sign up for MetricFire's free trial of our Hosted Prometheus and Hosted Grafana. Also, if you have any questions about our products or how MetricFire can help your company, talk directly to one of our experts by booking a demo.


