
Table of Contents
Introduction
Today, Heroku is used by many developers from a wide range of small to large enterprise-size companies. As you are reading this article, you yourself may also be using Heroku to build and operate apps. So, how do you monitor the apps you run on Heroku? It is seen that many people are using Heroku metrics given its standard built-in feature and it is being offered for free.
Heroku metrics is equipped with the ability to monitor application performance and alerts you when needed, with little deployment cost, allowing you to monitor metrics. But can Heroku metrics really do enough when it comes to monitoring your apps? Unfortunately, the answer is no.
In this article, I'll explain how the Hosted Graphite provided by MetricFire, can be used as a simple Heroku add-on and is a great way to monitor. I will also shed light on why Hosted Graphite is more feasible to use rather than Heroku metrics for your business needs.
If you would like to learn more about how MetricFire’s Hosted Graphite can improve your monitoring, please book a demo with us, or sign up for the free trial today.
Problems with Heroku metrics, and why Hosted Graphite is an alternative
Data retention period
Heroku metrics data retention only lasts for 7 days. In short, you cannot see data from 7+ days ago. The problems and drawbacks that can occur due to this short data retention period are as follows:
- Users can't compare weekly performance changes if they make any changes to the data.
- Users can't tell if the data has returned to its normal state after an incident occurs.
- If users haven't seen the data for a week, they can't go back to see the metrics from a week ago.
- Since the data cannot be monitored and compared over the long term, future trends of the data cannot be predicted.
- These issues can be fatal to developers, as one should never be satisfied with monitoring only 7 days worth of data.
Hosted Graphite data retention period
If you use Hosted Graphite, the data retention period is dependent on your plan.
|
Plan |
Data retention |
|
$19 |
6 months |
|
$449 |
12 months |
|
$1699 |
24 months |
Above you can see our starting prices for retention options on our plans. To see all of our available pricing options, see our addon page.
MetricFire’s Hosted Graphite can offer different plans to suit your development needs. You can start with a free trial today, or book a demo with us to see what plan would suit you best.
Data resolution
An example of the resolution of the Heroku metrics data can be seen below:
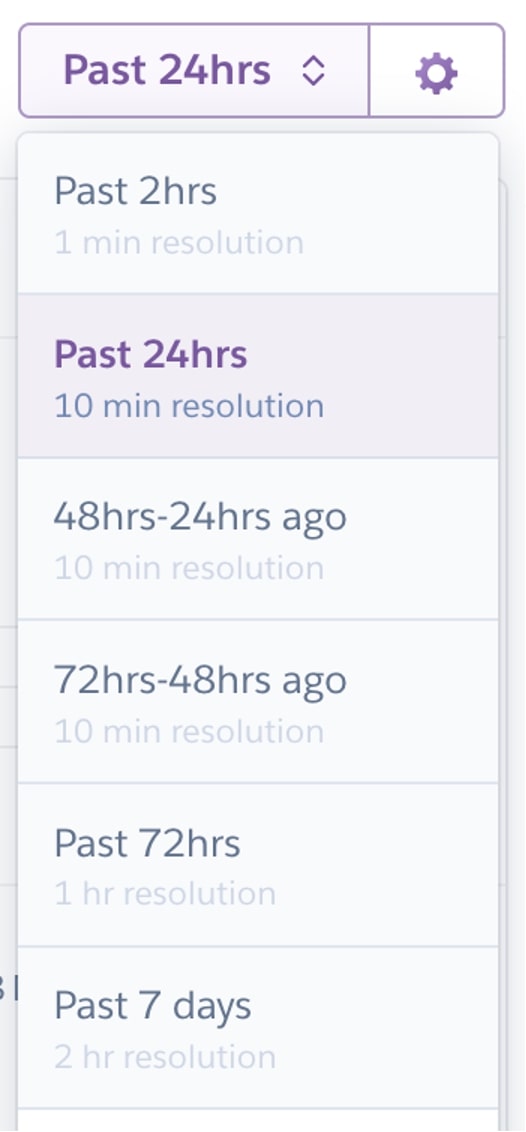
The data for the past 2 hours can be viewed in the data point display at 1-minute intervals which is great. However, for the data retained before 2 hours or more, the resolution drops at once, and it becomes a 10-minute interval. In addition, after 3 days, the resolution will be 1 hour apart, which will further prevent proper monitoring.
If you try to resolve a problem that occurs when it's been more than 2 hours, it can be quite difficult to investigate what kind of problems took place. This is due to the increasing resolution as time passes on.
Hosted Graphite data resolution
On our Heroku plans, we offer 30 sec on all our plans. Please refer to the table below:
|
Plan |
Resolution for last 24 hours |
Resolution for last 24 hours - 72 hours |
Resolution for last 72 hours - 180 days |
Resolution for last 180 days - 2 years |
|
$19 |
30s |
30s |
5min |
N/A |
If you happen to use the data view function of Hosted Graphite and check the max value and min value of the data, you will be able to confirm, in detail, what happened using the feature due to the shorter resolution times.
Alert
Heroku metrics alerts are very limited. It allows users to set up only 2 types of alerts. One is the response time and the other is the failed requests. In terms of response time, if it reaches 95%, an alert is triggered.
Users also cannot change the percentage. In short, even if you want to set a threshold for memory usage, etc., you cannot do it. Though it may be unnecessary for the user to check for this particular metric.
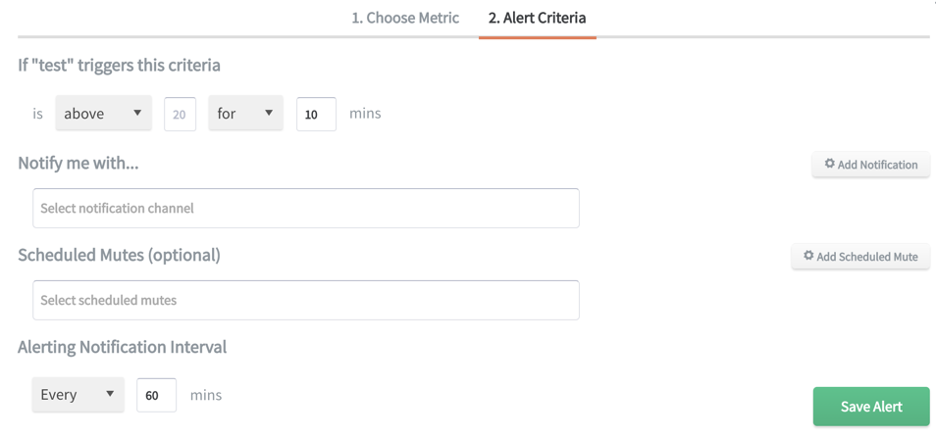
Hosted Graphite alert
In comparison, MetricFire’s Hosted Graphite alert settings are extremely flexible. And threshold levels can be set for more than two functions. In addition to this, the threshold setting is also quite flexible. There are big advantages such as setting the data above or below a certain criteria, and also setting the notification to be sent to communication tools such as PagerDuty, Slack, etc. for each alert.
After all, setting accurate alerts will significantly reduce the time spent on monitoring. Therefore, it may be in your best interest to consider switching to MetricFire’s Hosted Graphite. So, go ahead and book a demo and avail our free trial.
Visualization
This is an example of the dashboard that is available when using Heroku metrics.
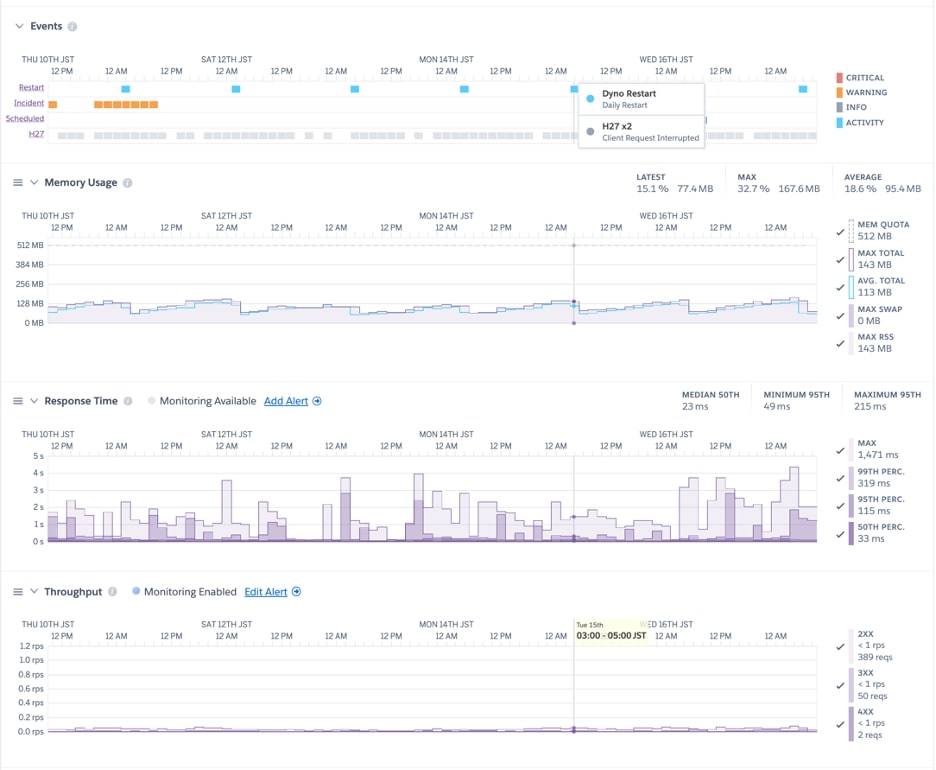
In my opinion, it is beautifully visualized and is pleasing to the eye, so I wouldn’t fault anyone who likes or prefers this style. However, that opinion may change after trying Hosted Graphite.
Hosted Graphite visualization
Hosted Graphite is visualized in Grafana. I believe Grafana has a great UX due to its colorful and beautiful appearance. This colorful and cool dashboard has been attracting many engineers.
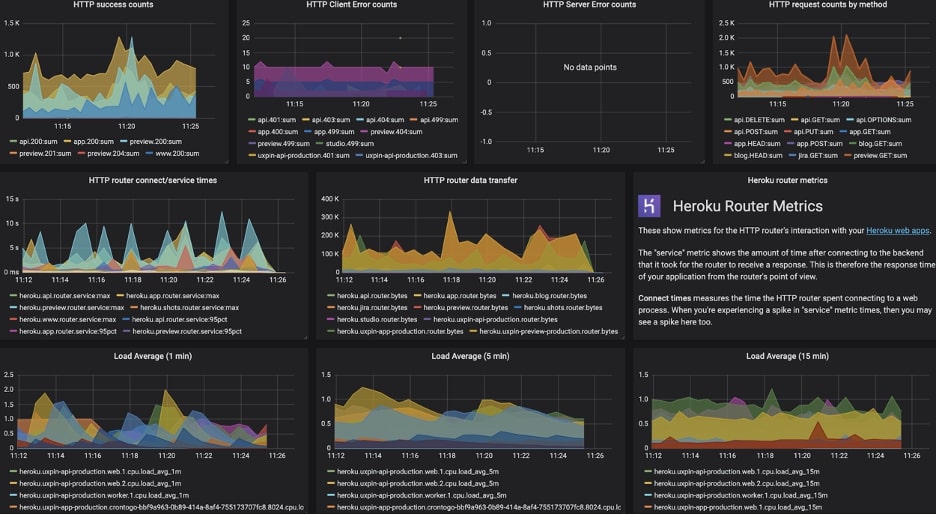
Grafana's dashboard can also do things that Heroku metrics is incapable of doing. They are:
- Graphs can be customized freely
- Users can filter the time settings
- Zoom in/out capabilities
- Easy to set up default graphs, like the one above, can be created automatically when you start using it
Due to these features, you should be able to perform higher levels of monitoring on Grafana.
Data liberation
By storing metrics in Hosted Graphite, you should be able to consolidate, aggregate and summarize your metrics to generate more visibility, such as Cxx-level or company-wide metrics, e.g., (Service-level agreement (SLA).

Installing Hosted Graphite on Heroku
If you want to use the Hosted Graphite add-on on Heroku, first go to the HG Heroku Monitoring & Dashboards page. Once it has been installed, start sending your Heroku data to Hosted Graphite. Please refer to this document on how to do this.
If you don't see the Grafana dashboard template installation, go through the dashboard creation process for more information.
All these processes are relatively simple and should take you about 10 minutes to complete. If you get stuck and need support, a good idea is to book a quick demo with us and get help on the introduction to the platform. You will receive help immediately from our trained MetricFire experts.
Roadmap
Furthermore, plans are on the way to make monitoring your Heroku apps and infrastructure even more plug-and-go:
- Auto-alerting based on:
- Heroku log warning, e.g., “R15 Memory Exhaustion critical”
- Historical threshold anomaly detection.
- Auto-scaling based on CPU, and memory thresholds to supplement Heroku’s response time-only threshold auto-scaling.
We love and appreciate feedback for improving our products, so let us know what is most important to you and your monitoring needs, to help us prioritize our future roadmap.
Conclusion
Heroku metrics are very tempting to use as it free and are available as a standard feature on Heroku. However, as a full-scale monitoring tool, you may be dissatisfied with its current limitations with regard to its functionality.
With MetricFire's Hosted Graphite, you'll get far better features in terms of data retention, resolution, alerts, visualization, and more. This will dramatically improve the quality of your monitoring thereby making your product perform at its best.
If you are unsure about how to get started and want to know more information and other features about Hosted Graphite, go ahead and avail your free trial and book a demo with us! Our MetricFire experts will be happy to assist you.
This article was written based on feedback from our customer's UXpin experience. We appreciate the feedback from Naohiro Takahashi.

