
Table of Contents
Great systems are not just built. They are monitored.
MetricFire runs Graphite and Grafana as a fully managed service for growing engineering teams, taking care of storage, scaling, and version updates so your team doesn't have to. Plans start at $19/month, billed per metric namespace rather than per host, and include engineer-staffed support. Integrations work natively with Heroku, AWS, Azure, and GCP, and data is stored with 3× redundancy in SOC2- and ISO:27001-certified data centres.
This is a short guide on getting system performance monitoring setup on your Arch or Arch-based machine using MetricFire and collectd.

This article is intended for people who don't have a lot of experience with using collectd, Graphite, and Grafana - and for people who don't have much experience in performance monitoring in general. As there are not many people using an Arch machine for monitoring, this article compiles information from these search terms:
what is Grafana and Graphite
what is Grafana
what is Graphite Linux
Linux collectd docs
Arch Linux collectd and Graphite
get collectd to send metrics
check if collectd is working
where does collectd store metrics
Going through this article should smooth out the process of setting up a system performance monitor on an Arch machine. A few components need to be understood before we get started.
RRDtool: Short for Round Robin Database Tool, it stores metric data in the format of timestamp: metric_value in a database with the file extension .rrd.
collectd: This is a program that is a daemon (an always-running process), that can collect system performance data and store it with RRDtool. The default folder location on Arch is typically /var/lib/collectd/rrd when using RRDtool to store the data, though you can also configure it to send metrics to a remote service like Hosted Graphite for centralized monitoring.
Graphite: This can receive metrics data from any supported source and store it in its own Graphite database.
Grafana: This can graph your metrics data that is stored in your Graphite database or any other supported database.
Hosted Graphite: This is a hosted version of the open-source Graphite that automatically applies Grafana for visualizations. Hosted Graphite is one of the products offered by MetricFire, alongside Grafana. Hosted Graphite pretty much handles the setup for everything, and all you need to do is send it metrics with your API key. Sign up for the free trial and use it to follow along with this article.
Using MetricFire will let us skip the process of setting up Graphite and Grafana. Below is a chart on what Hosted Graphite can do for us:
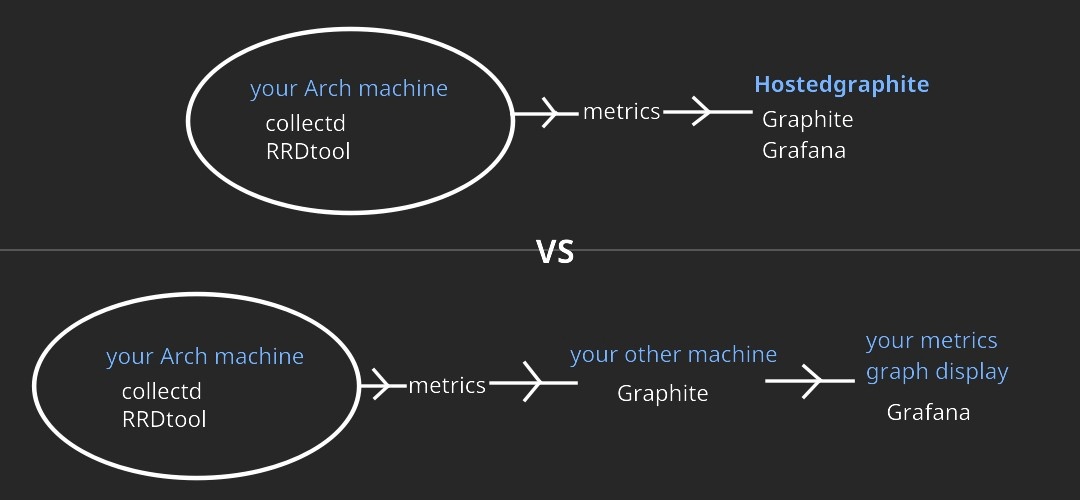
As you can see, Hosted Graphite does most of the heavy lifting for us and significantly simplifies the process of setting up a performance monitoring system. The general idea of this chart also applies to anything else you may want to monitor, but the setup process will be slightly different based on your monitoring environment.
Setting up MetricFire with collectd
First, we will make an account with MetricFire, and it should automatically start you off with a 14-day trial. Then let's install collectd and rrdtool. Use the code below:
sudo pacman -S collectd

sudo pacman -S rrdtool
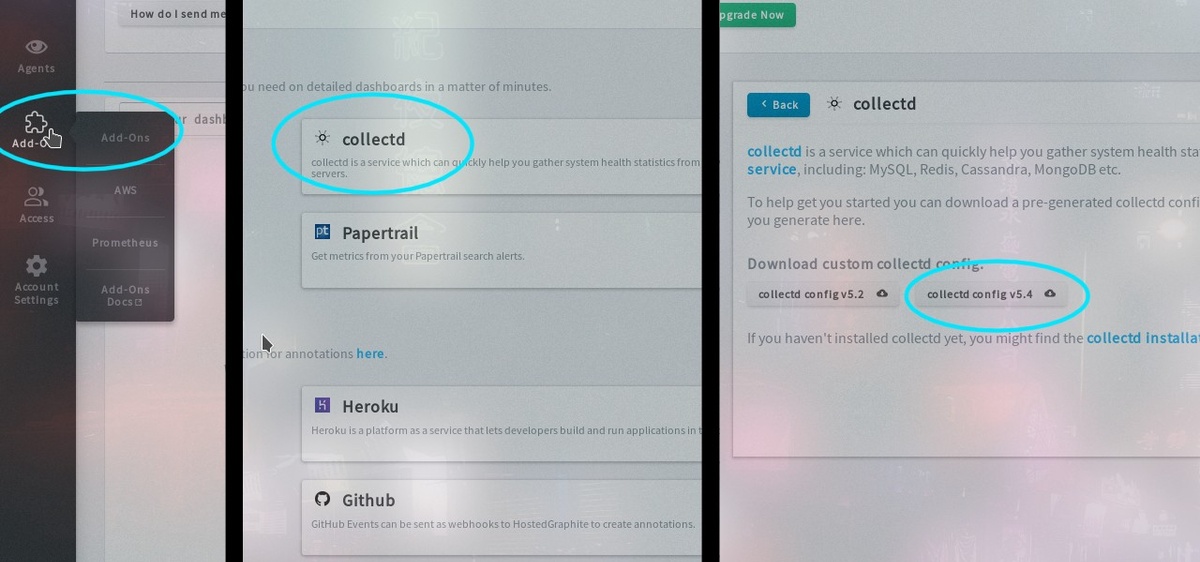
Next, we will retrieve our preconfigured configuration file from Hosted Graphite. Go to your main overview, then go to add-ons, collectd, and download config 5.4. Check the image below for reference.
Then we want to move the file we just downloaded into the proper directory, which on Arch is/etc. Go into the directory with the file that was just downloaded, and move it using the terminal with sudo mv collectd.conf /etc. If there is already a config file in /etc, remove it with sudo rm /etc/collectd.conf. This config file should already have a preset with your API key in the write_graphite plugin parameters.
Now let's start and enable collectd. Use this code below:
sudo systemctl enable collectd
sudo systemctl start collectd
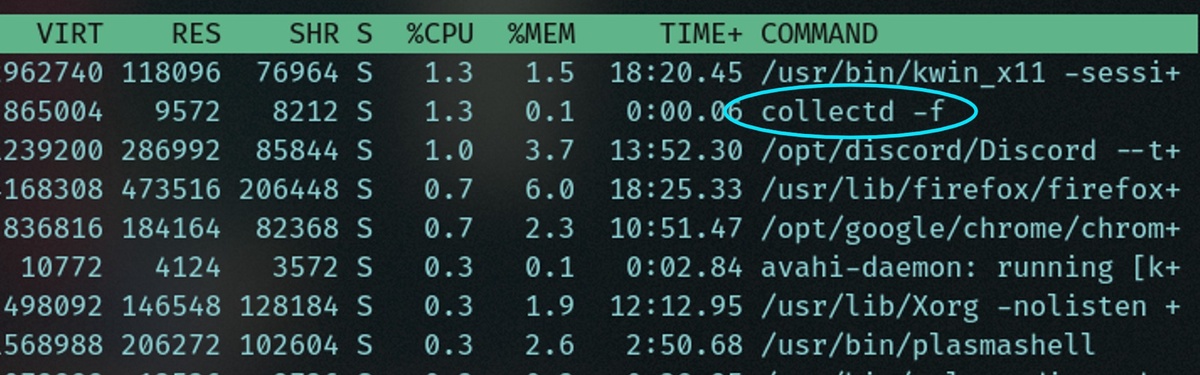
To check if collectd is working you can use top, and then a process called collectd -f should blink on and off.
To check whether collectd is storing data locally, we can use the rrdtool last command: rrdtool last FILEPATH. This will return a timestamp value that looks like a big integer.
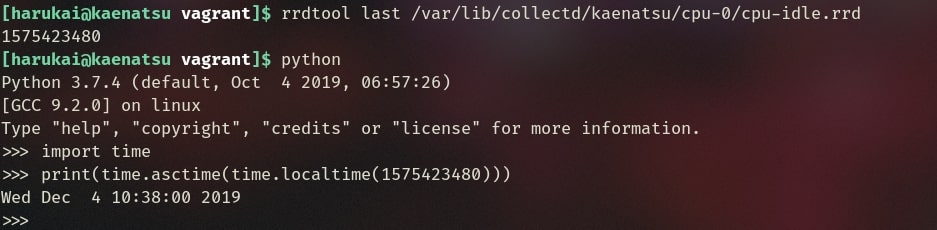
We can use the small script below to make the big integer more readable. Check the image above to see the script in action.
import time

# replace the big int with the `rrdtool last` output

print(time.asctime(time.localtime(1575423480)))
By this time, metrics on your system performance should have been sent to MetricFire. Check your metrics by going to your overview, hovering over Metrics, then clicking Metrics Treemap. You should see a giant collectd box, and you can click through it to check what it contains.
MetricFire’s Grafana Dashboards
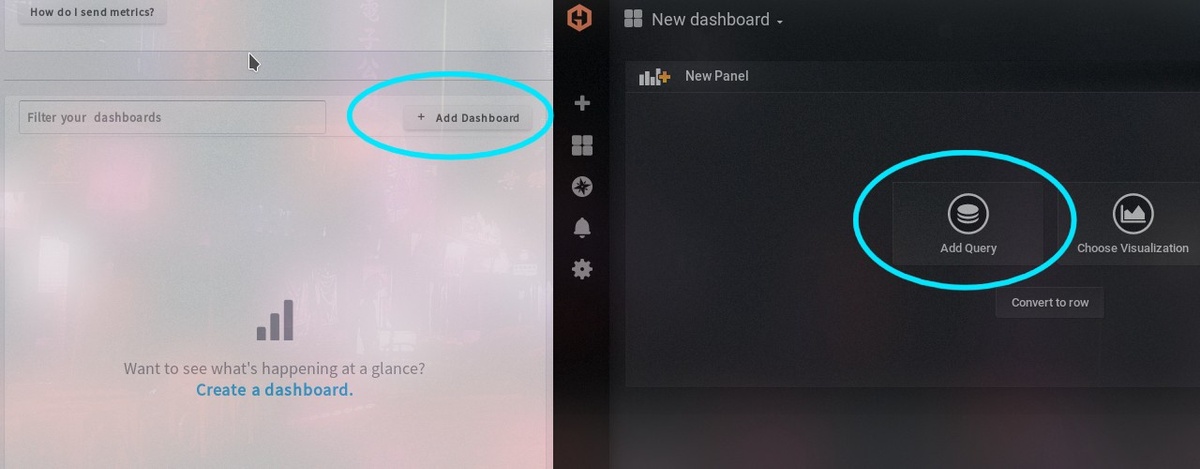
After setting up our metrics to be sent to Hosted Graphite, Hosted Graphite now uses that data to create graphs. Let’s go to Add Dashboard and then Add Query to add a visualization to our graph panel. Check the image for reference:
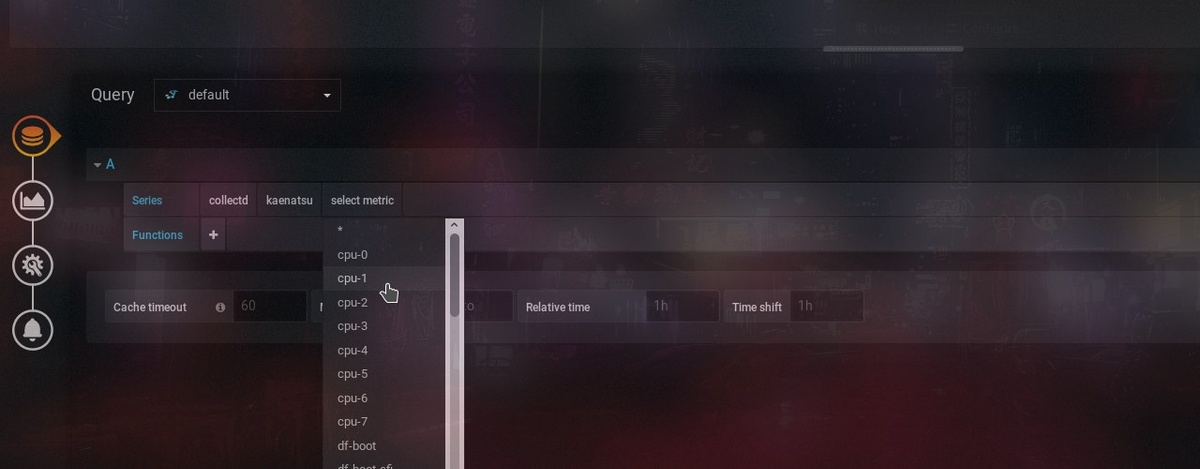
You can query by clicking Select Metric, then entering only the first word from your Metric Treemap. It should give options on what you have if you go one by one. We can do collectd -> HOSTNAME -> cpu-* -> cpu-user to find how much CPU the user is using (* for all cores). Check the image below for reference.
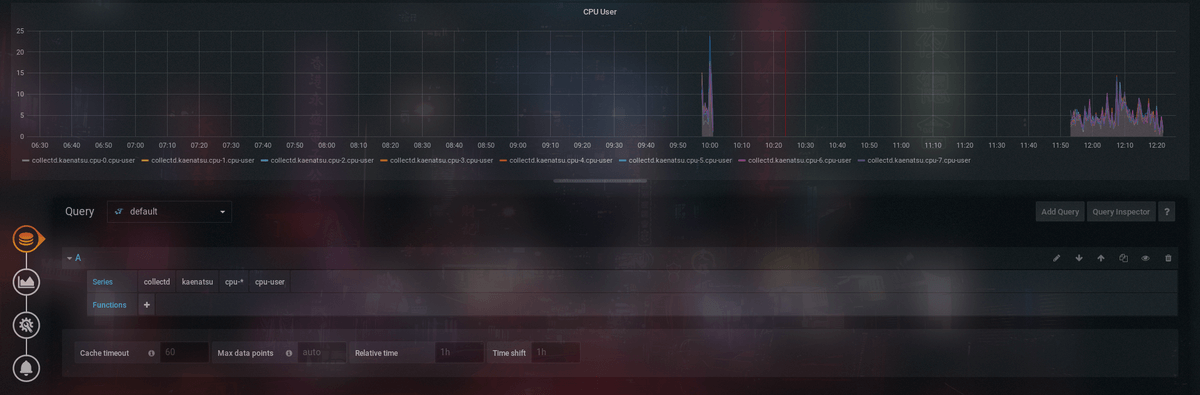
Now the graph should populate with some data points, and you have made your first graph.
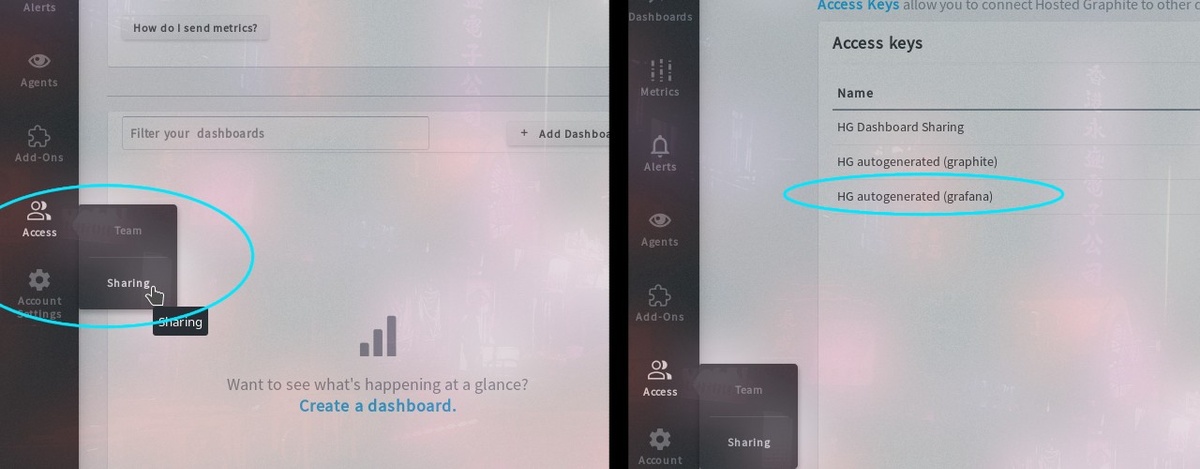
There are several other options to play around with when creating your graph, but this should get you started quickly so you can have time to explore. To externally link the graphs, use the access keys provided by going to Access in the left-hand menu, then clicking Sharing. Check the image below for reference.
Personal Applications
While system performance monitoring would be most useful for web app servers for several reasons, it could also be useful for personal applications. For example, we could use a personal laptop’s metrics to determine a good time to charge it. This app could also integrate with your calendar to show when you will be away from an outlet for a long period, so it can notify you if you should charge your battery. There are several personal applications for which this could be useful.
Regardless of the OS system you plan to monitor and your purpose for monitoring, MetricFire can save a lot of time setting up that system. All you need to do is send metrics to your MetricFire account, and all the heavy lifting is done there.
Get to know MetricFire better, and check out how MetricFire can fit into your monitoring environment! Get a free trial and start monitoring right away. Feel free to book a demo if you have questions about what MetricFire can do for you.


