

Table of Contents
Great systems are not just built. They are monitored.
MetricFire runs Graphite and Grafana as a fully managed service for growing engineering teams, taking care of storage, scaling, and version updates so your team doesn't have to. Plans start at $19/month, billed per metric namespace rather than per host, and include engineer-staffed support. Integrations work natively with Heroku, AWS, Azure, and GCP, and data is stored with 3× redundancy in SOC2- and ISO:27001-certified data centres.
Introduction
As businesses embrace more cloud-native technologies and IT infrastructure becomes more dispersed, they must connect their business goals and end-user experience with the availability and performance of their IT infrastructure. This change necessitates infrastructure monitoring to assure compatibility with cloud environments, operating systems, storage, servers, virtualized systems, and other components.
What exactly is infrastructure monitoring, and why is it more important than ever for cloud-native architectures? This article provides a basic overview of infrastructure monitoring, its importance, and an actual dashboard that illustrates how it can be implemented.
Key Takeaways
- Infrastructure monitoring is crucial for tracking IT resources and processes to enhance performance.
- The benefits of infrastructure monitoring include reduced expenses, simplified support workload, and increased uptime assurance.
- Monitoring aids in effective protection against security breaches and ensures IT resource reliability.
- Improved user experience and increased ROI are outcomes of efficient infrastructure monitoring.
What is Infrastructure Monitoring?
Infrastructure monitoring is the process of tracking and evaluating the use of IT resources, systems, and processes and then using the acquired data to improve the performance of those resources. Any endpoint or application linked directly or indirectly to the internal network of your organization is a potential risk for harmful actors seeking access to your organization's sensitive data or assets. This kind of assault may be facilitated by software and hardware components.
Additionally, any breakdown in your company's IT infrastructure might result in a revenue loss. Therefore, you must frequently check the performance and health of your infrastructure and take corrective action as required.
To perform infrastructure monitoring, consider the following factors:
Hardware Monitoring: This section focuses on the collection of data from sensors present on computers and other equipment. These include information on battery life, current and voltage sensors, fan speed sensors, and so on. Monitoring these metrics can assist you in discovering a hardware resource that is failing before its failure causes harm to neighboring resources.
Network Monitoring: This section assists in determining whether your company's internal network is operating to the desired speed and reliability criteria. With the proper tools, you can monitor the network transfer speeds and connection levels of your users. Even monitoring incoming and outgoing connections is possible. Monitoring your network may help you detect illegal network access attempts.
Application Monitoring: Application Monitoring is one of the most important components of IT monitoring. Your application is among the most exposed aspects of your website. This allows the potential for security concerns, and a tiny slowdown might cascade into a substantial loss in the company revenue. You can watch user activity on your applications and get operational insights into their use if you install the appropriate infrastructure monitoring technologies.
Why Is It Important?
Now that you understand what infrastructure monitoring is, it is time to discover why it is important and why your organization needs it. There are various benefits associated with a properly built infrastructure monitoring system. This section will address a few of the top reasons.
Reduced Operating Expenses
With a properly configured infrastructure monitoring system, you will detect and chase down issues far before they cause monetary damage. Early diagnosis and treatment will avoid the spread of problems and guarantee that your application will not lose consumers or money as a result of downtimes.
Reduction in Complexity & Support Workload
Observability across the whole infrastructure of your application enables you to decompose the complexity of your application's architecture and monitor the performance of each component independently. When you need assistance fixing challenges, monitoring comes into play again by offering valuable information about the issues.
Uptime Assurance For Users Globally
A robust monitoring framework guarantees that you've covered almost all potential error sources and are prepared to address any problems as they emerge. This guarantees that your MTTR is minimal and your application has the most uptime possible. With decentralized monitoring systems, you can protect the uptime of all your users regardless of their geographical location.
Effective Protection
Monitoring and security are always interdependent. Without a dependable monitoring system, it is practically difficult to determine when and where a security breach has happened. Logging and analyzing infrastructure events may provide insight into the performance of an application.
Enhanced IT Resource Reliability
With a strong infrastructure monitoring system, you can be certain that your IT resources will work to their fullest capacity. You will get notifications long before a resource reaches its limit and is likely to explode. As part of your infrastructure monitoring configuration, you may also include a failsafe to guarantee that the system is restricted when specific thresholds are exceeded.
Increased Company ROI
When combined, the aforementioned advantages lead to an increase in the total Return on Investment (ROI) of your organization and activities. You have fewer downtimes and can use the monitoring logs to obtain insights on how to advance your organization and maximize income.
Better User Experience
When all of your system's components are interoperable and unaffected by severe downtimes, the end-user experience for your consumers will certainly improve. Proper monitoring ensures that severe problems are avoided before they occur, and those small problems are resolved as quickly as feasible.
How Can I Use An Infrastructure Monitoring Dashboard?
Dashboards are a key part of using any infrastructure monitoring tool. They provide you with a quick overview of the health and performance of your systems and can be customized to show only the information that is relevant to you. However, with so many different dashboard options available, it can be difficult to know where to start. In this article, we will take a look at how you can use an infrastructure monitoring dashboard to get the most out of your monitoring solution.
We will specifically focus on the Hosted Graphite dashboard. Hosted Graphite is a fully-hosted version of Graphite + Grafana, supercharged with team accounts, long-term data storage, highly technical support, and more. By the end of this article, you should have a good understanding of how to use dashboards to improve your infrastructure monitoring.
System Monitoring with Hosted Graphite
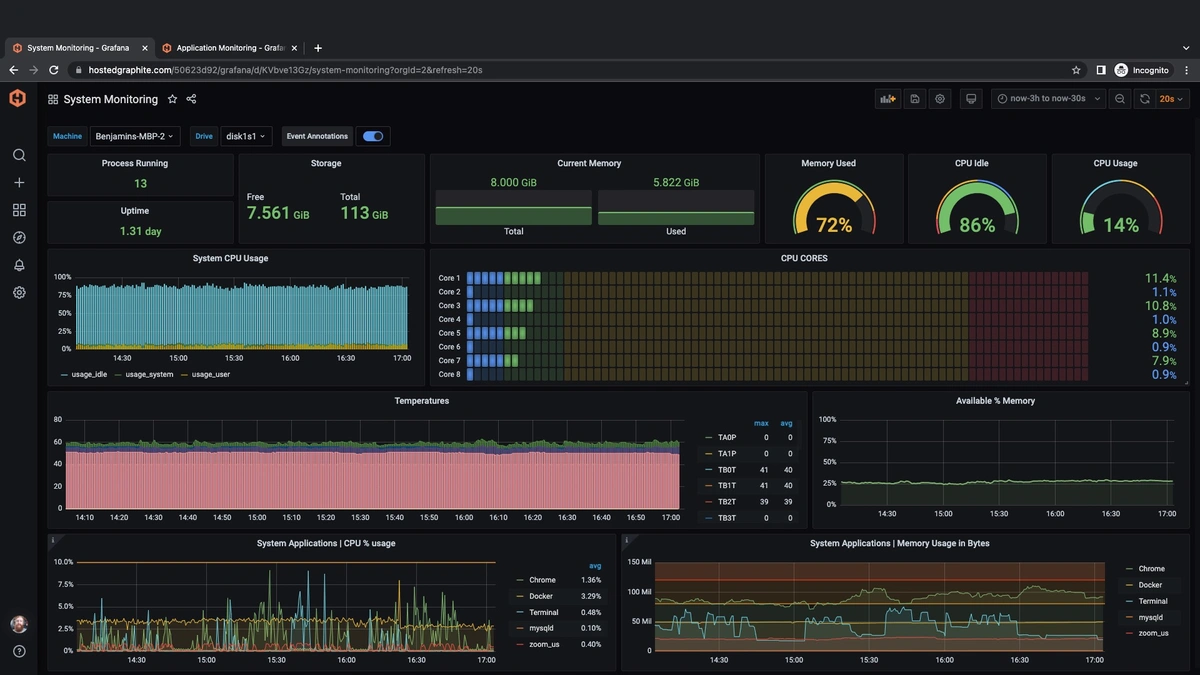
System monitoring is vital for keeping track of the performance of your systems and ensuring that they are running smoothly. Hosted Graphite provides an excellent dashboard for system monitoring, allowing you to see at a glance how your systems are performing. The dashboard provides detailed information on CPU usage, memory usage, network traffic, and more. This makes it easy to spot any potential problems and investigate them further.
Additionally, the dashboard can be customized to show only the information that you deem important. This makes it an excellent tool for system administrators who need to keep a close eye on their systems. Overall, Hosted Graphite's dashboard is an excellent way to monitor your systems and ensure that they are running smoothly.
Application Monitoring with Hosted Graphite
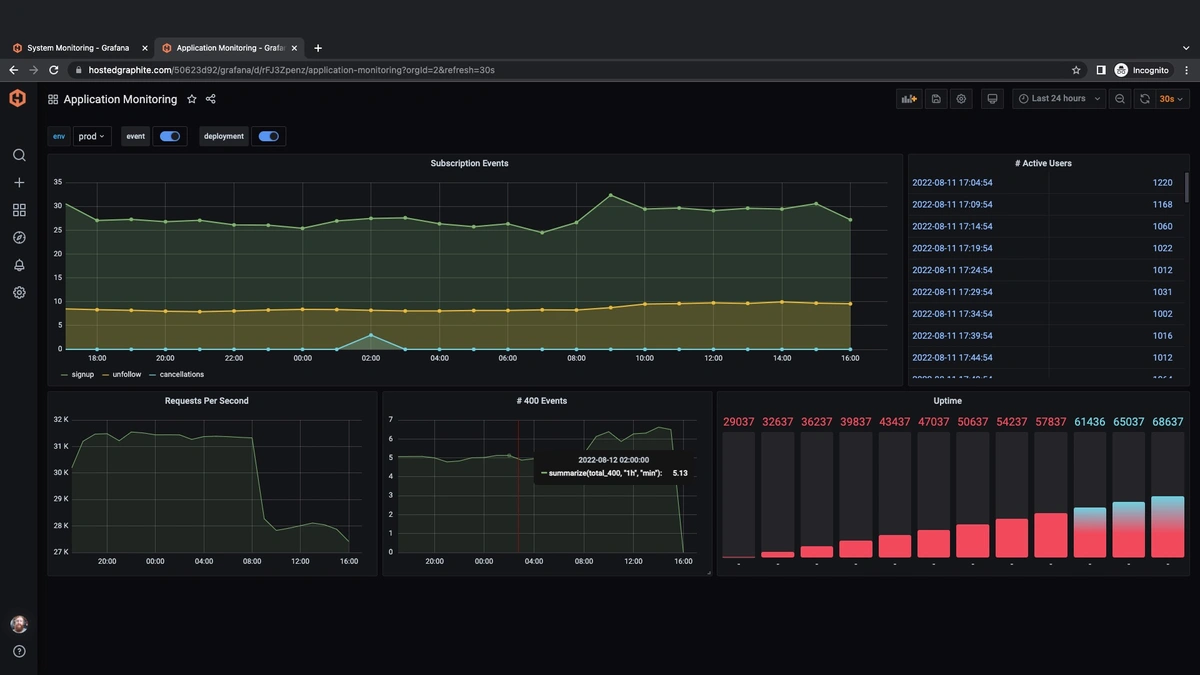
Application monitoring is critical for ensuring the smooth operation of any software system. By tracking key performance indicators and identifying issues early, you can avoid potential problems and keep your application running at peak efficiency. Hosted Graphite makes it easy to monitor your applications with comprehensive dashboards that give you visibility into all aspects of performance.
With Hosted Graphite, you can easily track response times, error rates, and other key metrics to ensure that your applications are running smoothly. In addition, the alerting system will notify you of any issues so that you can take action to fix them before they cause problems for your users. With Hosted Graphite, you can have peace of mind knowing that your applications are always running optimally.
How to use Hosted Graphite dashboard?
Full-featured interactive dashboards come standard with all Hosted Graphite plans. Here is a brief overview of the primary features of Hosted Graphite dashboard.
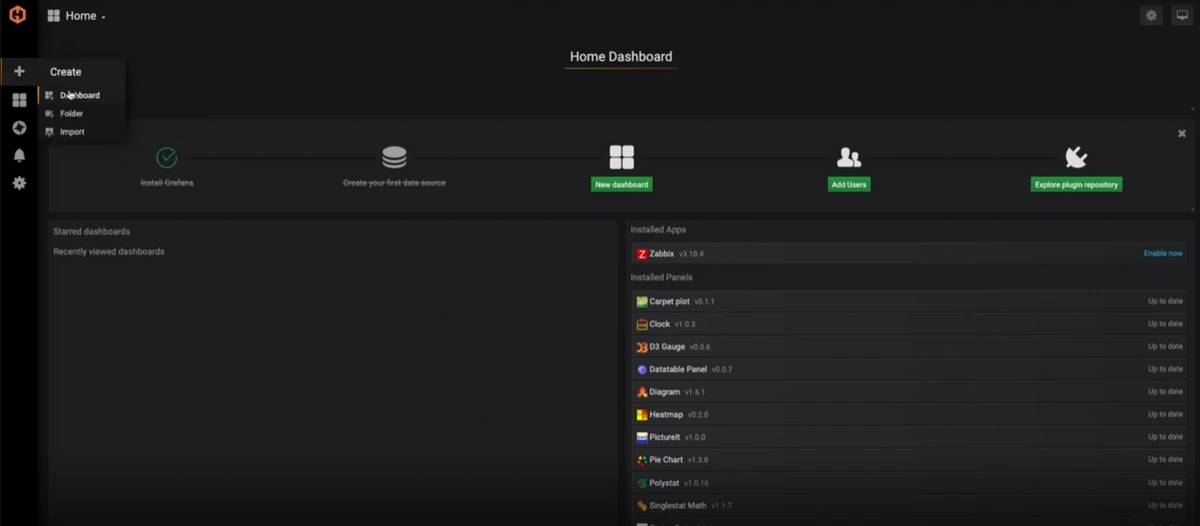
Create a new primary dashboard
On the left side menu, hover over the + icon and select dashboard to create a new primary dashboard. The dashboard can be customized by adding new rows and panels.
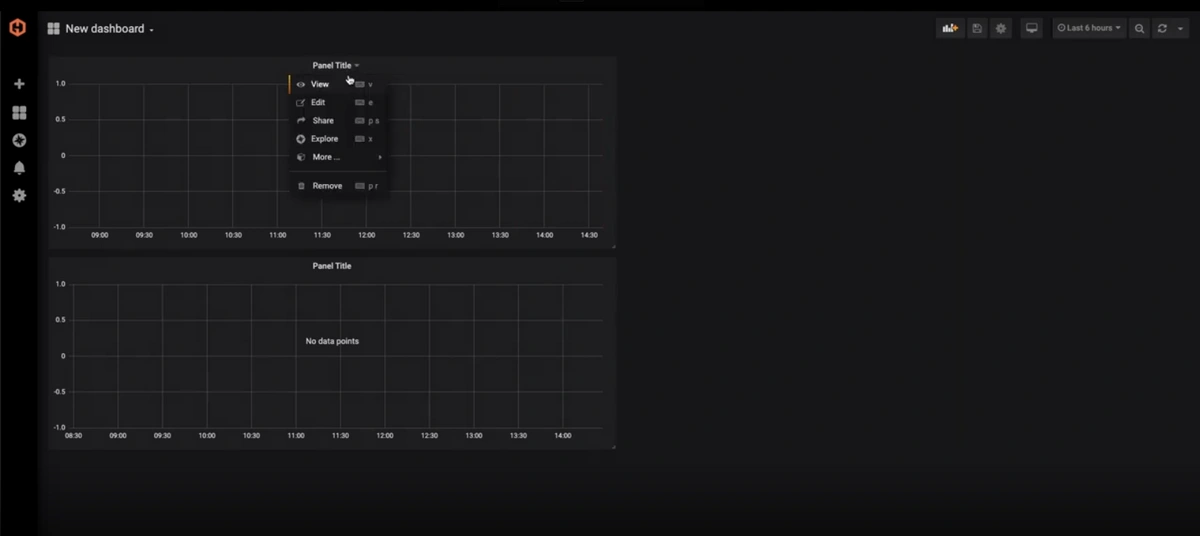
Adding a Metric
A metric can be added to a graph by clicking on the title of the panel and selecting edit to access the graph editor. Once you have added your metrics to the graph, you can apply functions to them, change the graph style, and give it a name. Check out our full tutorial on connecting Graphite to Dashboards for instructions on how to integrate metrics. Additionally, we provide resources for people who want to use other data sources.
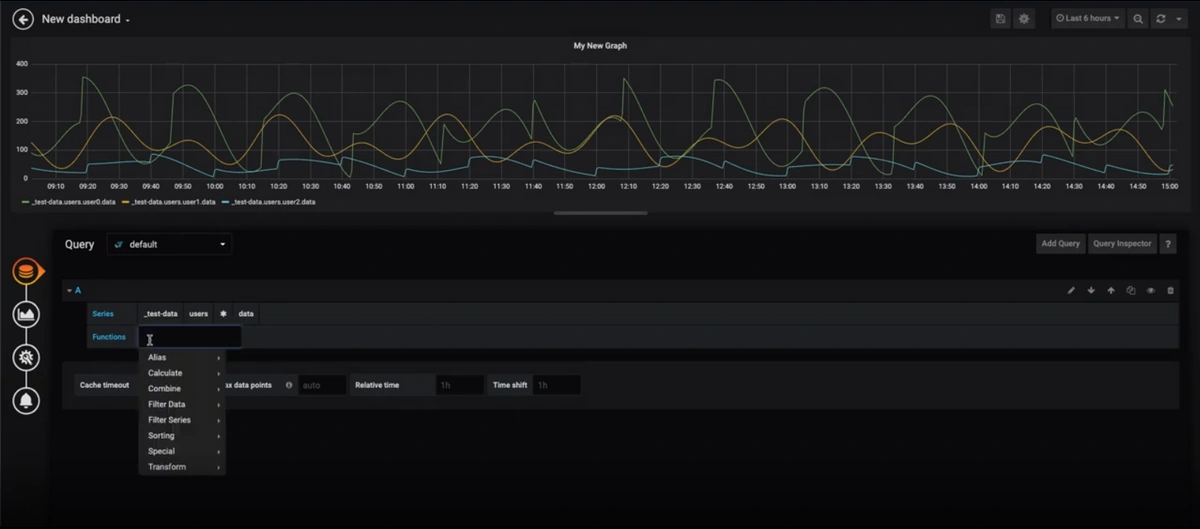
Applying a function
By opening the graph editor and clicking the + icon, you can apply a function to a group of metrics.
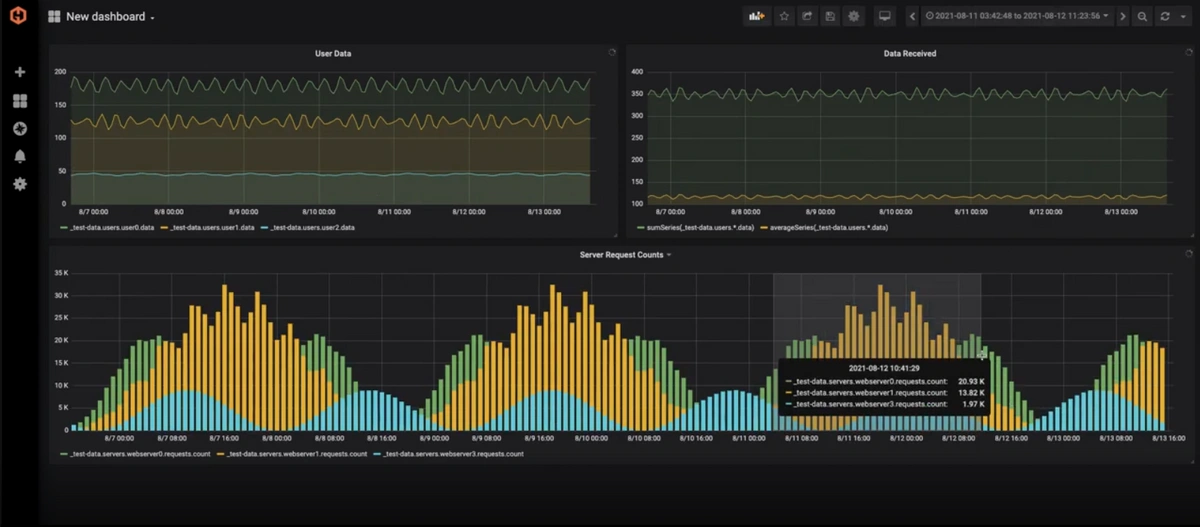
Navigating inside dashboard
In each graph, you can zoom in on a specific section by highlighting it or using the time range class="example-vids" preload="auto" controls. Your graphs can also be updated automatically by setting an auto-refresh rate. The graph display can be especially useful for monitoring graphs if you have a dedicated display for that purpose
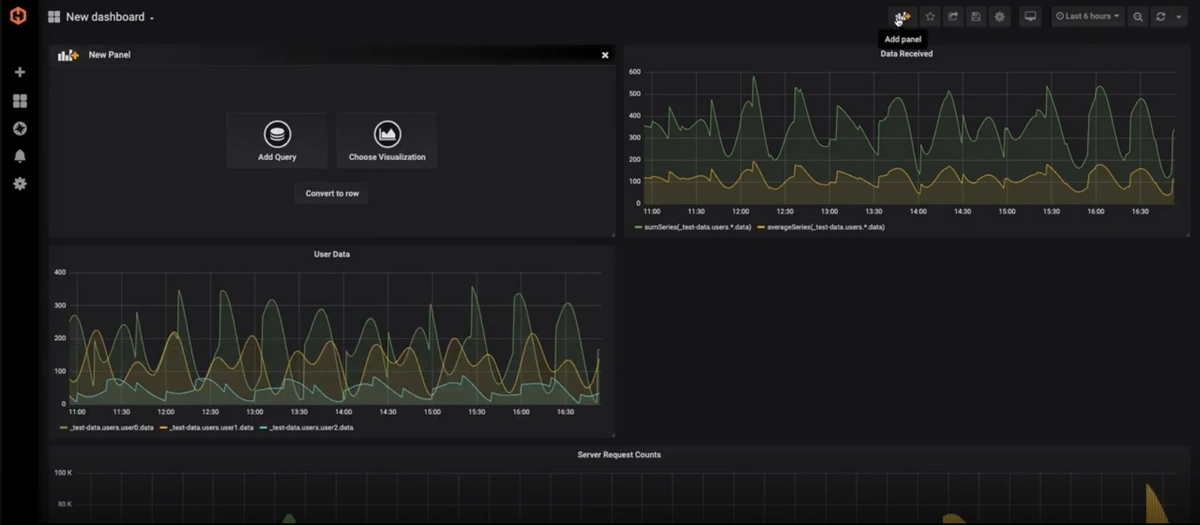
Organizing the panels
To arrange your panels in rows, click on the add panel icon (an image of a bar graph with a + on it, on the top right) and choose Convert to row. Panels can be moved around the dashboard by dragging and dropping them. It is also easy to adjust the height and width by clicking and dragging the corners. See the different panels you can choose from and learn to build awesome dashboards here.
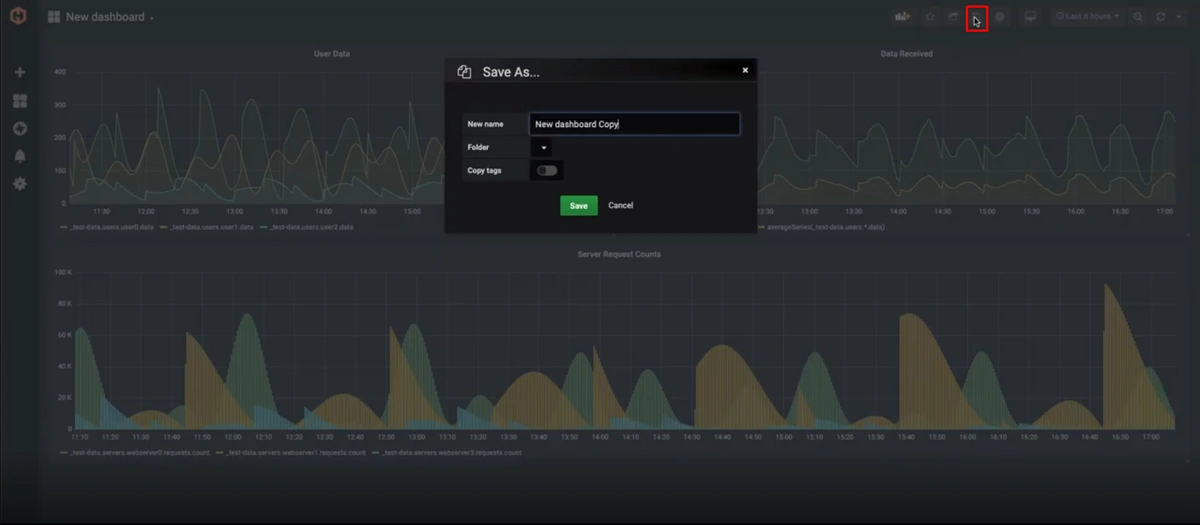
Saving and naming
Using the floppy icon, you can save and rename your dashboard. If you want to change the name of an existing dashboard, click the options cog on the top right and input the new name. Then click save. To help organize your dashboard, you can also add tags.
Accessing saved dashboards
From the Dashboard dropdown, you can select one of your previously saved dashboards. A search function is also available for filtering the results.
On the top left corner, click the computer monitor icon to toggle the side menu. You can access documentation and support quickly through the side menu. For more, see our resources on connecting Graphite with Dashboards.

Conclusion
Infrastructure monitoring is essential for any business, large or small. By understanding your network and tracking the performance of your systems, you can head off potential problems before they cause downtime or data loss. We’ve shown you how to set up an infrastructure monitoring dashboard using hosted graphite. Now it’s time to put this valuable tool to work for you.
By using a hosted graphite solution, you can get real-time insights into your system performance and optimize your infrastructure for peak efficiency. Are there other metrics that you would like to see on your dashboard? Let us know and we can help get you set up. At Metricfire, we want to make sure that you have everything you need to keep your business running smoothly.
Sign up today for a free trial and see what our platform can do for you.

