
Table of Contents
Great systems are not just built. They are monitored.
MetricFire runs Graphite and Grafana as a fully managed service for growing engineering teams, taking care of storage, scaling, and version updates so your team doesn't have to. Plans start at $19/month, billed per metric namespace rather than per host, and include engineer-staffed support. Integrations work natively with Heroku, AWS, Azure, and GCP, and data is stored with 3× redundancy in SOC2- and ISO:27001-certified data centres.

Introduction
Before we do a detailed dive into what Prometheus and Datadog are, let's look at the key comparison points. Both Prometheus and Datadog are monitoring tools, but Prometheus is open source and Datadog is proprietary. Prometheus is the de facto tool for monitoring time-series for Kubernetes, and Datadog is an all-around APM, logs, time-series, and tracing tool. When it comes to getting a hosted version of Prometheus, which is key for scaling and long term storage, MetricFire runs a great hosted prometheus service.
So, how to choose between Datadog and Prometheus? The answer is:
- If you need a little bit of everything, Datadog is the right choice for you.
- If you need time series, especially for monitoring Kubernetes, Prometheus is the right choice for you.
- If time-series is right for you, but Prometheus is a hassle, try MetricFire!
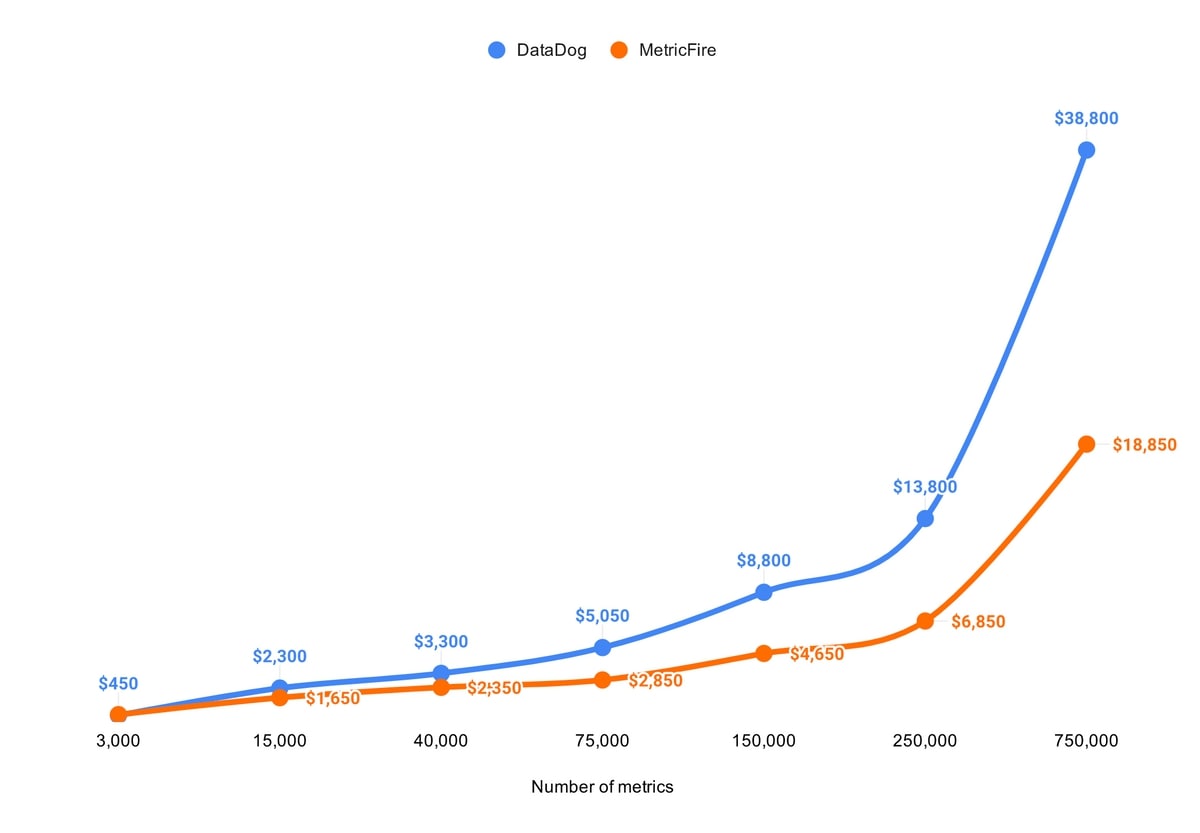
Datadog is an all-around APM tool, so it's not designed for creative monitoring or custom time-series metrics. The Datadog package includes 200 custom metrics for every server being monitored with Datadog. For example, let's imagine a company is running 6 servers. With Datadog you'll get 1200 custom metrics for free, and after that, they charge 5.00 USD for every 100 custom metrics. For a company monitoring 250,000 custom metrics on 6 servers, that will result in a monthly bill of 12,578.00 USD. Not to mention the other features that you will be paying for beyond that.
This is a high price for custom time-series metrics. With open source Prometheus you can do it for free, but the total cost of developing and maintaining Prometheus is more expensive than you'd expect. With MetricFire, you can get the best of both worlds. MetricFire's Hosted Prometheus scales your time-series metrics, and we do it for much less than Datadog. Check out this monthly cost comparison graph here:
MetricFire and Prometheus are not typically used as solutions for logging, tracing, or front-end monitoring. But when it comes to time-series metrics, especially for infrastructure, Prometheus and MetricFire exceed in comparison to Datadog. To find out more, you should book a demo with the MetricFire team!
Now, let's dive into what are Prometheus and Datadog in more detail.
What is Prometheus?
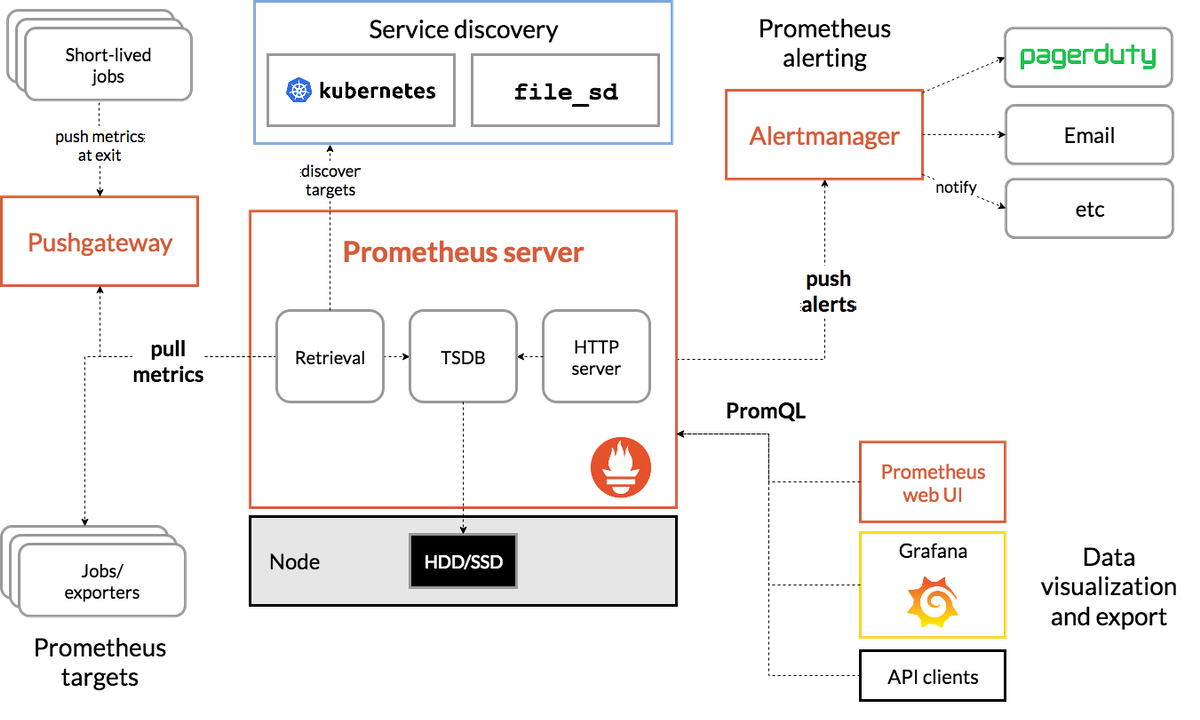
Prometheus is an open-source service monitoring system built around a time series database, able to receive data and store it, in addition to supporting queries, graphs, and built-in alerting. Connecting to target endpoints to request metrics via HTTP, Prometheus provides a multi-dimensional data model wherein metrics can be defined by names and/or tags that identify them as part of a unique time series. Open-source Prometheus metrics have a default retention of 15 days. The Prometheus query language (PromQL) can then be used to explore metrics and draw simple graphs.
Get our free trial and start using Prometheus in minutes. You can see if Prometheus is the right fit for you. If you have any questions, you can always book a demo and talk to us directly.
What is Datadog?
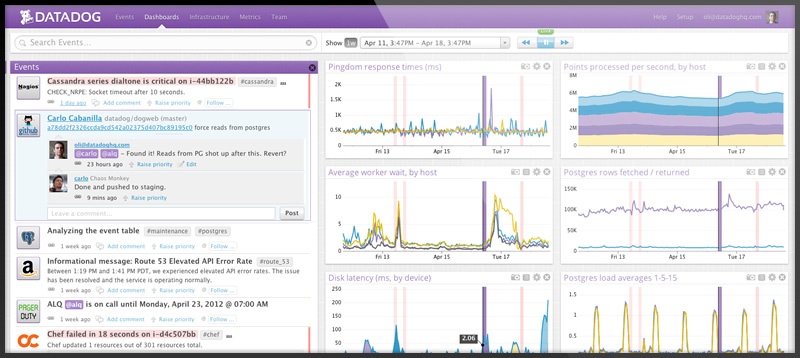
Datadog allows you to view infrastructure metrics, traces and logs all on the same dashboard. Datadog supports visualization, troubleshooting, monitoring, and alerting. Datadog integrates with hundreds of different apps or services, and it can communicate with any environment, such as servers, containers, mobile, web browsers, and cloud services. Datadog’s primary target is to see inside any stack and any app. Datadog also supports alerts, and collaboration, and allows you to combine data from various sources into one visual.
When to use Datadog?
Use Datadog when you …
- want to monitor Infrastructure or apps.
- want to visualize data from any source, even on the same graph.
- want to communicate with the team directly in the dashboard.
- need alerting for events.
Pricing comparison
- Prometheus is open-source, and free.
- Datadog’s Enterprise package starts at $23 per host, per month, with a minimum sign-up of 100 hosts.
- For less than 100 hosts, Datadog’s pro package is $15 per host, per month.
Key takeaways
- Prometheus can provide a dimensional data model where metrics are identified by a metric name and tags with built-in storage, graphing, and alerting
- Prometheus is open-source, and free.
- Datadog is able to monitor any infrastructure or apps by being able to integrate into almost all environments.
- Datadog is proprietary and has an enterprise package starting at 2300 USD per month, where pricing scales rapidly after that.
Get a free trial and start using Graphite now. Feel free to book a demo if you have questions about what MetricFire can do for you.


