
Table of Contents
Great systems are not just built. They are monitored.
MetricFire runs Graphite and Grafana as a fully managed service for growing engineering teams, taking care of storage, scaling, and version updates so your team doesn't have to. Plans start at $19/month, billed per metric namespace rather than per host, and include engineer-staffed support. Integrations work natively with Heroku, AWS, Azure, and GCP, and data is stored with 3× redundancy in SOC2- and ISO:27001-certified data centres.
Introduction
Monitoring the performance of your MySQL database will help identify performance bottlenecks, inefficient queries, and resource-intensive processes. By tracking metrics like query execution times, server load, and resource usage, administrators can optimize configurations and fine-tune the database for better efficiency and speed. Additionally, monitoring any running process allows for the early detection of potential problems such as server overload, disk space shortages, or network issues. It helps spot anomalies, system errors, or slowdowns, enabling prompt investigation and resolution before they escalate into critical issues that could affect application performance or cause downtime.
In this article, we'll detail how to use the Telegraf agent to collect MySQL performance data that you can forward to a data source of your choice.
Getting Started with the Telegraf Agent
Telegraf is a plugin-driven server agent built on InfluxDB that collects and sends metrics/events from databases, systems, processes, devices, and applications. It is written in Go and compiles into a single binary with no external dependencies and requires a minimal memory footprint. Telegraf is compatible with many operating systems and has many helpful output plugins and input plugins for collecting and forwarding a wide variety of system performance metrics.
Install Telegraf (Linux/Redhat)
/etc/telegraf/wget https://dl.influxdata.com/telegraf/releases/telegraf_1.30.0-1_amd64.deb
sudo dpkg -i telegraf_1.30.0-1_amd64.deb
RedHat/CentOS
wget https://dl.influxdata.com/telegraf/releases/telegraf-1.30.0-1.x86_64.rpm
sudo yum localinstall telegraf-1.30.0-1.x86_64.rpm
Configure an Output
You can configure Telegraf to output to various sources, such as Kafka, Graphite, InfluxDB, Prometheus, SQL, NoSQL, and more.
In this example, we will configure telegraf with a Graphite output. If you're not currently hosting your data source, start a 14-day free trial with Hosted Graphite by MetricFire to follow these next steps.
A Hosted Graphite account will provide the data source, offer an alerting feature, and include Hosted Grafana as a visualization tool.
To configure the Graphite output, locate the downloaded telegraf configuration file at /etc/telegraf/telegraf.conf and open it in your preferred text editor. Then, you will need to make the following changes to the file:
First, uncomment the line:
[[outputs.graphite]]
Next, uncomment and edit the server line to:
servers = ["carbon.hostedgraphite.com:2003"]
Finally, uncomment and edit the prefix line to:
prefix = "<YOUR_API_KEY>.telegraf"
Configure the Input Plugin for MySQL Monitoring
Telegraf has many input plugins that can collect a wide range of network performance statistics. In this example, we will show you how to configure the MySQL plugin in 3 easy steps.
1. You must open your telegraf.conf file in a vim shell or text editor, locate and uncomment the [[inputs.mysql]] line.
Then uncomment the 'servers' line and specify your server and db credentials:
NOTE: If no server is specified, localhost will be used. However, it's best practice to configure db credentials to authenticate the connection to the agent. This is an example of how to configure the 'servers' line to a local running instance of MySQL with TCP as the default protocol and 3306 as the default port:
## server format = [username[:password]@][protocol[(address)]]/[?tls=[true|false|skip-verify|custom]]
servers = ["telegraftest:password123@tcp(127.0.0.1:3306)/?tls=false"]
2. Now, you can create a test user in your MySQL database and grant privileges to allow a connection with the telegraf agent.
CREATE USER 'telegraftest'@'localhost' IDENTIFIED BY 'telegraftest';
GRANT ALL PRIVILEGES ON * . * TO 'telegraftest'@'localhost';
FLUSH PRIVILEGES;
3. Run Telegraf to see if there are any configuration errors in the output:
telegraf --config telegraf.confIf no errors can be seen in the output of the above command, you can restart the Telegraf service, and it will run in the background on your machine, and Telegraf will forward roughly 450 MySQL performance metrics. Alternatively, if you need to integrate these metrics with other data sources and applications, Integrate.io provides a low-code data integration platform that can help you pipeline this data alongside other enterprise sources for comprehensive analysis.
NOTE: if you need to filter out specific patterns to reduce the number of metrics being forwarded, you can do so with the 'field drop' option in Telegraf by adding a similar line to your config: fielddrop = ["innodb_*"]
The metrics will include statistics into query execution times/throughput/cache utilization, active/aborted connections, InnoDB storage/buffer pool usage/transactions/locks, replication lag/delay, db commands, and many more!
For more configuration options and a complete list of metrics returned by the MySQL plugin, see the official GitHub repository.
Use Hosted Graphite by MetricFire to Create Custom Dashboards and Alerts
MetricFire provides a monitoring platform that enables you to gather, visualize, analyze, and alert on metrics from sources such as servers, databases, networks, devices, and applications. Using MetricFire, you can effortlessly identify problems and optimize resources within your infrastructure. Hosted Graphite by MetricFire removes the burden of self-hosting your monitoring solution, allowing you more time and freedom to work on your most important tasks.
Once you have signed up for a Hosted Graphite account and used the above steps to configure your server with the Telegraf Agent, metrics will be forwarded, timestamped, ingested, and aggregated into the Hosted Graphite backend.
They will be sent and stored in the Graphite format of metric.name.path <numeric-value> <unix-timestamp> provides a tree-like data structure and makes them easy to query.
These metrics can be found in your Hosted Graphite account, where you can use them to build custom Alerts and Grafana dashboards.
Create Dashboards in Hosted Graphite's Hosted Grafana
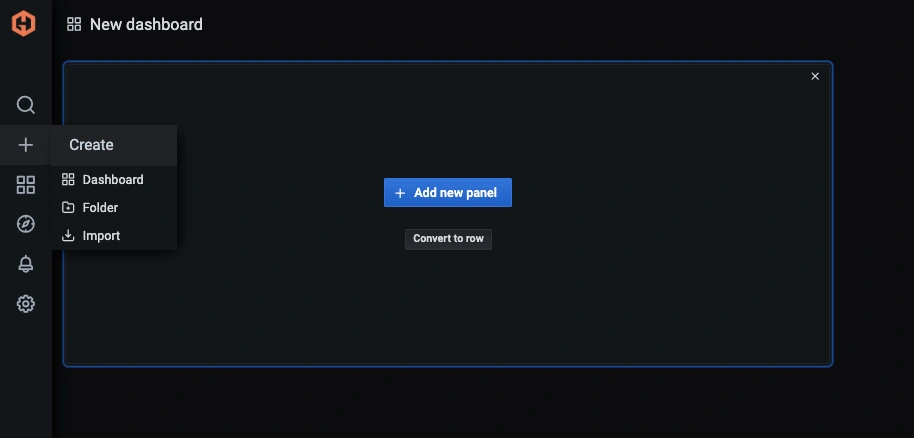
In the Hosted Graphite UI, navigate to Dashboards => Primary Dashboards, and select the + button to create a new panel:
Then you can use the query UI to select a graphite metric path (the default data source will be the hosted graphite backend if you are accessing Grafana through your Hosted Graphite account):
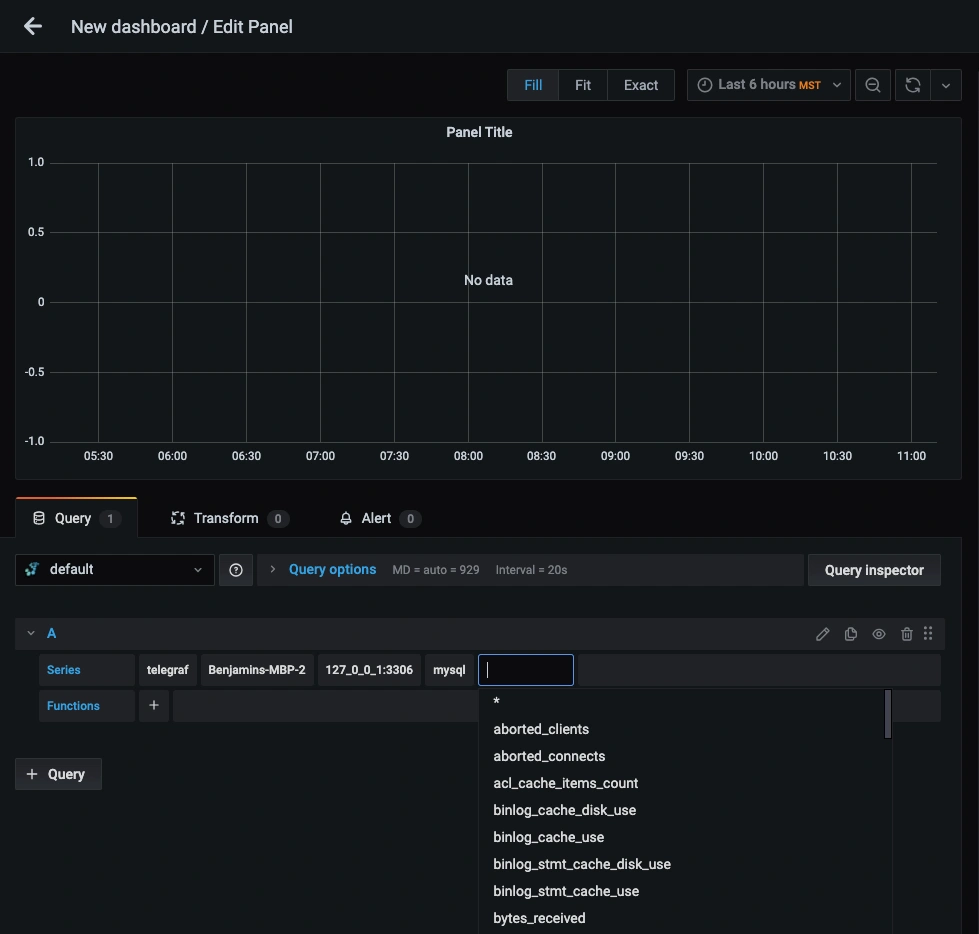
Graphite data sources also support wildcard (*) searching to grab all metrics that match a specified path.
Now you can apply Graphite functions to these metrics like exclude() to remove a pattern from a wildcard query:
Grafana has many additional options, like configuring dashboard variables and annotations. You can also use different visualizations, modify the display settings, define the unit of measurement, and much more.
See the Hosted Graphite dashboard docs for more details.
Creating Graphite Alerts
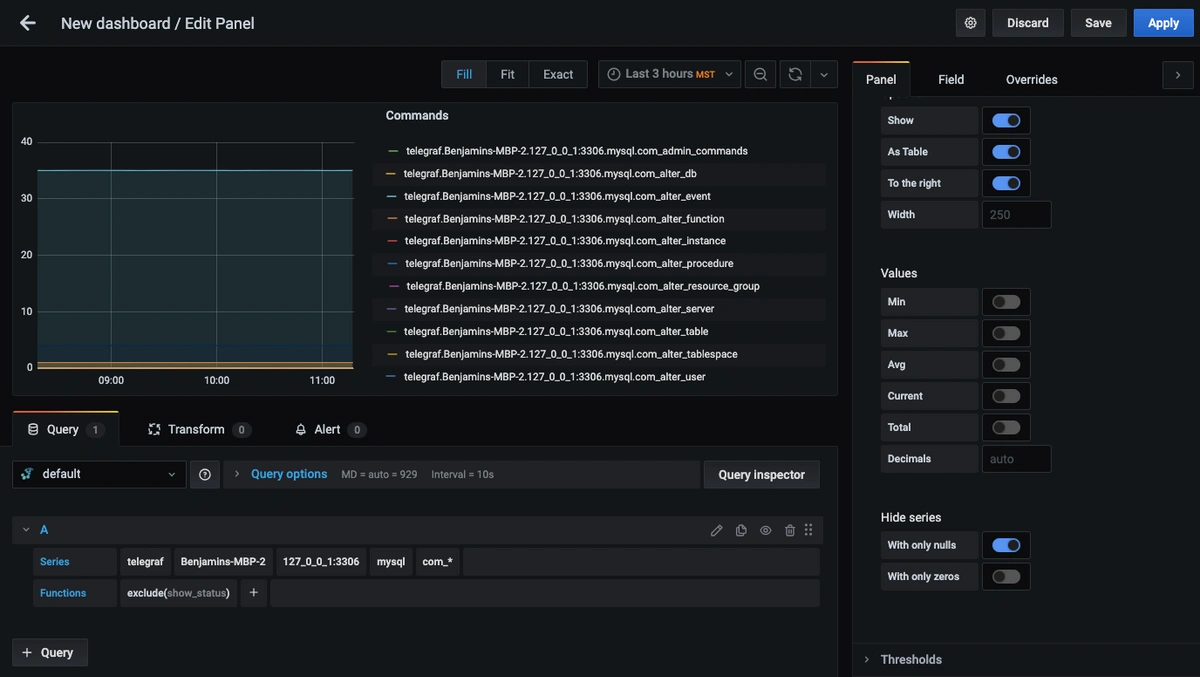
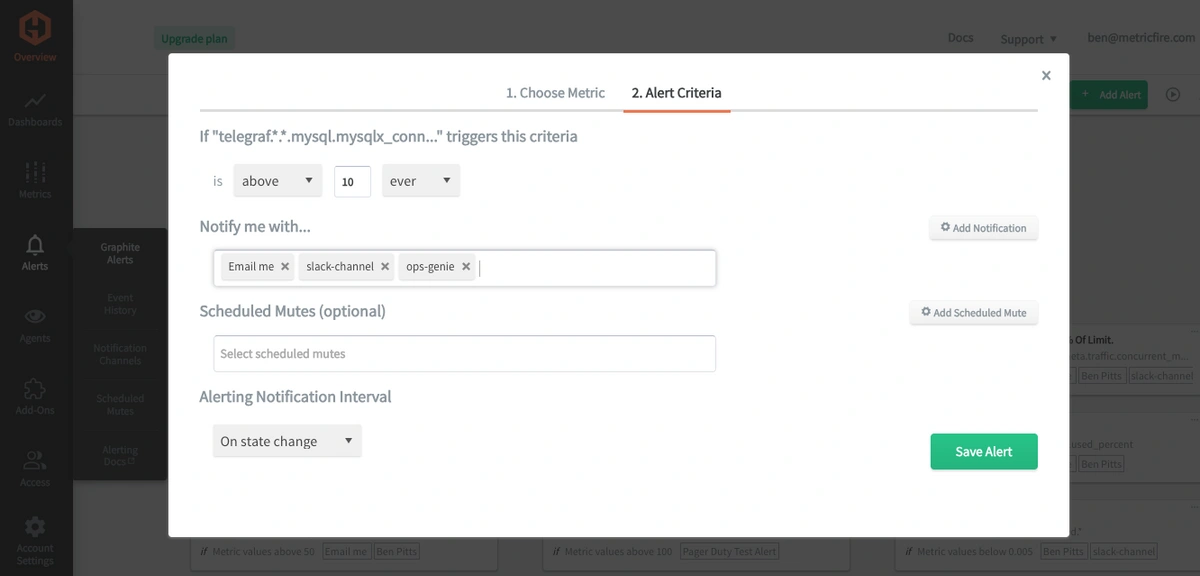
In the Hosted Graphite UI, navigate to Alerts => Graphite Alerts to create a new alert. Name the alert, add one of your graphite metrics to the alerting metric field, and add a description of what this alert is:
Then, select the Criteria tab, which will set the threshold, and select a notification channel. The default notification channel will be the email address you used to sign up for the Hosted Graphite account. Still, you can easily configure channels for Slack, PagerDuty, Microsoft Teams, custom webhooks, and more. See the Hosted Graphite docs for more details on notification channels:
Conclusion
Monitoring database performance is crucial for any business as it directly impacts application performance, user satisfaction, operational continuity, cost efficiency, scalability, security, compliance, and the ability to derive meaningful insights from data - all fundamental to a successful and competitive business operation.
MySQL performance monitoring provides valuable data. MetricFire's dashboards and alerts complement this data by providing real-time visualization, proactive identification of issues, historical trend analysis, and facilitating informed decision-making. These are all essential for maintaining a robust and efficient network infrastructure.
Sign up for the free trial and experiment with monitoring your MySQL database performance today. You can also book a demo and talk to the MetricFire team directly about your monitoring needs.

