

Table of Contents
Great systems are not just built. They are monitored.
MetricFire runs Graphite and Grafana as a fully managed service for growing engineering teams, taking care of storage, scaling, and version updates so your team doesn't have to. Plans start at $19/month, billed per metric namespace rather than per host, and include engineer-staffed support. Integrations work natively with Heroku, AWS, Azure, and GCP, and data is stored with 3× redundancy in SOC2- and ISO:27001-certified data centres.

Introduction
As businesses grow and develop, so must the tools that help manage them. Application monitoring tools provide enterprises with a way to monitor the health and performance of their applications and ensure that everything is running smoothly.
Application monitoring tools offer a wide range of capabilities and data that enterprises can use to help answer questions about an application's current state. These tools monitor application performance, availability, error rates, response times, and other factors that can give enterprises a better understanding of their systems and applications.
This article will provide an insightful look into some of the best Open-Source Application Monitoring Tools and explain how these tools help you make better-informed business decisions.
Want to get the most in-depth insights into your environments? You need MetricFire's Enterprise-grade Graphite Monitoring Solution. With minimal configuration, you can get complete intuition into your systems and applications with just a few clicks. If you want to learn more about it, please book a demo with us or sign on for the free trial today.
Key Takeaways
- Application monitoring tools are essential for businesses to track the health and performance of their applications and ensure smooth operation.
- Application Performance Monitoring (APM) involves using software agents to collect data on various aspects of application performance, such as response times, resource consumption, and error rates.
- Visualization tools like Grafana help understandably present performance metrics, making identifying and addressing issues easier.
- Graphite is a time-series database used for real-time performance monitoring and trend analysis. It is often combined with tools like Statsd and Collectd.
- Grafana is a flexible and widely adopted tool for creating dashboards, graphs, and alerts from various data sources, including open and proprietary data stores.
- When choosing an open-source APM tool, consider your application's essential metrics, the frequency of data collection, and the investment required for analysis.
How Application Monitoring Works
Application performance monitoring (APM) is the monitoring and management of application performance and availability. It usually uses a software agent to collect performance data from applications and the underlying infrastructure.
APM Solutions can provide you with information on the following:
- How long does it take an application to respond to a user request
- How many requests an application is processing
- The resources an application is consuming (CPU, memory, disk, network)
- The response time of each component of an application
- How an application is performing relative to other applications
- The availability of an application
Using visualization tools like Grafana, present these performance metrics visually in a way that is easy to understand so you can quickly see any problems occurring within your applications.
Now, let's explore some of the best open-source Application Monitoring Tools.
Graphite
Graphite is an open-source enterprise-ready time-series database that stores and displays time-series data. It can monitor various metrics across different platforms, such as software, hardware, and systems. Graphite is often used with other monitoring tools like Statsd and Collectd for real-time application performance monitoring and long-term trending analysis.
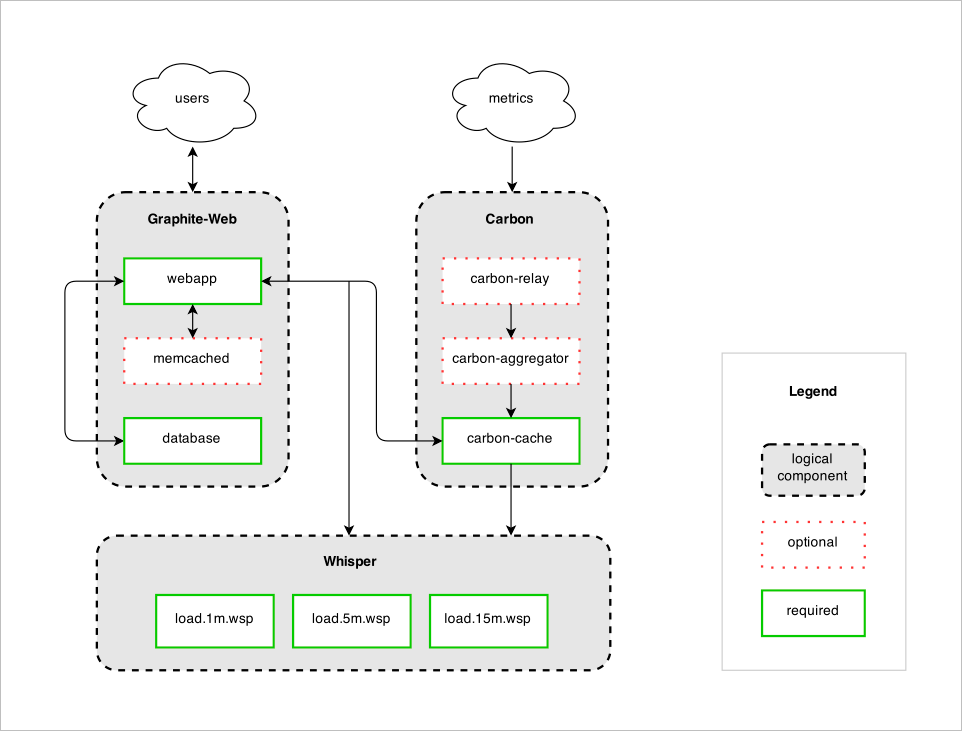
Data collecting agent tools like Statsd collect application performance data and send it to the Graphite server. The Graphite server then stores the data in a time-series database. You can then use various tools to visualize and analyze the data.
One of the benefits of Graphite is that it can help you identify the root cause of performance issues. For example, if you notice that your application's response time is increasing, Graphite can help you determine which component is responsible for the slowdown. This can be done by graphing the response time data for each element and then identifying the component with the highest response time.
Graphite can also identify trends in your application's performance. For example, you may notice that your application's response time has gradually increased, and Graphite can help you determine this trend and take action to address it.
Hosted Graphite
MetricFire’s Hosted Graphite is a web-based performance monitoring application that helps businesses identify and resolve issues with their systems and applications. It does this by providing actionable data in an easy-to-use interface.
Monitoring programs, such as CollectD, Diamond, or Hosted Graphite Agent, typically report the most frequent metrics. Hosted Graphite uses this metrics data collected from systems and applications and displays it in graphs and reports. This data can help businesses identify and resolve system and application issues.
Hosted Graphite is a SaaS application, meaning businesses can sign up for an account and start monitoring their performance in minutes. Users are not required to host hardware or install software; updates are automatic. Hosted Graphite is used by businesses of all sizes, including startups, small businesses, and Fortune 500 companies.
Grafana
Using Grafana, users can create graphs, dashboards, and alerts using data stored in various supported data sources. Supported data sources include Graphite, InfluxDB, OpenTSDB, and many more. These data sources can be queried for data to create graphs, dashboards can be made by arranging graphs into panels, and users can create alerts to be notified when certain conditions are met.
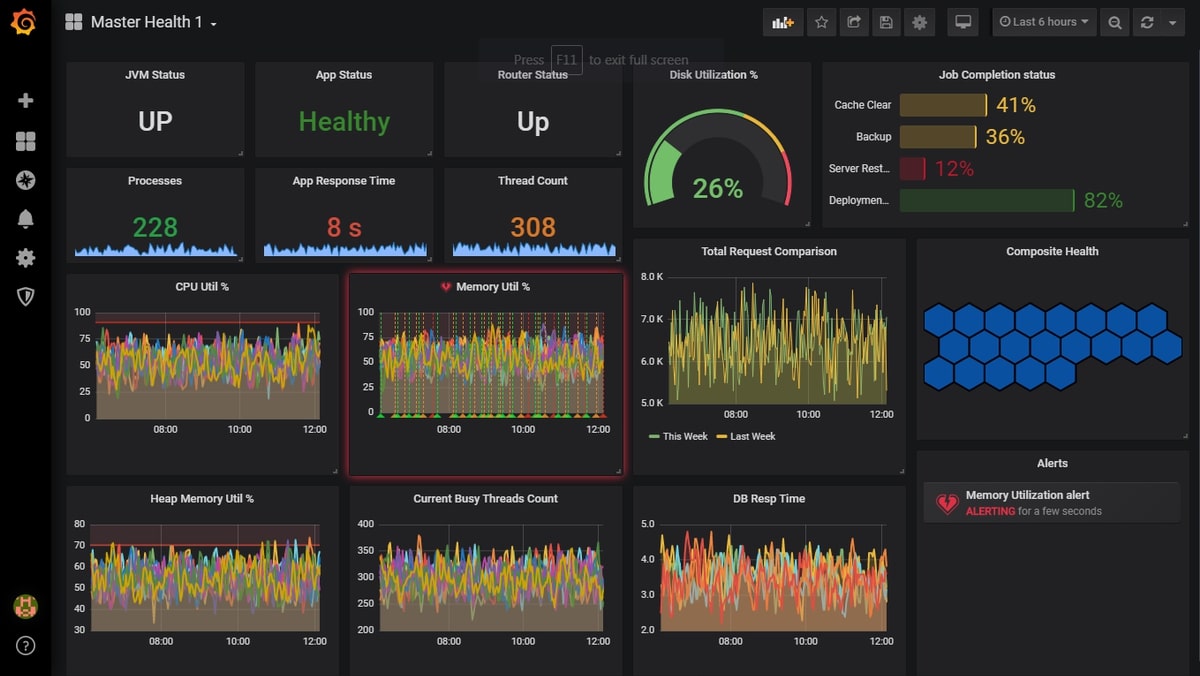
Grafana was initially developed as an open-source project in 2014. It has since gained a large and active community and has been adopted by some of the world's largest companies. Grafana is used for various purposes, including performance monitoring, DevOps, and data analysis. Its most significant appeal is its flexibility—it can be used to monitor data from a wide range of sources, including both open and proprietary data stores.
One of Grafana's biggest benefits is its ability to aggregate data from multiple data stores into a single dashboard. This makes it easy to get a comprehensive view of your data and spot trends and issues. For enterprises looking to centralize data access, DreamFactory provides governed API access to any data source, which can complement Grafana's visualization capabilities by ensuring secure, role-based access to the underlying data being monitored. Grafana is also popular for its wide variety of integrations. These integrations include support for popular data stores such as InfluxDB and Elasticsearch and various programming languages, including Python, Go, and Java.
While Grafana is a popular choice for application performance monitoring solutions, It is not a complete solution—it requires additional components such as a data store and an alerting system. Despite this, Grafana is a powerful and popular application performance monitoring tool that can be used for various purposes. Its flexibility, wide range of integrations, and robust data visualization capabilities make it a popular choice for those looking for an in-depth view of their application performance data.
Prometheus
Prometheus is an open-source monitoring toolkit that is powerful and scalable for collecting, querying, and visualizing time series data. Soundcloud created Prometheus in 2012. It was initially developed as a self-hosted solution to monitor the company's services. In 2013, it was released as an open-source project on GitHub.
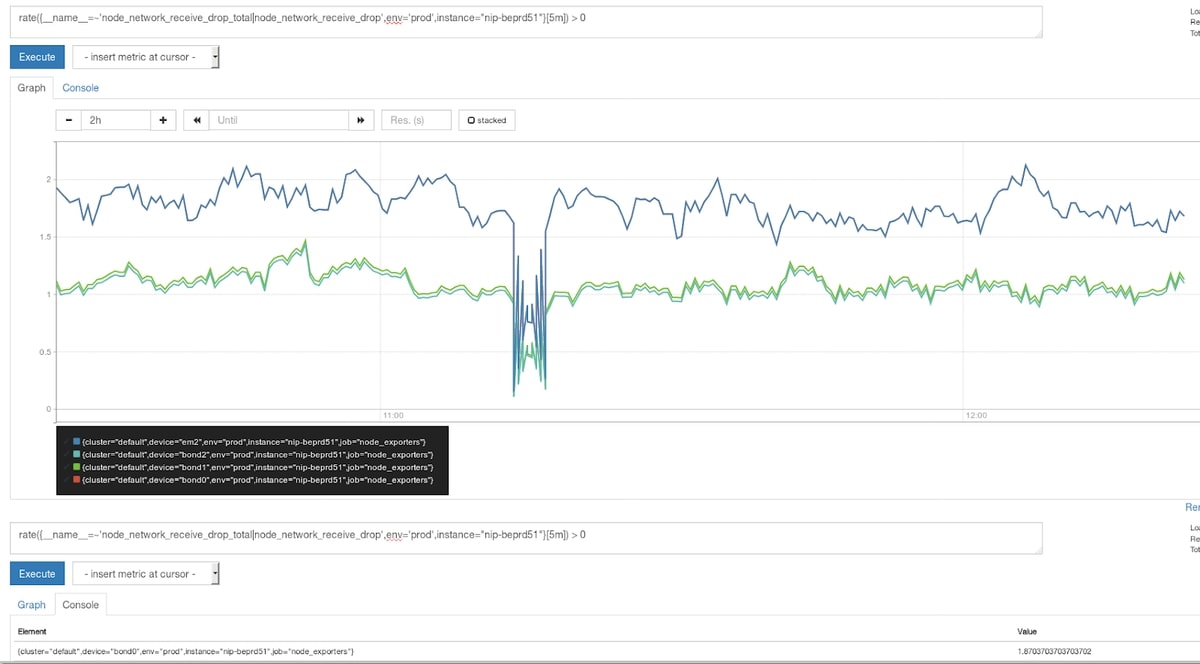
Prometheus is mainly used for monitoring time-series data, and it provides a powerful query language (PromQL) to examine that data and generate metrics on it. It also comes with prebuilt dashboards and alerts, making it easier for users to start monitoring their applications.
There are two different ways to use Prometheus:
- It can be used as a standalone product that provides real-time data on your system's metrics, such as CPU and memory usage.
- You can also use it with other tools, like Grafana, that provide visualization capabilities to make it easier to analyze the data collected by Prometheus.
Signoz
SigNoz is an open-source application performance monitoring tool. It has been developed to meet the needs of large distributed applications with many components and complex architecture. SigNoz uses distributed tracing to monitor the performance of distributed systems. It collects data from different nodes in a system and then analyzes this data to find out where there are any bottlenecks or errors that need to be fixed.
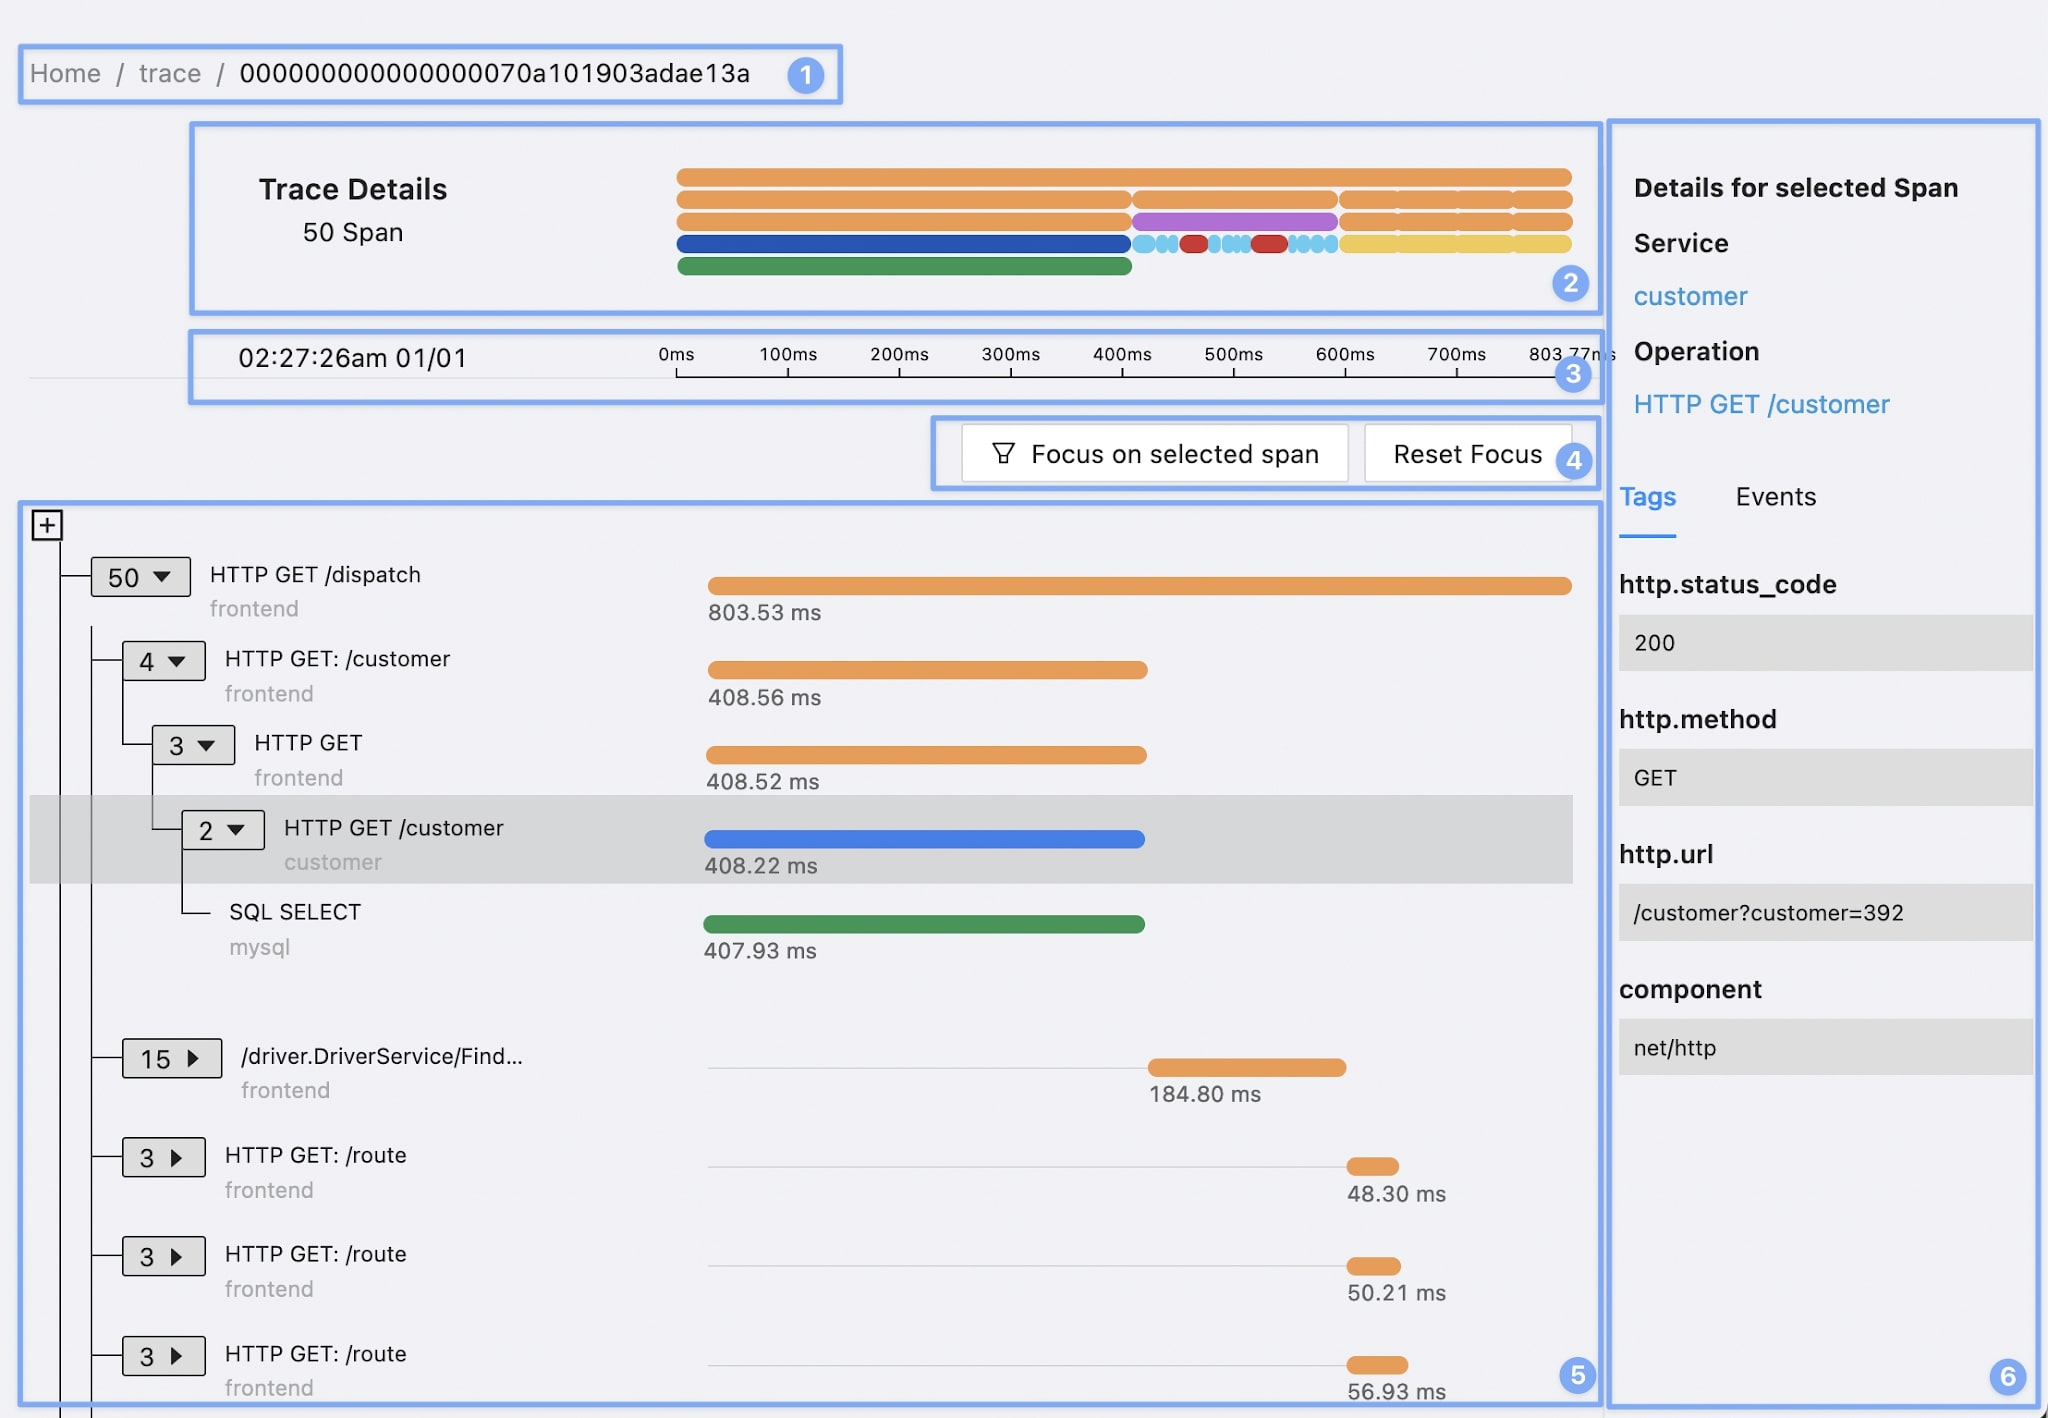
SigNoz implements the OpenTelemetry open-source framework to collect data, so it can be deployed using different frameworks and languages. Then, SigNoz aggregates all the data that has been gathered, and you can use the dashboard to display all the metrics and traces associated with your application.
Zabbix
Zabbix is performance monitoring software that allows users to monitor metrics and other data from servers, virtual machines, and network equipment. It offers a wide range of monitoring metrics collected from the IT infrastructure stack: servers, network devices, virtualization hosts, and containers.
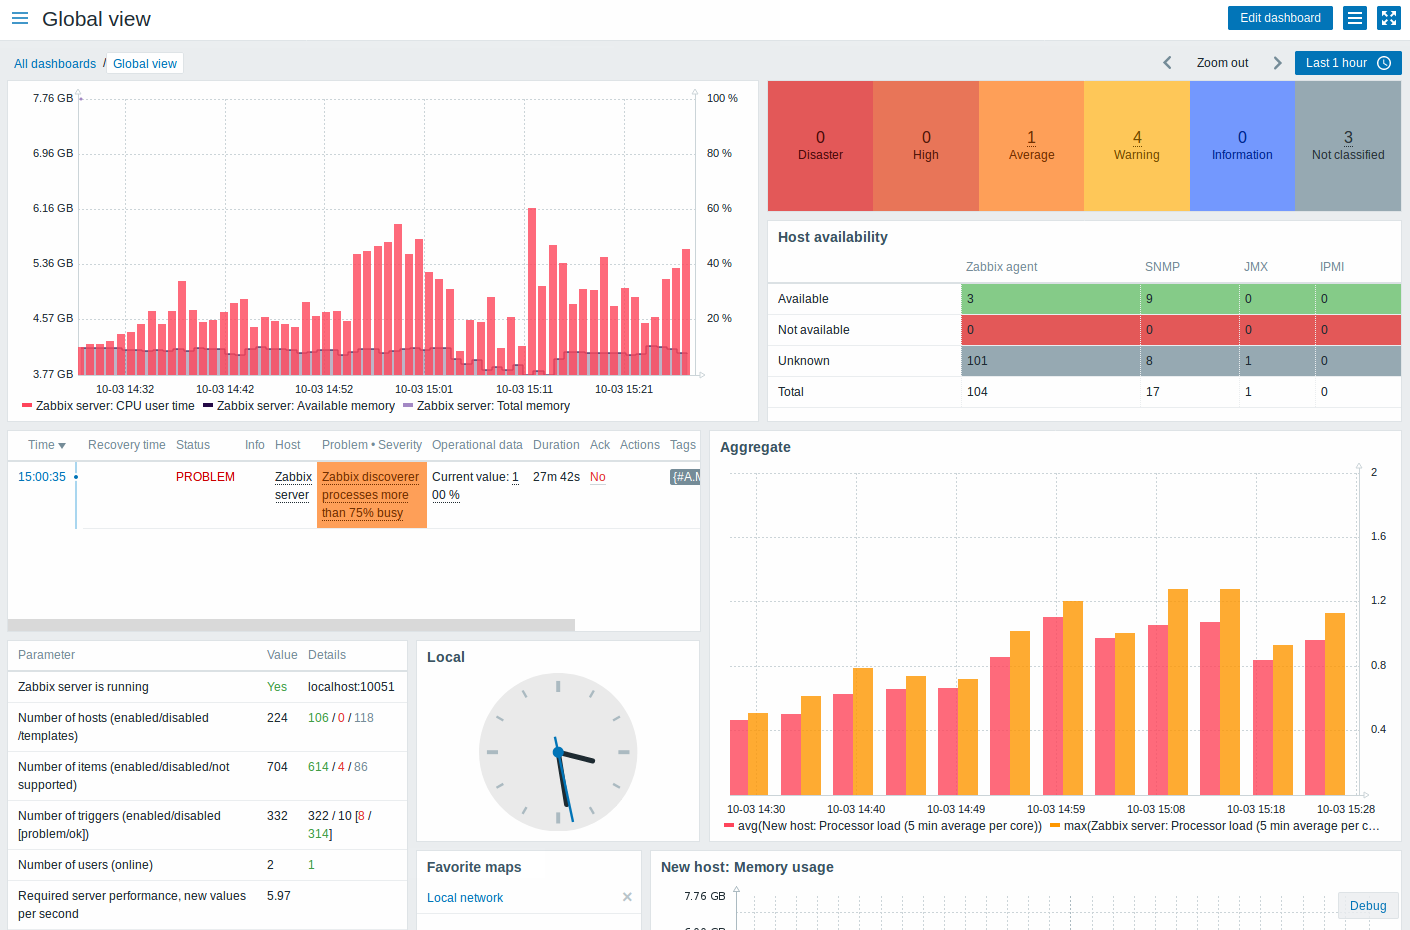
Zabbix gathers various metrics from various sources, such as web monitoring, user service monitoring, and calculation aggregation. The Zabbix agent is a multi-platform service that can also monitor SNMP and IPMI agents. With over 20 years of history, Zabbix first appeared in April 2001, and since then, it has evolved into a complete 100% Enterprise-ready monitoring solution.
Pinpoint
Pinpoint is an Application Performance Management (APM) tool for large-scale and distributed systems written in PHP or Java. It is based on Google's Dapper project.
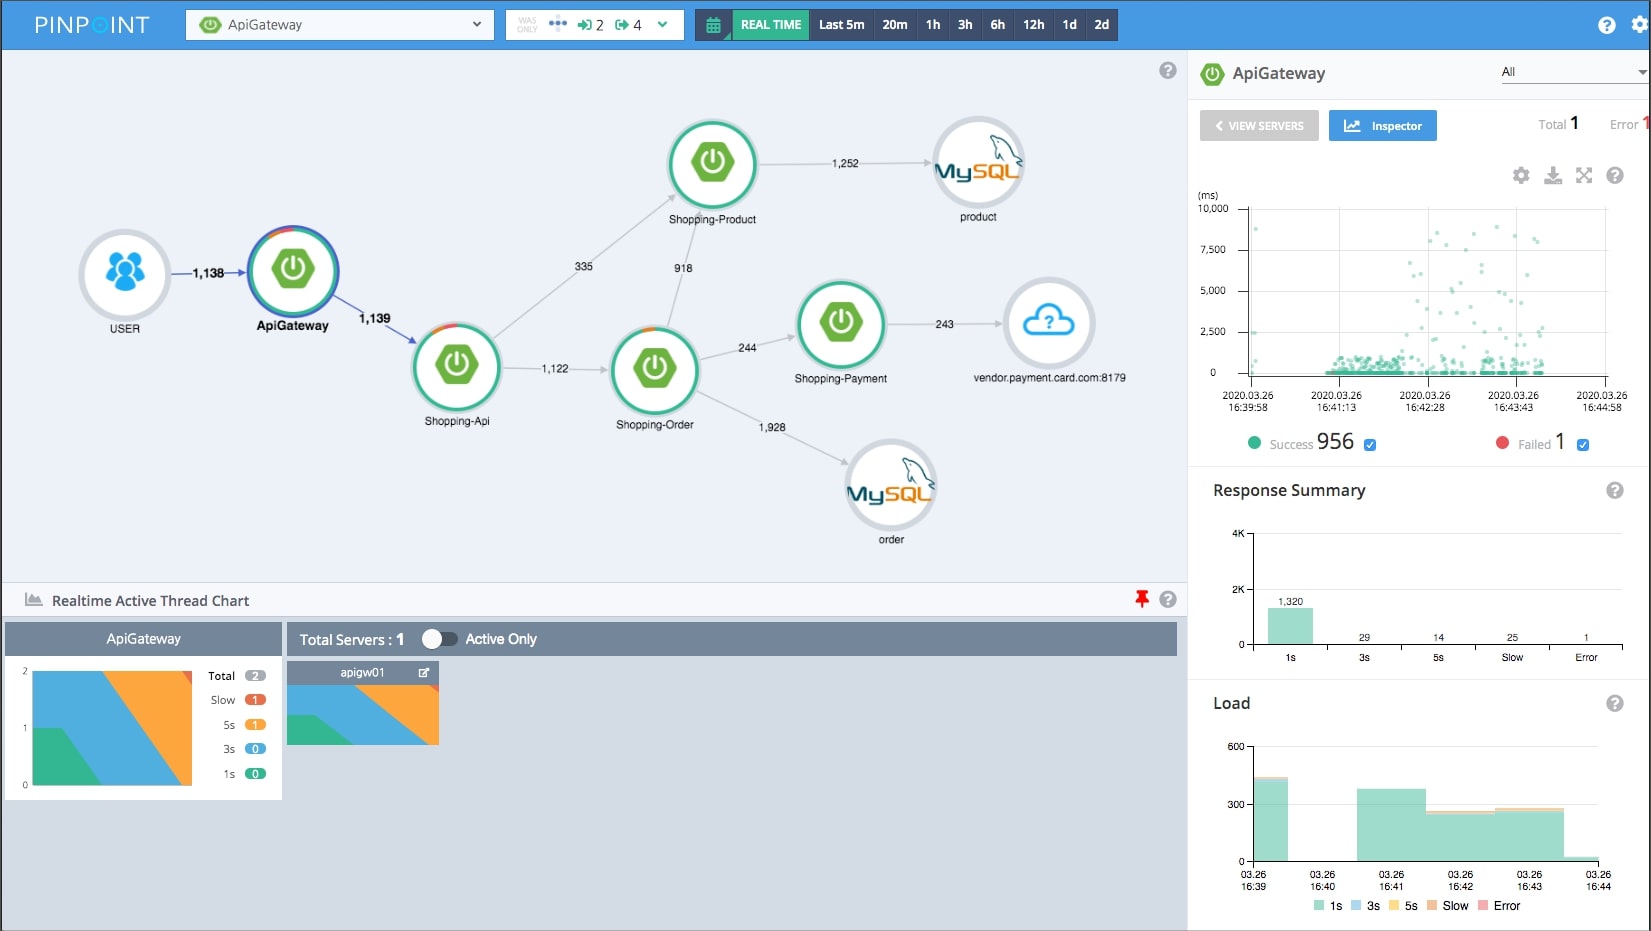
Pinpoint offers a way to comprehend the system's basic structure and how components inside it are connected by tracing transactions across multiple distributed applications. Pinpoint allows users to monitor application metrics in real time and trace the application's performance on every transaction. Pinpoint's APM agents can be deployed to monitor without changing the existing application code and have minimal resource utilization.
Conclusion
Choosing the right open-source APM tool for your company can be daunting. There are many tools available, each with its pros and cons. But, before you choose one, it's essential to understand what you need from an APM tool.
The first step in choosing an open-source APM tool is identifying which metrics are essential for your application: response time, throughput, or errors. Next, evaluate how often these metrics must be collected and analyzed. If metrics need to be collected every second or less, then a low-level agent might not be enough, and you'll need a higher-level agent to collect data more frequently.
Finally, think about how long the analysis part of the process will take and whether it will be worth the investment.
MetricFire offers Hosted Graphite. It enables you to keep data retention for two years, access to the Dashboards, and all other resources you require to analyze your systems and applications thoroughly. With minimal setup, you can easily have the in-depth knowledge you need for your systems and applications.


