
Table of Contents
Great systems are not just built. They are monitored.
MetricFire runs Graphite and Grafana as a fully managed service for growing engineering teams, taking care of storage, scaling, and version updates so your team doesn't have to. Plans start at $19/month, billed per metric namespace rather than per host, and include engineer-staffed support. Integrations work natively with Heroku, AWS, Azure, and GCP, and data is stored with 3× redundancy in SOC2- and ISO:27001-certified data centres.

Introduction
Your app is done and the client is ready to launch! Everything looks great. But how can you ensure that you will achieve your SLA for uptime? How are you tracking revenue growth (& optimizing)? Do you know how many users you have, and what they’re doing at any given moment in the app?
What you need is a monitoring platform that will be able to track these different types of data in one place. There are multiple kinds of application performance monitoring - we recommend MetricFire as the most versatile tool, with a secondary tool called ScoutAPM for additional functionality.
This article will look at a variety of APM tools and identify their strengths and weaknesses. We will compare their benefits/features vs. their price, time to implement, and challenges such as shareability & security.
For example, MetricFire is a time-series monitoring tool that specializes in time-series monitoring and visualizations. MetricFire is built on open-source tools such as Graphite, Grafana, and StatsD. This is particularly important, as there are thousands of engineers continually working on improving these technologies. MetricFire is also one of the best tools for scaling time-series metrics, offering huge flexibility at reasonable pricing. To try out MetricFire, you should book a demo!
Now, let's look at the top 5 mobile app performance monitoring tools.
Key Takeaways
- The article highlights the significance of APM for ensuring the smooth operation of your app, tracking revenue growth, and monitoring user activity.
- To effectively manage APM, choosing the right monitoring platform is crucial. MetricFire is recommended as a versatile tool, with ScoutAPM complementing its capabilities.
- APM encompasses three major categories: Application Discovery, Time-Series Analytics, and In-App User Stats, each serving different monitoring purposes.
- MetricFire: MetricFire is a time-series metrics monitoring tool built on open-source technologies like Graphite, Prometheus, and Grafana. It excels in monitoring backend services, infrastructure, and custom time-series metrics.
- ScoutAPM: ScoutAPM is a complementary tool to MetricFire, specializing in application performance monitoring, including identifying memory issues, slow requests, and performance patterns. It supports various programming languages.
- AppDynamics: AppDynamics is a feature-rich APM tool but is more suitable for large enterprises due to its high cost. Smaller businesses might opt for open-source solutions like MetricFire for scaling.
- Datadog: Datadog is an all-in-one monitoring tool, including APM, infrastructure monitoring, logging, and tracing. However, its pricing can become expensive when scaling beyond the basics.
- GameAnalytics: GameAnalytics is a free tool designed for monitoring user activity in mobile games. It is not suitable for backend monitoring or infrastructure analysis and may require substantial engineering effort to scale.
Application Performance Monitoring
First, what do we mean by Application Performance Monitoring (APM)? Well, there are three major categories of monitoring that get wrapped up into one label. They are:
- Application Discovery - this feature enables you to map out all of the code, microservices, and pieces of your application.
- Time-Series Analytics - provides deep insights into your app, systems & infrastructure over a long period of time.
- In-App User Stats - this is for player stats, inventories, activities, hours played, etc.
MetricFire
MetricFire is a time-series metrics monitoring tool built on the open-source Graphite and Grafana. MetricFire packages the best of these open-source projects into one easy-to-use SaaS.
MetricFire users can send time-series metrics into the platform from any source, and build a custom-designed monitoring solution that fits their technology perfectly. There is also an agent to pull all of the typical metrics in and make it easy to get started.
MetricFire is best used for monitoring backend services and platforms from the perspective of the application. This means that MetricFire is commonly pulling metrics from the app directly, but pulling metrics about query speeds, latency, uptime, and overall CPU/RAM usage of the app.
However, MetricFire can do so much more than just monitor infrastructure. MetricFire can monitor your Redis Databases, Kubernetes, Docker, cAdvisor, and CloudWatch, as well as custom metrics directly from your app. Then, MetricFire can put it all into a single pane of glass in Grafana.
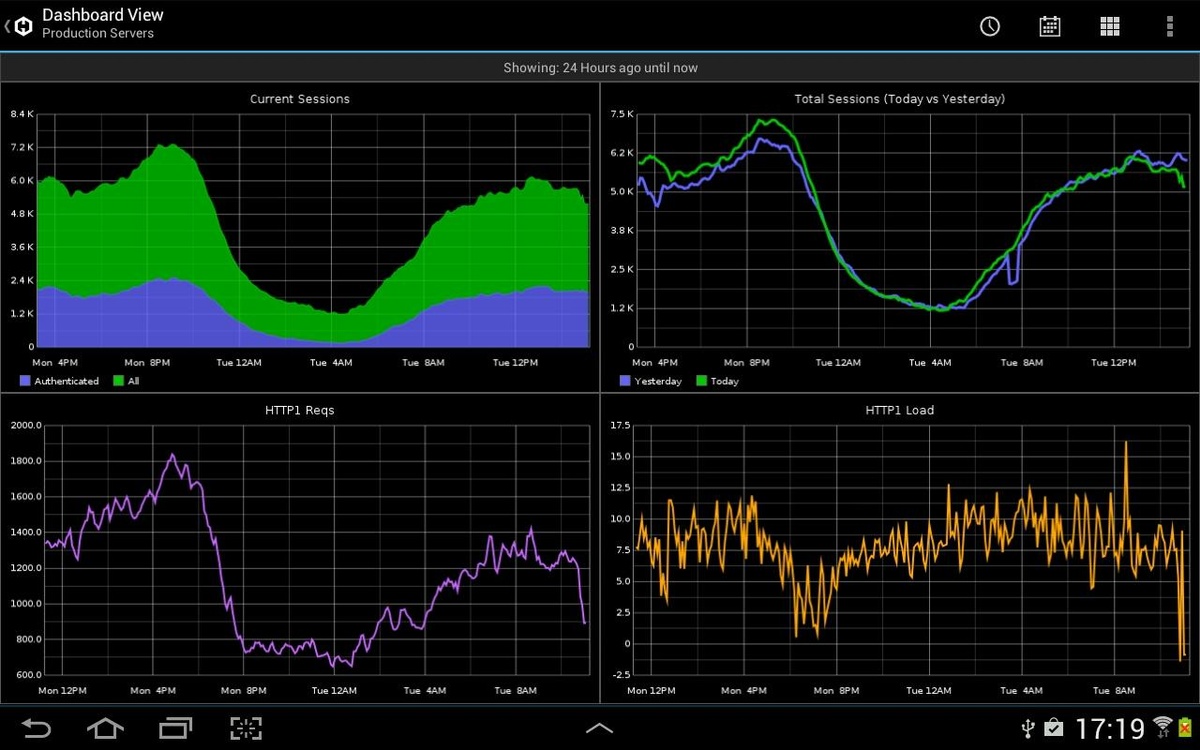
Once your data is in Hosted Grafana, you can build dashboards, query data, and set up alerts on your data.
You can easily configure MetricFire to collect information about your app usage, such as the number of concurrents, the number of people at each level in a mobile game, the number of in-app purchases, and any other metrics unique to your app.
Just check out MetricFire’s customer, HypGames, who uses MetricFire to monitor their game infrastructure as well as their business metrics. HypGames uses MetricFire to monitor their revenue as a time-series metric, as well as using MetricFire as a general backup monitoring tool and infrastructure monitoring tool. MetricFire also works with EA on infrastructure monitoring.
To get started with MetricFire, you should book a demo here!
ScoutAPM
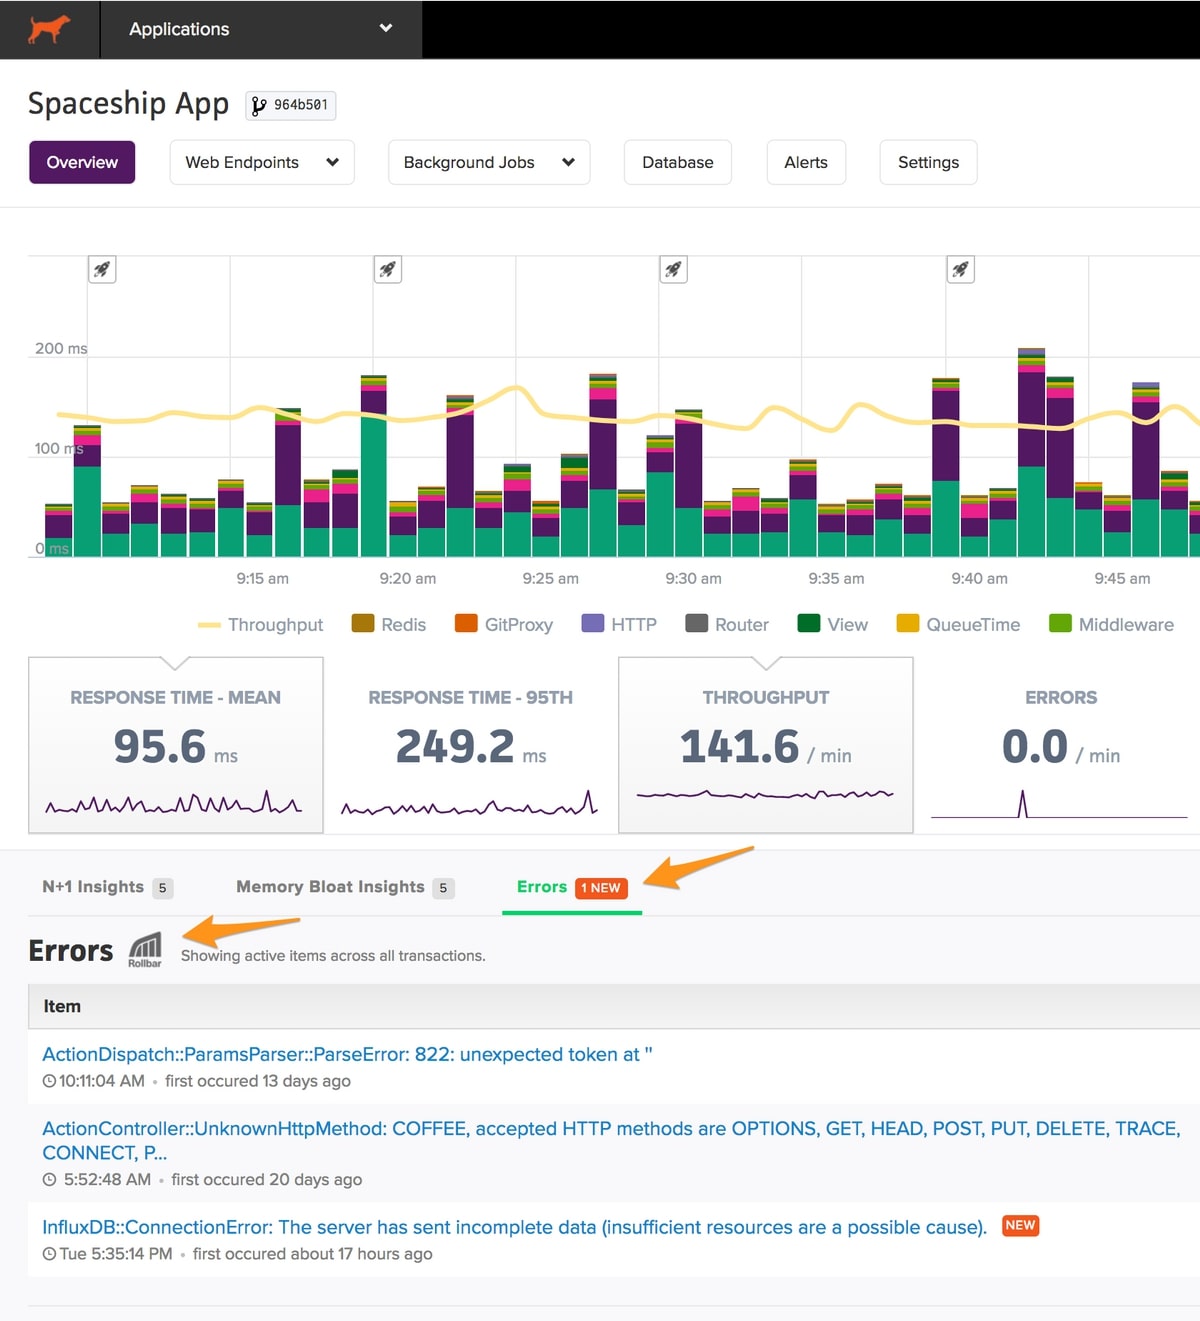
ScoutAPM is a partner with MetricFire and offers a more traditional APM tool for monitoring everything from N+1 database queries and sources of memory bloat to performance abnormalities and more. Scout is a fantastic tool for getting a deep understanding of your application performance, such as:
- Which endpoint is triggering memory increases?
- Are slow requests to an endpoint cascading to the app?
- Why is the endpoint slow for just a few users?
- Has this performance pattern happened before?
- What has changed since the most recent deployment?
ScoutAPM is a boutique company that will bend over backward for its customers. They’re highly flexible and they operate at a lower cost than typical APM tools.
ScoutAPM operates in Ruby, PHP, Python, Nodejs, and Elixir. You can monitor software written in any of these languages by installing the appropriate gem/package - then ScoutAPM will automatically import and display data.
What ScoutAPM can’t do is infrastructure monitoring and custom time-series metrics scaling. ScoutAPM is more of an APM than an overall infrastructure and business metrics monitoring tool. That’s where MetricFire comes in - MetricFire does the infrastructure monitoring and custom time series, whereas ScoutAPM does the application discovery and tracing style monitoring. We often see people interested in using both of these tools at once.
AppDynamics
AppDynamics is a fantastic APM tool with hundreds of features and benefits. It is typically considered the best APM tool out there. AppDynamics can do application discovery, digital experience, and custom time-series metrics, just to name a few. They develop new features frequently and have a massive customer base.
Because of the growing popularity of AppDynamics, and the dependence many people have on AppDynamics, it has developed into a tool that focuses mostly on its massive clients. It can be difficult to get attention from AppDynamics as a small or medium-sized business.
As well, AppDynamics pricing is designed based on what their larger customers are willing to pay. As a result, their prices tend to skyrocket above what a typical business can afford.
Many people use AppDynamics for at least one part of their monitoring - but when it comes to scaling time-series metrics, they opt for an open-source solution or a hosted open source like MetricFire. It’s just too expensive to use AppDynamics for anything above 100,000-time series metrics. It’s best to keep your use of AppDynamics focused - and then for things that get out of hand, check out other tools designed for scaling at a low cost.
Datadog
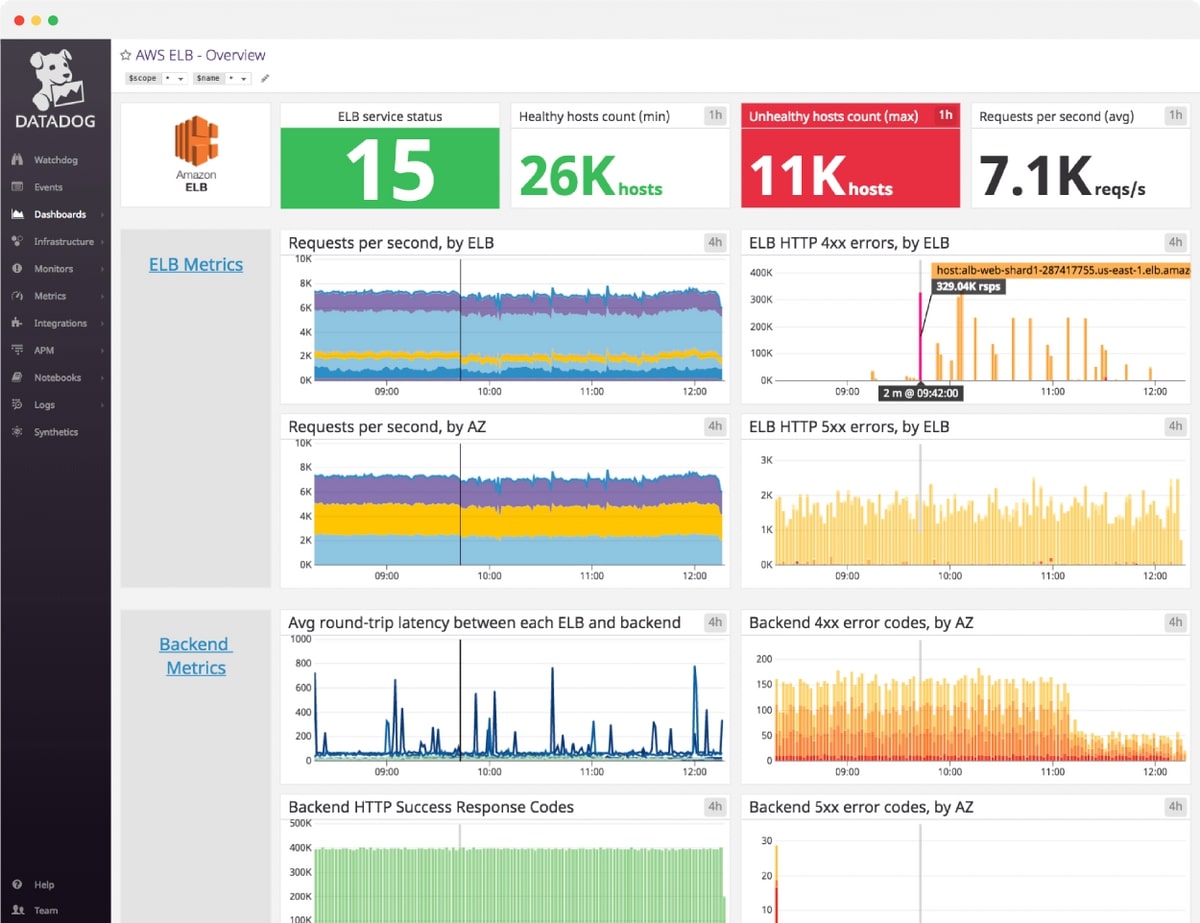
Datadog is an all-around monitoring tool that began as an infrastructure monitoring tool and expanded into an APM, logging, and tracing tool. Datadog is great if you need a little bit of everything. If you need to monitor both your servers and do APM - you can get what you need from Datadog.
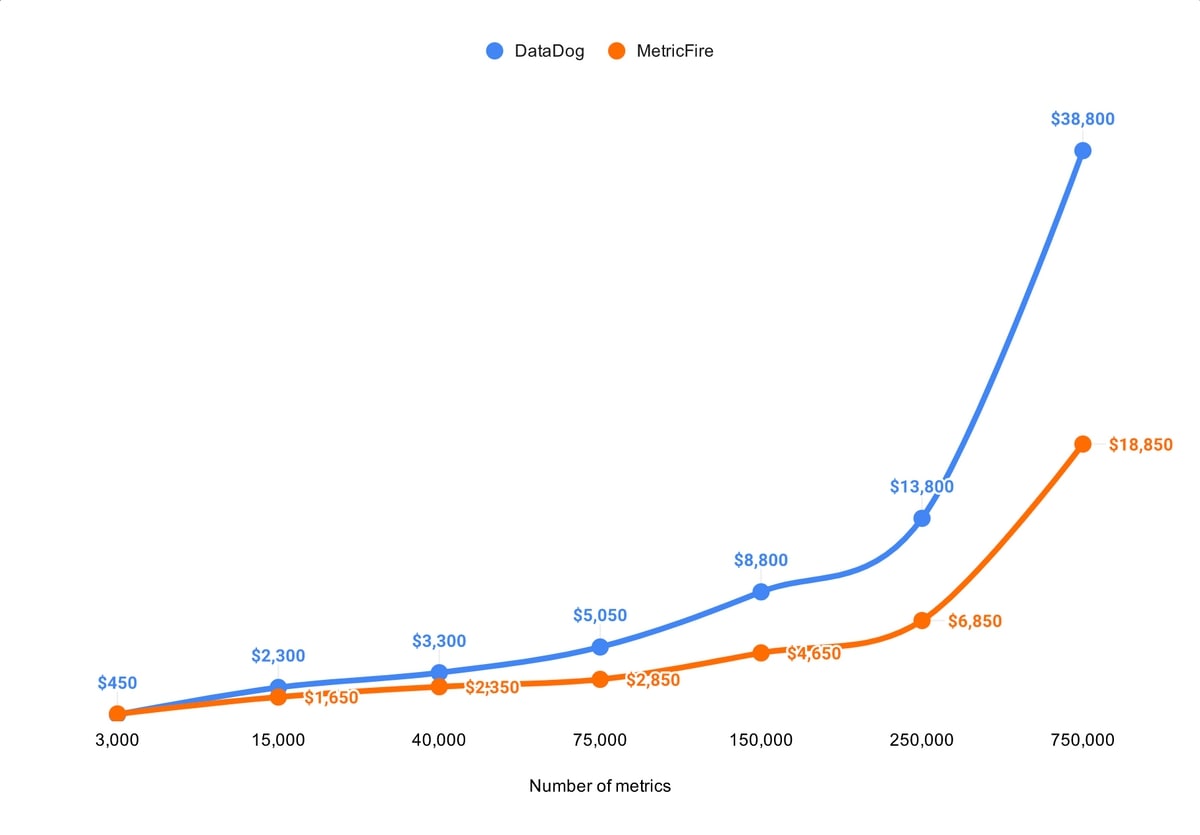
Again, the challenge is when it comes to scaling. The Datadog standard accounts give you a certain number of metrics, so you can always monitor the basics. But if you need to do more than the basics, Datadog gets expensive fast. Custom metrics with DataDog are charged at 5$ for every 100 metrics - for someone monitoring 500,000 metrics on 10 servers it will cost 25,130 USD per month. Just check out this comparison between MetricFire and Datadog on the cost of custom metrics.
You can see the comparison of scaling with Datadog vs. MetricFire in the graph below:
GameAnalytics
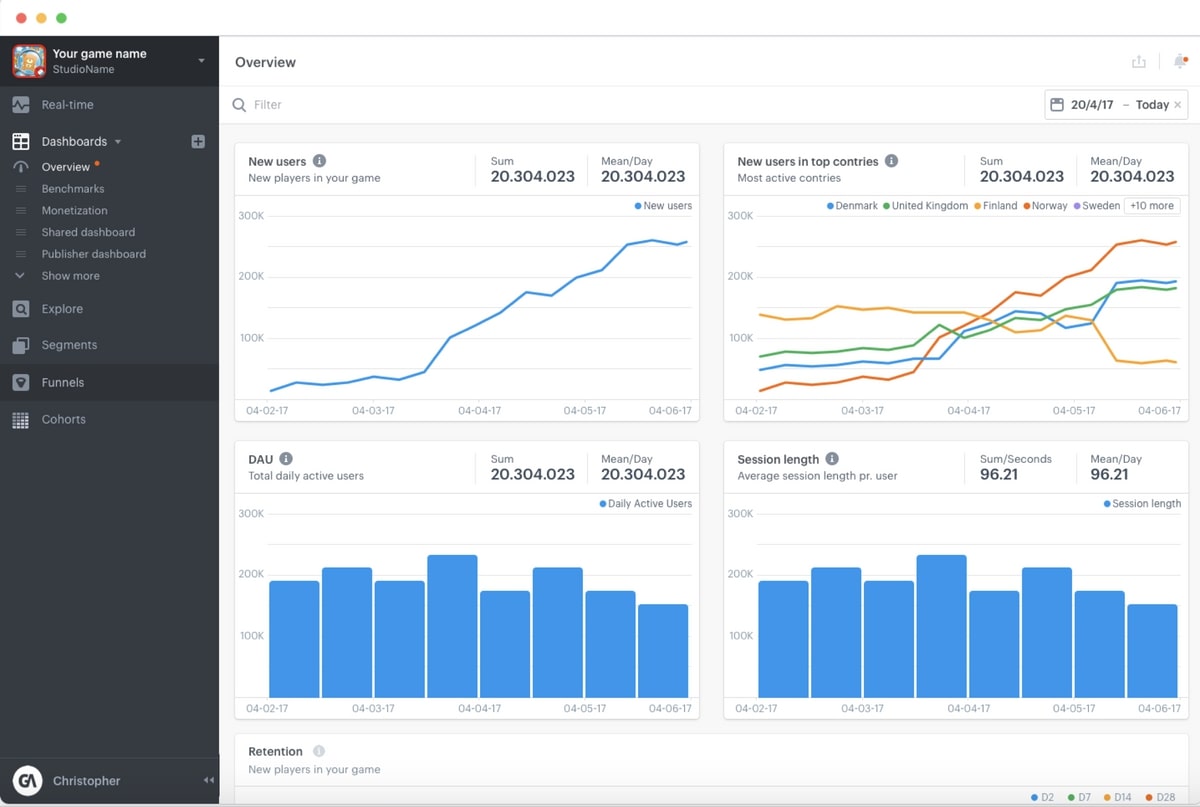
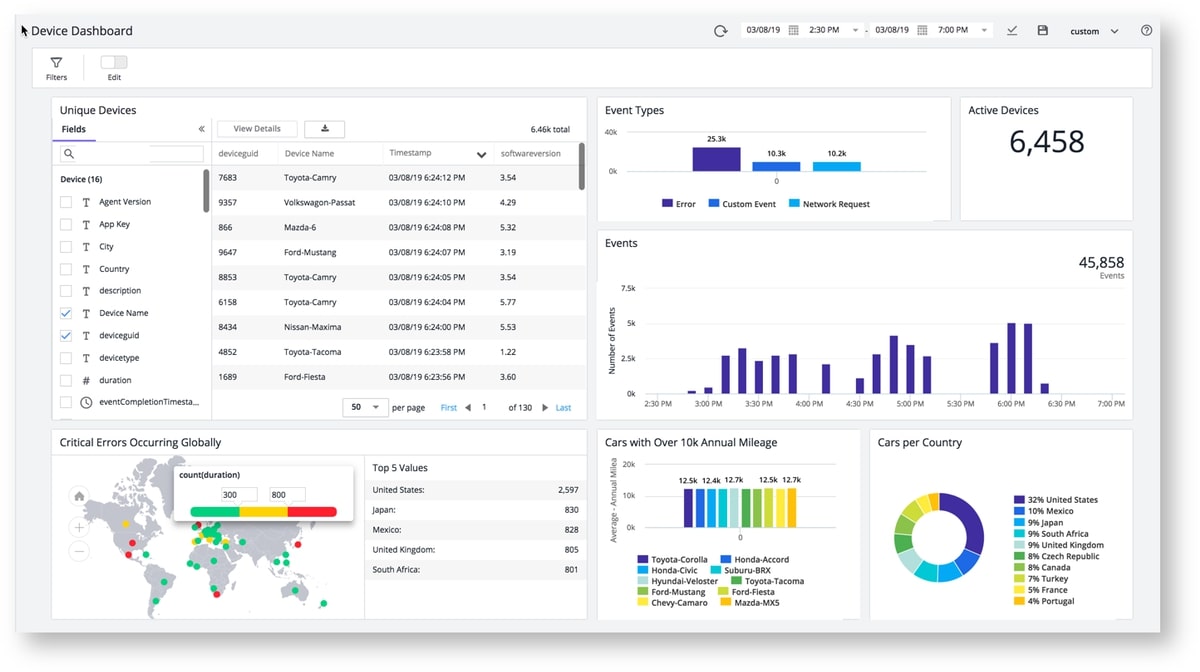
Right now, GameAnalytics is completely free. GameAnalytics is an offshoot of the parent company, Mobvista, which supports and drives the existence of GameAnalytics. GameAnalytics is primarily used to monitor user activity in mobile games, such as:
- User Acquisition
- Player engagement
- Monetization, including drivers of first-time purchases
- Player progression through game content
- In-game economies and virtual resources (e.g. gold, lives, XP)
It can also be used for tracking errors that occur as a part of the user experience, for example, ineffective button actions.
GameAnalytics is everything you need for an in-game user experience monitoring tool. However, since it is free, scaling this tool will require a lot of work on behalf of the engineer. Databases, data pipelines, and the monitoring strategy will need to be entirely built and managed by the engineering team. In cases where the tool doesn’t work as expected, all fire-fighting will need to be done by your in-house engineering team.
As well, GameAnalytics is not a back-end-monitoring tool, nor an Application Discovery monitoring tool, so it is not useful for a lot of the monitoring required to keep a game going. You can’t use it to monitor the infrastructure and platforms resourcing your app or to get deep insight into your code. This activity is better done by tools such as MetricFire and ScoutAPM.
Conclusion
When looking for a tool to monitor your application performance metrics, you need to be looking at in-game user metrics, as well as infrastructure metrics, and business metrics.
MetricFire is an amazing tool because it is built for scaling without the complexity and high prices. With MetricFire, time-series metrics can be scaled cost-effectively, and they can be used with infinite possibilities. You can easily collect time-series metrics from your application on just about anything. When combined with ScoutAPM for Application Discovery, MetricFire is unbeatable for application observability.
To sign up for a MetricFire account, you should book a demo with our team. We can get you on to a free trial, and start monitoring your application metrics immediately!


