

Table of Contents
Great systems are not just built. They are monitored.
MetricFire hosts Graphite & Grafana as a managed service for small engineering teams, taking care of storage, scaling and version updates. Pricing starts at $19/month, billed per namespace metric instead of per host, with engineer-staffed support. Heroku, AWS, Azure, and GCP are natively integrated. We store your data with 3× redundancy in SOC2- and ISO:27001-certified data centres.
Introduction
Instrumental has made the decision to shut down its platform starting August 2022 including its application, servers, and all related APIs being shut down. Users will need to migrate to another solution or risk all their data being permanently deleted!
But Instrumental users need not fret! MetricFire is a full-scale monitoring platform that offers infrastructure, system, and application monitoring using a suite of open-source monitoring tools as well as integrations for robust and easy AWS Infrastructure Monitoring. It’s quick to get started with MetricFire and have your metrics displayed on aesthetically-pleasing dashboards.
Using MetricFire, you can understand complex systems at a glance because of its powerful monitoring capabilities. In this article, we will highlight everything you need to know to understand and be confident that MetricFire is the correct alternative for your monitoring compared to Instrumental.
Sign up for a free MetricFire trial to store, process, and visualize your system metrics with our Hosted Graphite solution. Book a call with our team and talk to us directly about your monitoring needs and get answers to your questions about integrating MetricFire with your system.
Key Features of MetricFire
MetricFire provides a complete ecosystem of end-to-end monitoring. This combines the power of open-source software services such as Hosted Graphite and robust, customizable dashboards. This is as well as, plugins and integrations for a number of other open-source projects including, AWS services, StatsD and Telegraf. You get all these within a hosted environment as a single product. MetricFire is an ideal fit for infrastructure, network, server, application, and business intelligence monitoring use-cases.
Through this hosted environment, MetricFire works to boost the unique features of open-source projects to give you more functionality than the original products. Below are some of MetricFire’s features at a glance:
Easy To Setup AWS Infrastructure Monitoring
It’s easy to integrate AWS services (CloudWatch, EC2, EC2) and MetricFire, and get Amazon CloudWatch interacting with your MetricFire dashboards in minutes. By feeding metrics MetricFire’s AWS add-on you can monitor metrics from applications and servers hosted in AWS with clarity and depth. As soon as you connect your AWS services to MetricFire’s AWS integration we automatically generate 11 different dashboards for you including AWS Billing, AWS Cloudfront, AWS DynamoDB, AWS EBS, AWS EC2, AWS ElastiCache, AWS ELB, AWS RDS, AWS Redshift, AWS Route53, and AWS SQS.
For enterprises that are partially reliant on AWS and/or possess applications that are hosted elsewhere, MetricFire offers varied application metrics to allow users to find correlations between different types of metrics such as web traffic, CPU usage per user, infrastructure load, and much more via customizable dashboards, alerts, and tags.
Additionally, and most importantly for a lot of enterprises, Amazon’s Cloudwatch can be very expensive. Billing on a per metric basis, Cloudwatch charges:
- $0.30 per month for the first 10,000 metrics
- $0.10 per month for the next 240,000 metrics
- $0.05 per month for the next 750,000 metrics
- $0.02 per month for any metrics over 1,000,000
MetricFire has helped customers synergize their enterprise for maximum cost efficiency and make nearly 80% savings in contrast to CloudWatch by utilizing AWS’s many services and servers while leaving the actual monitoring to MetricFire’s Hosted Graphite and dashboards services.
You can check out the MetricFire pricing page here or book a call with us to get a quote and determine if MetricFire is the right service for you!
A Robust Platform to Monitor Your Whole Stack
MetricFire offers consolidated and flexible diagnostics for teams who require metrics from a variety of sources with cloud monitoring for any business scale and various monitoring use cases. MetricFire’s Hosted Graphite service goes beyond the open-source project by offering better data aggregation, pre-setup APIs to maintain dashboards and alerts as code, alerting, and highly available support to get you set up without the steep learning curve. Once you are set up easily share your dashboards with other team members and/or clients for free!
We’ve further supercharged Graphite with up to two years of long-term metric storage and dashboards as part of the hosted package. With robust security as well, your data is secured, as all read and write operations take place over the secure HTTPS protocol.
For running infrastructure monitoring, Send metrics to us however you like with support for numerous collector agents to easily ingest metrics for servers, and services including Docker, MySQL, MongoDB, PostgreSQL, Redis, and others. Have a preferred language you’d like to use? Just send metrics to us directly via your code (.NET, Node.js, Python, Ruby, and more) and see all your application metrics instantly on eye-catching dashboards.
Plug-and-play with Fast and Actionable Alerting
One of the most critical aspects of monitoring your digital assets is being quickly alerted when something goes wrong. Even when you finish building a monitoring stack and expose metrics on a beautifully designed dashboard if you cannot notice abnormal behaviors and fail to take pre-emptive or follow-up actions swiftly.
MetricFire solves this with our alerting system designed to be highly responsive as we alert based on the ingestion of your data rather than upon rendering of metrics in dashboards like other monitoring systems. This is combined with our easy-to-use alerting interface and alert notification integrations (including PagerDuty, Slack, email, and webhooks) for easy integration into any platform.
In addition to being easy to understand, Instrumental's alerts are designed for maximum flexibility. They can also be sent via text SMS, email, and webhooks, which allows for easy integration into any platform, including AWS Lambda functions. As alerting is such a vital component of monitoring we don’t like to limit teams with limits on configurable alerts so we offer unlimited alerts at no additional cost for all plans above our Basic option.
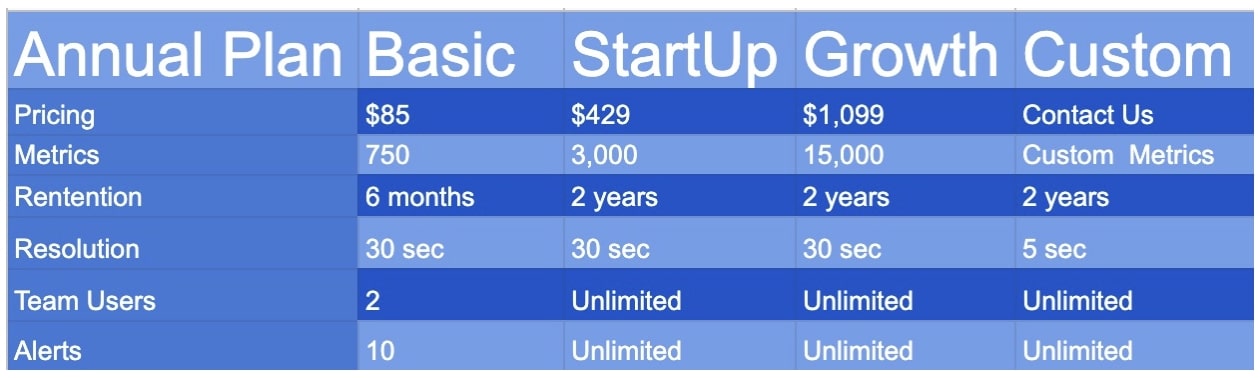
Pricing & Plans to Fit Your Scale
Our pricing is based on the number of unique time series metrics you want to monitor. Our principle is that 1 metric is 1 metric with no differentiating or billing separately between host (CPU) metrics, custom metrics, or tagged metrics. On top of this, we don’t charge for the number of servers or containers you are monitoring.
MetricFire has designed plans according to the needs of different organization types. Beyond this, we offer customized plans that fit your usage for the highest value. Additionally, to make sure teams get the most value from our platform there are no extra charges for users, alerts, plug-ins, and integrations.
MetricFire is dedicated to supporting all our customers to get the most out of the MetricFire product. We’re here to consult customers on the best alerting and monitoring design with highly responsive support via email, chat, or phone.
We work with our customers to build out metrics so we can meet their needs, and to build custom dashboards in the cases where the defaults are not quite right. Jump on a call with us by booking a demo, and we’ll be happy to talk more about what your company is looking to monitor.
Additional Benefits of MetricFire
Suite of APIs
We have developed a variety of APIs for you to easily build your own integrations to Hosted Graphite tools and maintain dashboards and alerts as code.
Budgeting
A structured pricing model allows you to save time and work within your budget. Predictable and transparent pricing combined with numerous tools to manage your metrics allow you to keep your costs in check, plan for the future and ensure that you are only monitoring what provides value to your business.
Transparency
MetricFire works transparently on all aspects of our operations of SaaS system monitoring. You can see our own internal system metrics on our public status page.
Robust Support
Technical support is provided by engineers for engineers, so you can expect detailed and relevant answers to your queries
Enterprise-ready
Need to send a high number of Data Points Per Second? We’re ready for it! MetricFire is able to handle large data sets without sacrificing query times and we offer dedicated clusters for users that need their own environment.
Conclusion
MetricFire is a great alternative to Instrumental’s AWS, infrastructure and application monitoring platform. Not only will you benefit from the stability and security of MetricFire’s hosted monitoring platform, but you can also benefit from the additional features unique to MetricFire’s enhancements of open-source tools.
MetricFire is constantly updating and offering new features, so you never have to worry about setup, server costs, troubleshooting, security updates, and server management. At MetricFire, we handle those issues so you can focus your time, resources, and money on your business’s revenue-generating projects.
We offer a free 14-day trial which gives you a full taste of Hosted Graphite, our dashboards, integrations with AWS, and more. The trial comes with a soft limit of 750 metrics, but you can just jump on a call with us, let us know what you want to monitor, and ask for more or if you’re not sure where to begin, someone from our team can help you figure out where to begin on a demo.


