
Table of Contents
Great systems are not just built. They are monitored.
MetricFire runs Graphite and Grafana as a fully managed service for growing engineering teams, taking care of storage, scaling, and version updates so your team doesn't have to. Plans start at $19/month, billed per metric namespace rather than per host, and include engineer-staffed support. Integrations work natively with Heroku, AWS, Azure, and GCP, and data is stored with 3× redundancy in SOC2- and ISO:27001-certified data centres.
Introduction
As a mobile game developer, you need to monitor many components of your game. Everything from the servers hosting your game to your best players and your best-converting actions. That’s a lot of data, and it’s hard to know how to get the most out of it.
This article will examine the KPIs (Key Performance Indicators) you need to monitor, the best tools for monitoring these metrics, and how to handle this data effectively.
Key Takeaways
- Why it is important to monitor KPIs in mobile game development.
- Key metrics to monitor: in-game, business, application performance, and infrastructure metrics.
- Recommended tools: ScoutAPM for application discovery, GameAnalytics for user-stat monitoring, Mixpanel for front-end metrics, and Firebase for business metrics.
- Using Grafana as a centralized dashboarding platform.
What you need to monitor
When monitoring a mobile game application, you need to monitor metrics from the following categories:
In-game metrics
- Number of users
- The level of each user
- Inventory items of the user
- In-game economies, currencies
In-game metrics are the type of metrics that are unique to the game you’re working with. You’ll want to track how many users move through different parts of your game. You need to know who gets to which levels and how many people are at each level, and then deduce how challenging it is to move through the game's levels. It is essential to watch the areas surrounding your conversion points - if it’s too difficult/easy for users to buy something, you need to know.
Business metrics
- Revenue earned from in-app purchases
- Microtransactions
- Cost of goods and services
- The lifetime value of a customer
While the finance team commonly handles many of these metrics, developers still need to extract financial data directly from the mobile game. Your mobile game code is the primary source of information related to transactions.
In many cases, data being monitored by the developers will be compared to data being collected by transaction tools such as Google or Apple Pay. This will give you more confidence in your figures, as there will be two data sources to compare. You’ll also get two different perspectives on your business metrics, as you’ll see the granular micro-transactions visible in your code and the totals supplied by Google and Apple platforms. For subscription-based games, platforms like Baremetrics provide comprehensive subscription analytics and revenue recovery tools that can help you track MRR, churn, and failed-payment recovery across multiple payment processors.
Application performance metrics
- Memory bloat
- Memory increases
- Request speeds
- Latency
- Query speeds
- Error rate
This metric type informs you how well your app’s machinery performs. There are a few kinds of monitoring you will need to do in this area. You will need to do Application Discovery, where you do a full scan of your code to find the inefficiencies in your design. Beyond that, you need to plan an extensive set of time-series metrics to monitor how your app is performing at a user-experience level. You need to know how your microservices are behaving, i.e. with what kind of latency and uptime. You need to know how fast your page loads. And more, you need to know what’s not working and when and where that problem started.
After planning out your time-series metrics monitoring strategy, you will also need a logging and tracing tool to help you map out errors and fix them quickly.
Infrastructure metrics
- Uptime
- CPU
- RAM
Infrastructure metrics are also built on metrics, such as logging and tracing tech stack, but they focus on monitoring the infrastructure rather than the application. Infrastructure monitoring includes server metrics and the significant systems and platforms your application is built on. For example, you may need to monitor Kubernetes setups or CI/CD platforms such as CircleCi, Zuul, Chef, Spinnaker, etc. It’s also common to monitor GitHub to ensure you’re always correlating code changes with game performance changes.
Now that we know what we need to monitor, it becomes evident that the number of tools required can be immense. What is the best stack of tools to do all of this monitoring? In the next section, we’ll look at the best tools available and how to combine them.
Best tools for monitoring mobile game performance
MetricFire
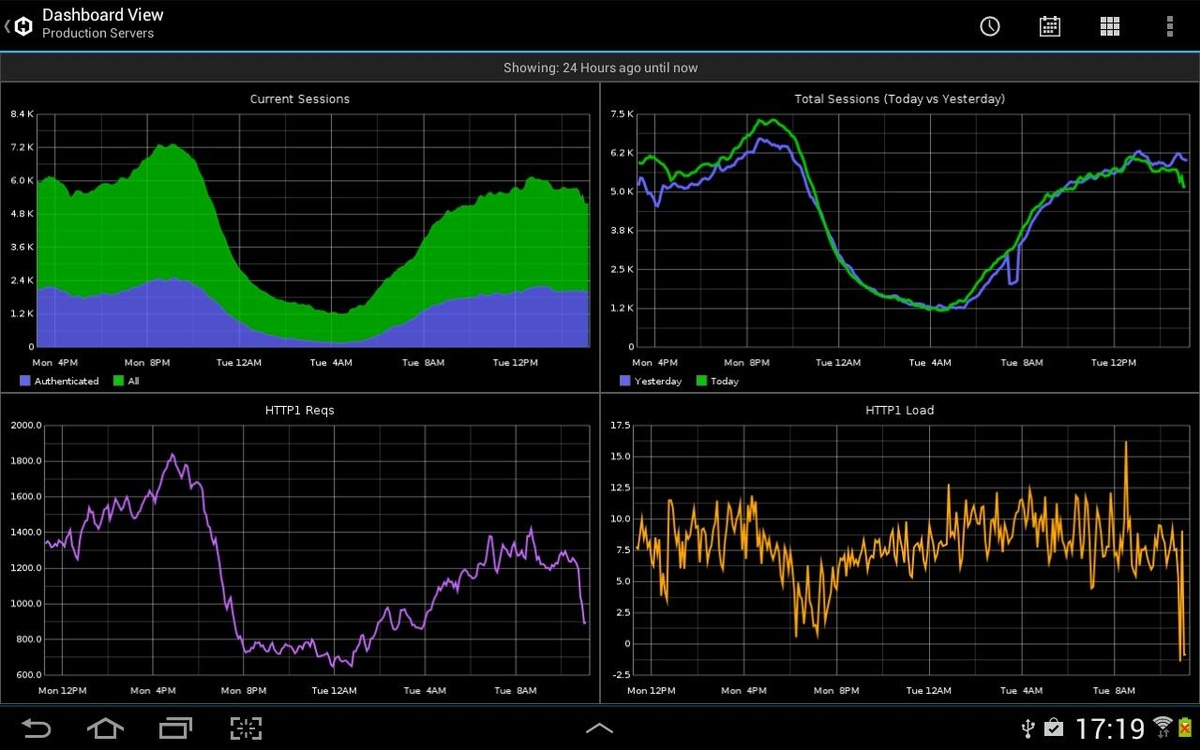
MetricFire is an exciting tool because, at its core, it’s straightforward. It monitors time-series metrics and provides visualizations and alerts based on that monitoring. That’s it.
The fantastic thing about MetricFire is that it’s built on open-source Graphite and Grafana. Because MetricFire is built on these open-source projects, thousands of developers work daily to adapt and expand this technology to any required use case. This makes MetricFire applicable to hundreds of use cases within the time-series metrics monitoring world.
MetricFire users use MetricFire to monitor infrastructure, application, business, and user experience metrics.
In the infrastructure world, MetricFire can be configured to plug into more than 30 AWS microservices, such as EC2, EKS, and CloudWatch.
MetricFire can be configured to collect any data in a coded environment over time in the business, application, and user-experience world. Between the available Hosted Graphite, StatsD, and collectd solutions, any expressed data point can be pushed or pulled into the MetricFire dashboard. MetricFire’s support team can help you configure your data with any 300+ Grafana plugins, other collectors, or custom scripts. You should book a demo and talk to the team!
ScoutAPM
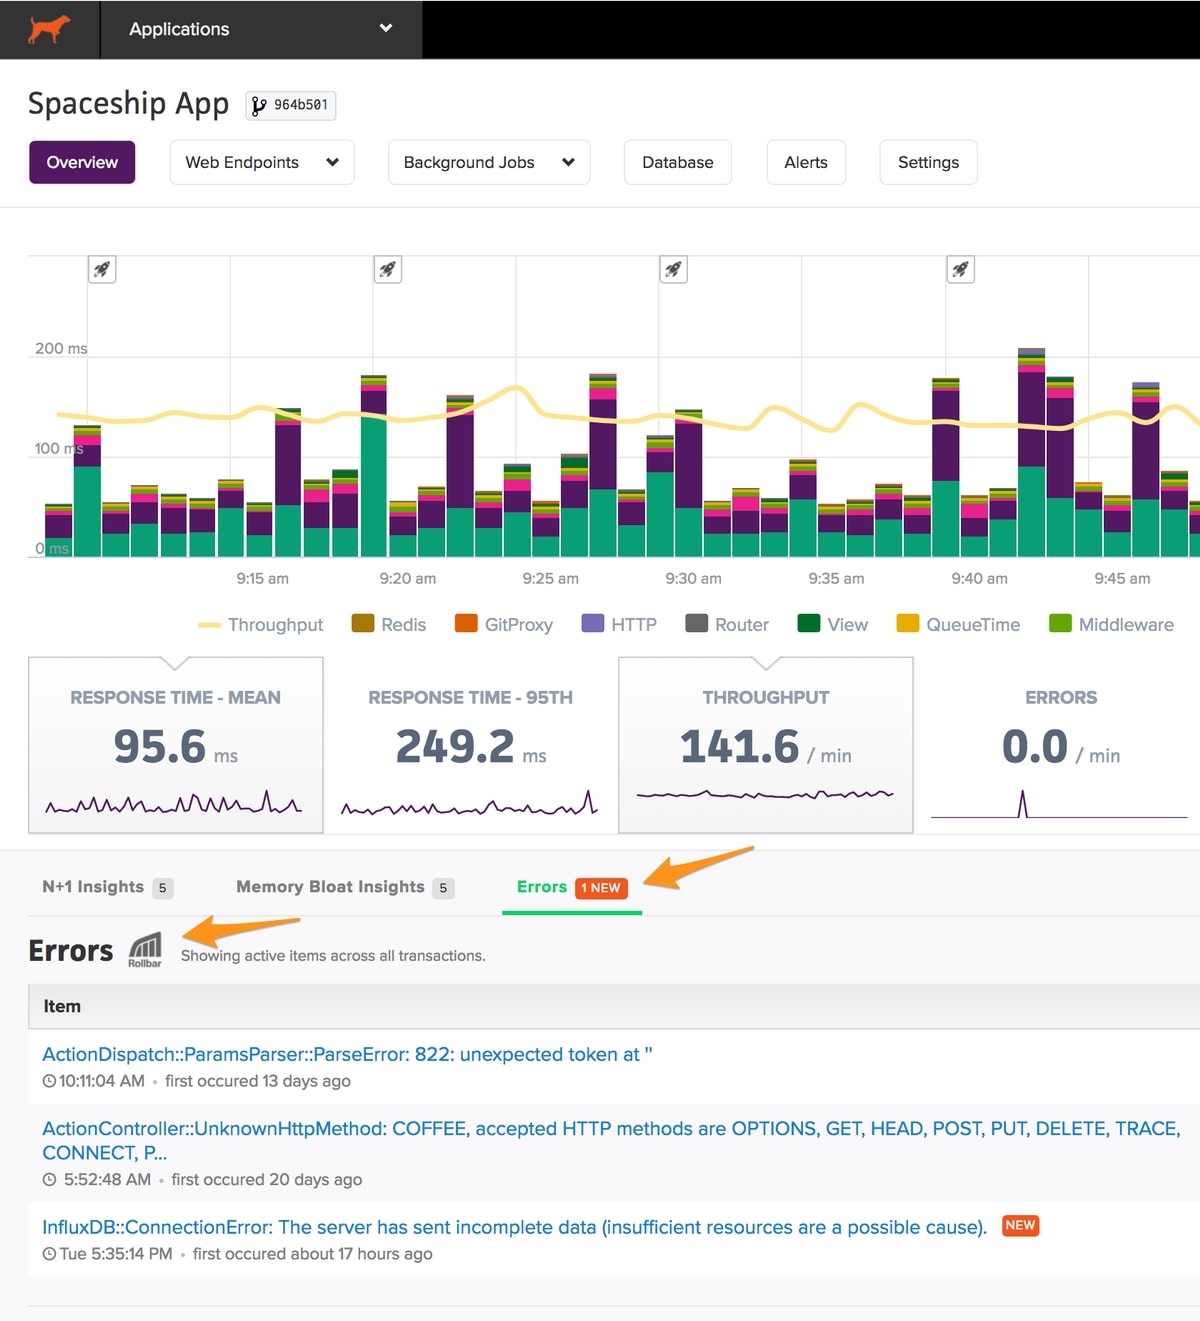
One of MetricFire’s biggest downfalls is its lack of Application Discovery and memory bloat source identification. In this area of application and mobile game monitoring, the strongest tool is ScoutAPM.
While ScoutAPM can’t be used for infrastructure monitoring or general time-series monitoring, it can do everything you need to continually track down N+1 database queries, source memory bloat, identify performance abnormalities, and more.
As well, ScoutAPM is a partner of MetricFire! This means there is much cross-product experience within the MetricFire and ScoutAPM teams. If you’re using both products, you’ll get great support from engineers familiar with that situation.
GameAnalytics
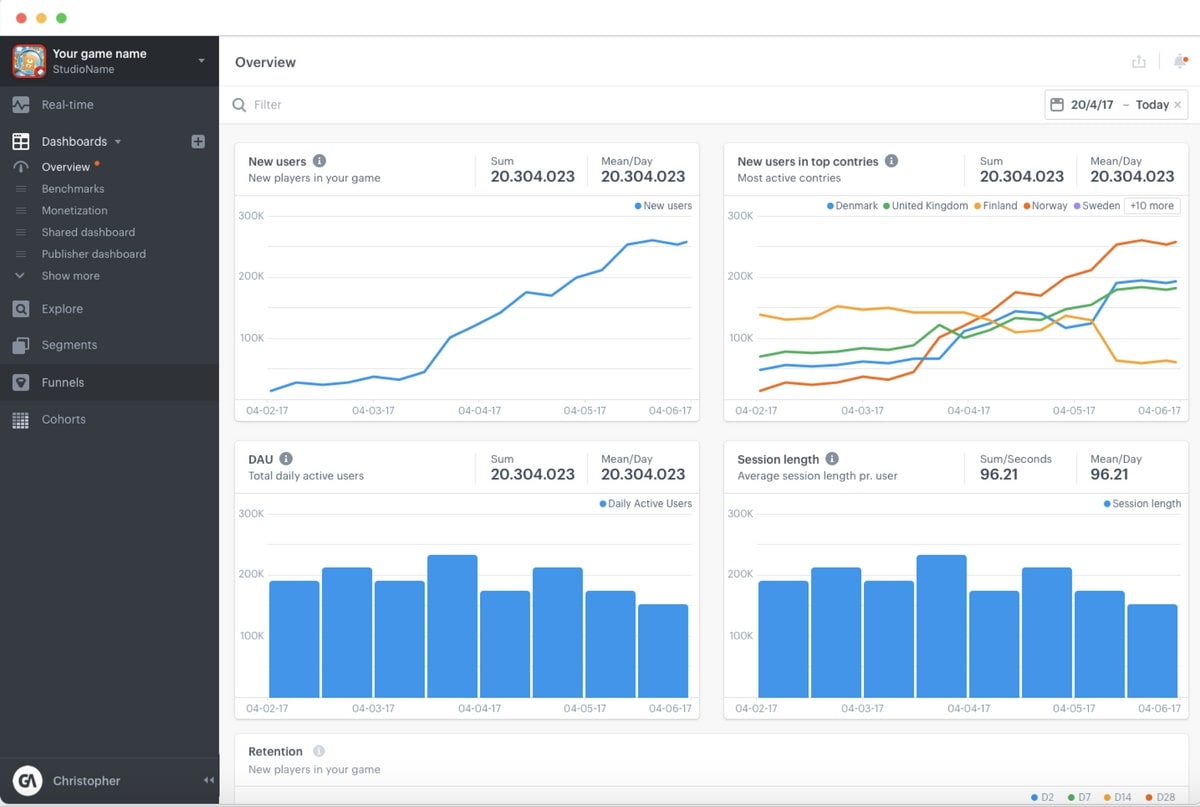
GameAnalytics is a free user-stats monitoring tool. While it can’t be used to monitor infrastructure or to do advanced time-series monitoring, it can keep track of your users and their actions in the game.
GameAnalytics advertises itself as being able to monitor these metrics:
- User Acquisition
- Player engagement
- Monetization, including drivers of first-time purchases
- Player progression through game content
- In-game economies and virtual resources (e.g. gold, lives, XP)
The dashboard is fantastic, too, with many panels and graphs. GameAnalytics doesn’t do alerts and notifications through, so it is more of a business and activity monitoring tool than an SRE/DevOps tool.
Mixpanel
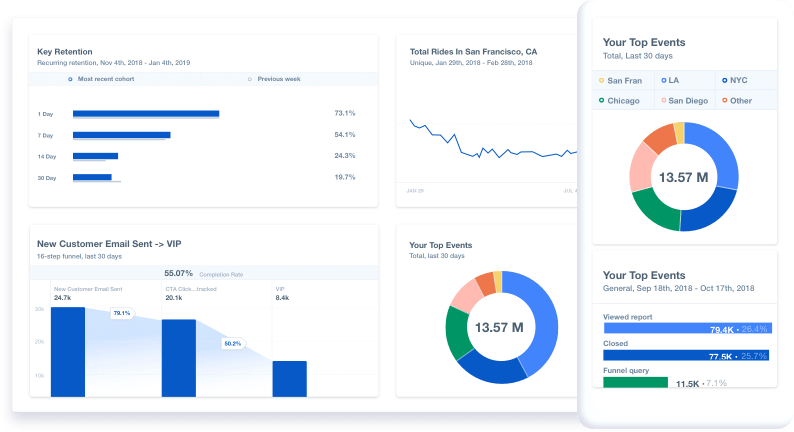
Mixpanel is a favorite among mobile game developers for monitoring their front-end metrics. It integrates directly with all of the most popular SDKs, from iOS and Android to Ruby, JavaScript, Node.Js, Unity, and more. Mixpanel also has several APIs for ingesting, querying, exporting, building pipelines, and even interacting with schemas.
Mixpanel isn’t a great tool for application discovery or infrastructure monitoring, but it is a great tool for visualizing front-end metrics and analyzing user experience. The dashboards are easy to use, and Mixpanel has special features and integrations depending on your industry.
Firebase
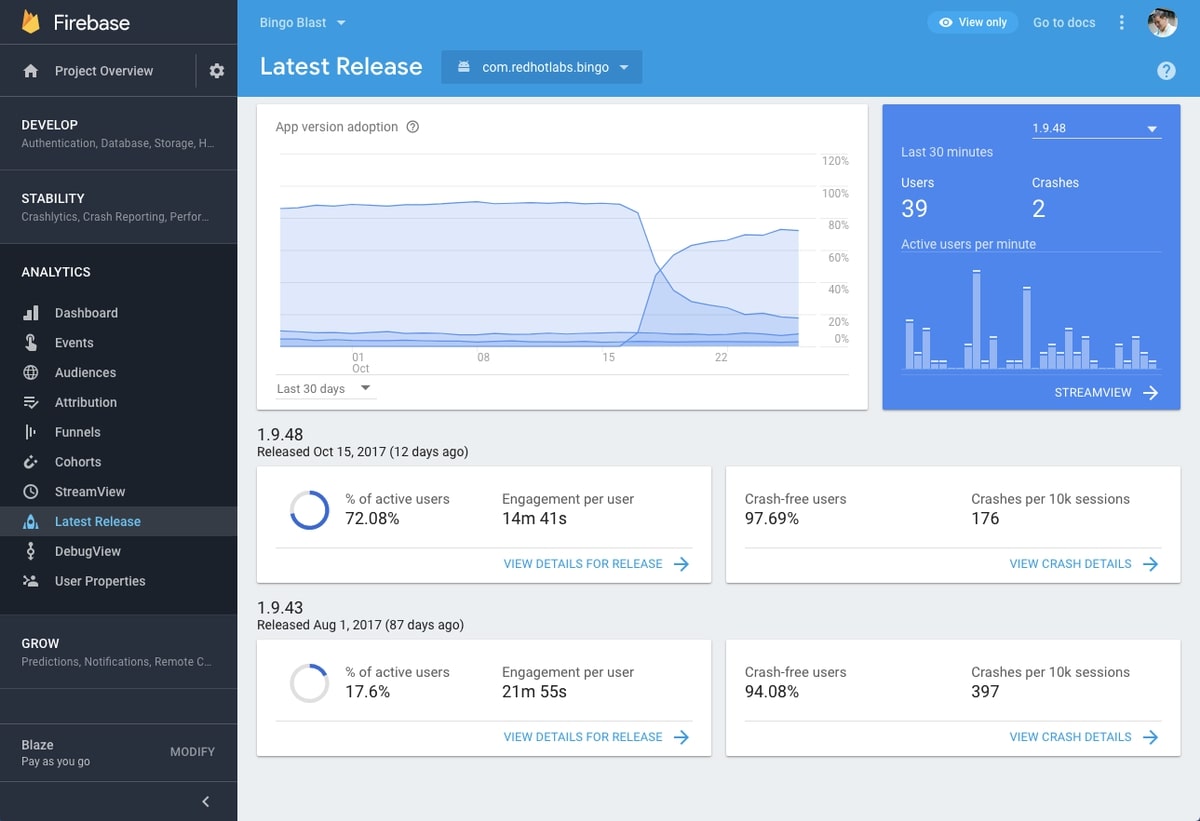
Firebase is a fantastic tool for business metrics and user activity. Their website advertises a bunch of features that are all focused on monitoring your app and your business. You can get business metrics that improve business visibility, performance monitoring, database monitoring, and Google Analytics plugins.
Firebase even supports tools for business growth, such as in-app messaging, A/B testing, cloud messaging, and dynamic links. It’s excellent for business monitoring, applying new growth tools, and optimizing the front end of your application.
However, Firebase doesn’t do time-series monitoring or custom metrics. Therefore, you depend on what their agents can collect and their in-house configurations to monitor your apps. You won’t be able to do creative configurations to monitor something very unique to your app. You also won’t be able to pull in infrastructure metrics, or platform metrics (such as Kubernetes or Docker), to get complete visibility of how your infrastructure affects your app.
To get a fuller picture of what you’re monitoring, the best option is to use a dashboarding platform like Grafana. Hosted Grafana by MetricFire can pull tons of information into one place, so you only need to use one interface.
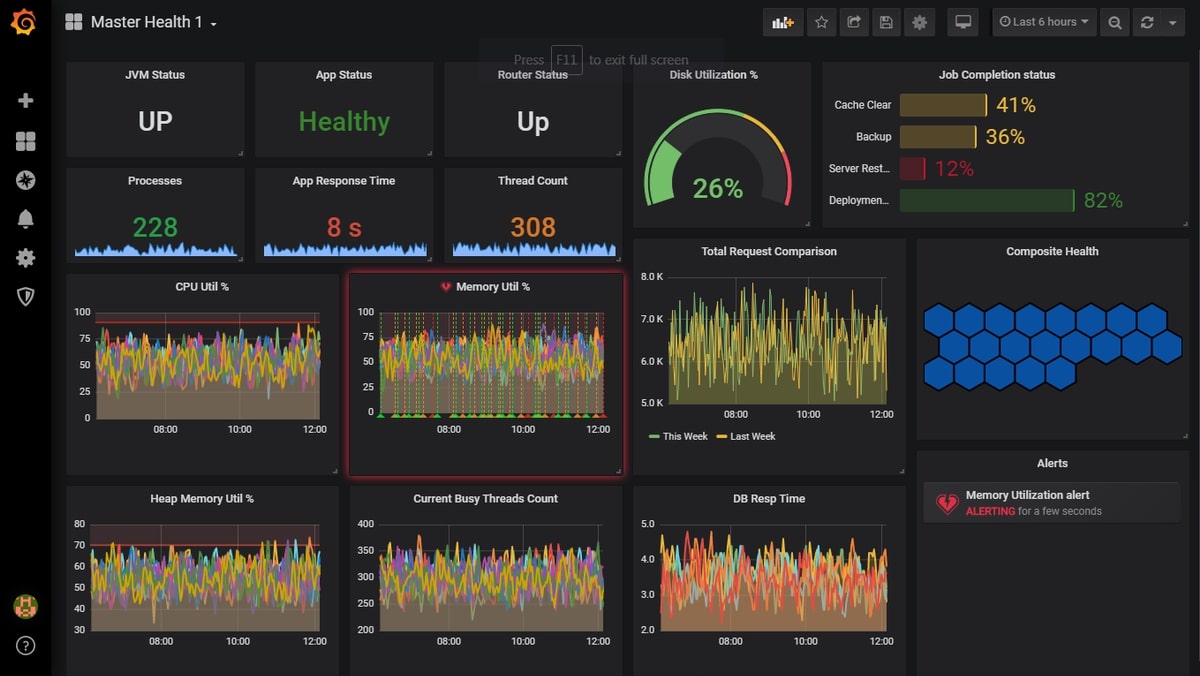
Creating a single pane of glass
The biggest problem in monitoring today is getting your information in one place. We need to monitor information from many sources, and every piece has a different structure or style. Time series, log files, single stats, speeds, totals, predictions, maxed-out resources, and alerts exist.
How do you know what’s essential? How do you get around our natural human tendency to miss things that are not blaring red flags?
It would be best to create a single pane of glass that shows you the most essential information at a glance. You need to pull in your information to a master dashboard that shows you your tools and gives you an orientation on what you will do that day.
The best way to create a single pane of glass is with Grafana. Grafana has 300+ plugins that let you integrate with your entire technology stack. You can pull in your logs with Elasticsearch and Grafana integration. You can visualize your logs next to your time series with a Prometheus and Grafana integration. You can get annotations automatically published to your revenue graphs indicating when new deploys were made via GitHub or CircleCi. Get significant thresholds alerted on and get notifications of emergencies so you can react even in the middle of the night.
Hosted Grafana by MetricFire makes this process even more accessible. Setting up Grafana can be difficult because it’s open source. Managing an open-source tool is challenging and requires much time and resources. You’re probably also managing the data sources, applications, and customers. MetricFire makes monitoring easier so you can focus on what you need to do.
MetricFire hosts Graphite and Grafana to get great time-series metrics with an easy-to-use SaaS. You can pull in your logging tools and other data sources quickly, as Grafana is extremely easy to integrate. MetricFire’s support team will set up the integrations for you, so you don’t need to do any dev work. Check out our mobile gaming customers here, and see their use-case with MetricFire!
How MetricFire Can Help
MetricFire is one of the best tools for monitoring mobile game performance. It is a time-series metrics monitoring tool that allows you to scale time series at a low cost and with the opportunity for flexible use. While there are hundreds of tools available, MetricFire is the only tool with the flexibility to cover multiple areas of monitoring without costing your firstborn child.
MetricFire has been working with game developers such as HypGames and EA to help provide a consistently excellent gaming experience for users by:
- Identifying & alerting on periods of low latency
- Identifying & alerting on uptime issues
- Error reporting
- Infrastructure monitoring
- Tracking revenue
- & more
MetricFire is a time-series monitoring tool built on the open-source Graphite and Graphite - giving MetricFire users the best of open-source bundled into a ready-to-use SaaS.
This article looks at how to use monitoring to deliver the best possible user experience. Book a demo with MetricFire and start the free trial!
Conclusion
When monitoring mobile games, you have a lot to consider. You will definitely need more than one tool, backups, and many important kinds of data.
Make sure you use a tool that is easy to integrate and flexible so that you can incorporate new data types and needs as your business grows. Also, choose a tool that doesn’t get expensive as you scale. Many tools are free for small developers but cost a fortune for major businesses.
MetricFire is a very flexible and easy-to-integrate tool. It is built on open-source projects and has an open-source mentality at its core. MetricFire also has Grafana as part of its stack, so you can benefit from the broad range of plugins that work with Grafana while also getting Graphite as a hosted service.
To get started with MetricFire, book a demo! You can get on the call with us and get started in minutes.