
Table of Contents
Great systems are not just built. They are monitored.
MetricFire runs Graphite and Grafana as a fully managed service for growing engineering teams, taking care of storage, scaling, and version updates so your team doesn't have to. Plans start at $19/month, billed per metric namespace rather than per host, and include engineer-staffed support. Integrations work natively with Heroku, AWS, Azure, and GCP, and data is stored with 3× redundancy in SOC2- and ISO:27001-certified data centres.
The problem: We are monitoring our app’s server with MetricFire's Hosted Graphite, and we are also using CircleCI for our automated testing and deployment. Every time a test passes and deploys, we want to see what effects it has on our systems. This way we can fix our tests if something does not produce the outcome we want.
What is CircleCI? It is a service that lets you automate testing and deployment on your app/service by analyzing the code on GitHub or other code version control hosting services. By adding CircleCI annotations to our Hosted Graphite graphs, we can keep track of which passed tests have affected our system performance (negatively or positively). This can also help to prioritize what to fix first, as a highly negative impact should have high priority.
If you don't know much about webhooks yet, I would recommend you give our article a quick read to understand how we are implementing the service in this article.
The Setup
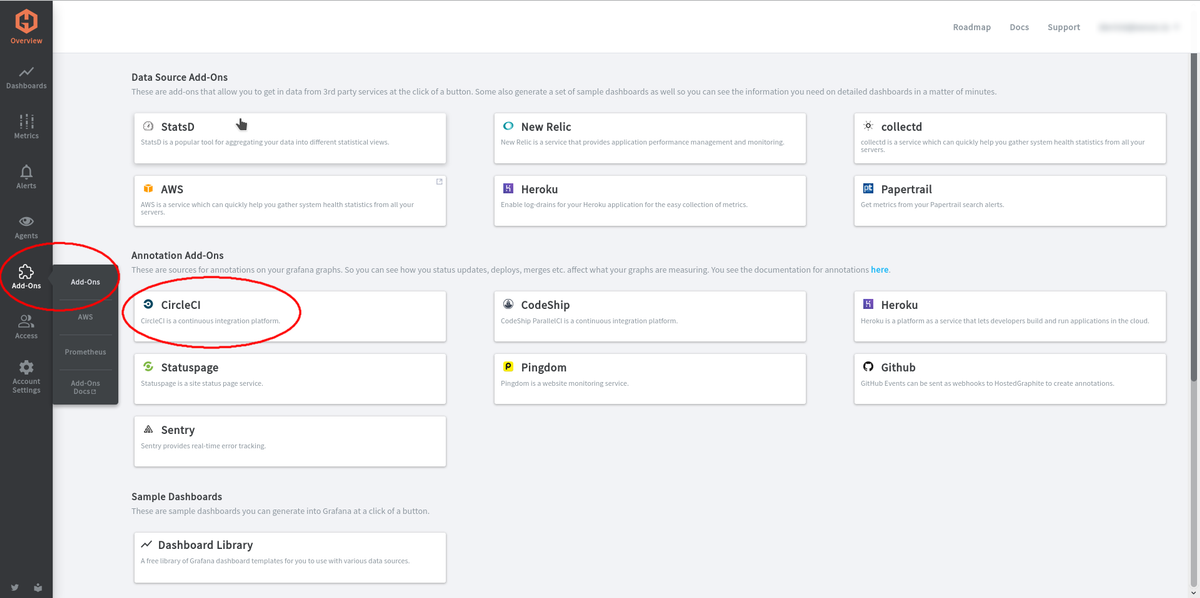
CircleCI side: First, we need our webhook URL, go to our Hosted Graphite dashboard. Then go to Add-ons > Add-ons, and then the CircleCI Annotations Add-on. Check out our Hosted Graphite free trial, and follow along on your dashboards!
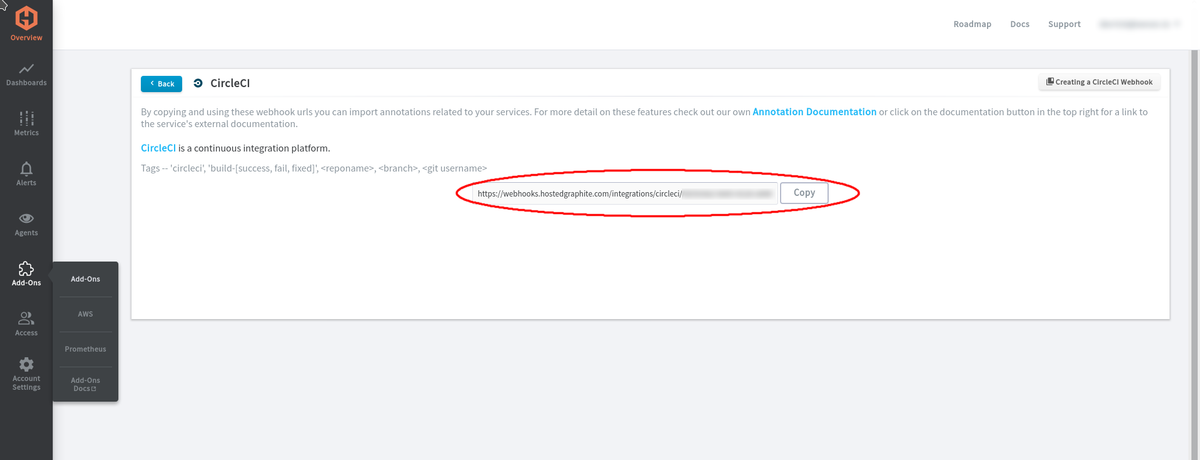
Now we can copy our webhook URL and take it to our CircleCI dashboard. We can also take note of the tags section on the page in the image below, which will be used later on the Hosted Graphite’s side.
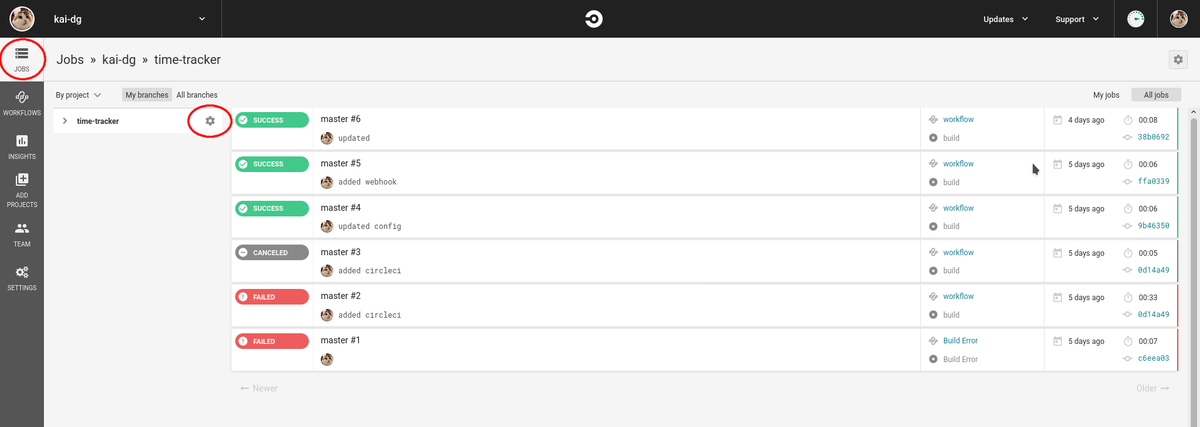
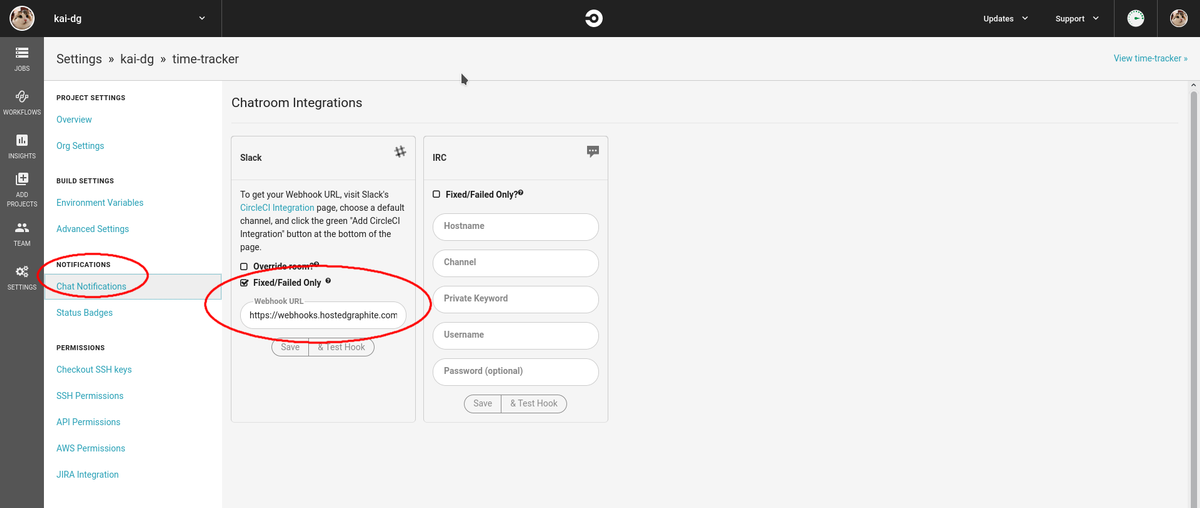
Now on our CircleCI dashboard, we go to the Jobs > Gear icon of the project we want to track.
Now under Notifications, go to Chat Notifications. At the time of writing this article, the only way to add a non-supported service is by adding your webhook URL to the Slack webhook URL. Hit Save, and then you can click Test Hook to see if it works. It will give back some kind of error if it doesn’t, and do nothing if it passes.
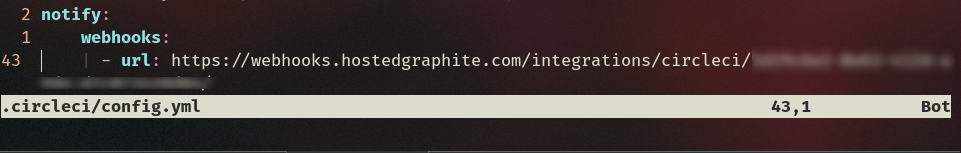
Lastly, we will need to add a small .yml snippet to our config.yml file in our project’s repo:
notify:
webhooks:
- url: YOUR_WEBHOOK_URL
After the CircleCI side is set up, we just need to add the data that is sent from CircleCI to our related graphs.
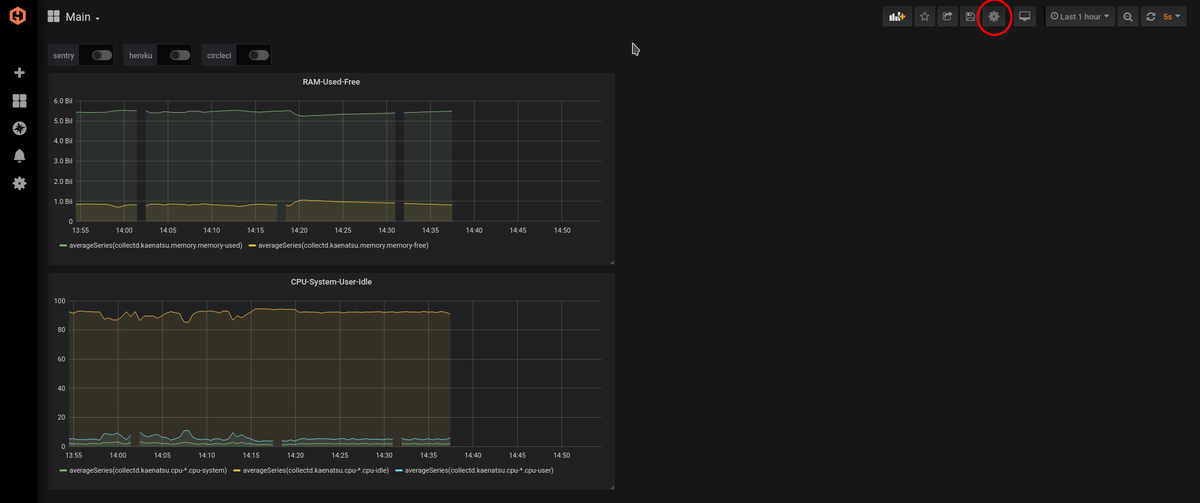
Hosted Graphite side: Let's go to our Hosted Graphite dashboard and then go to our Grafana graphs. Then select the dashboard that you want to have CircleCI annotations on. Then we go to that little gear icon on the top right side, as seen in the image below.
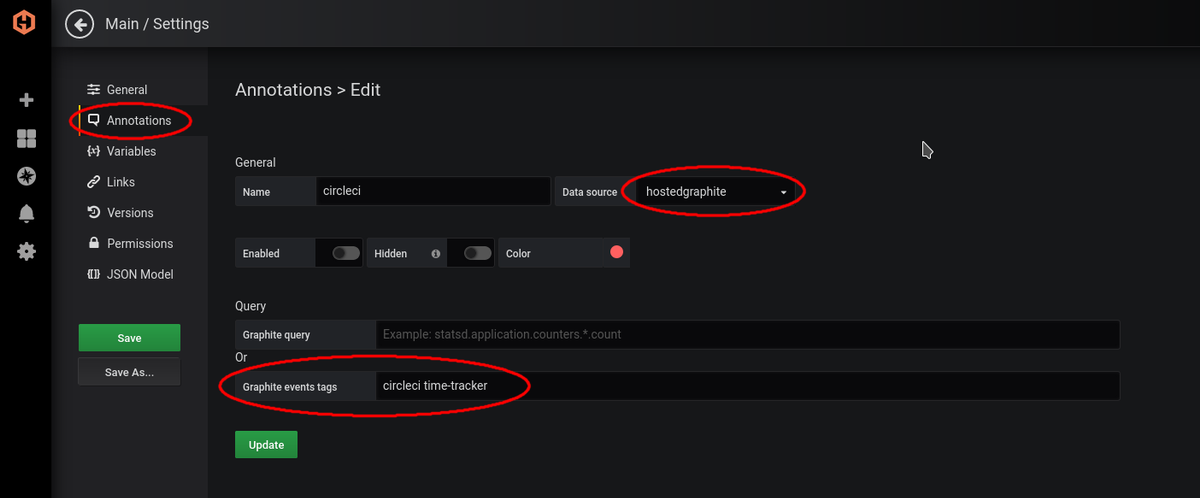
Let’s go to the Annotations tab and create a New annotation.
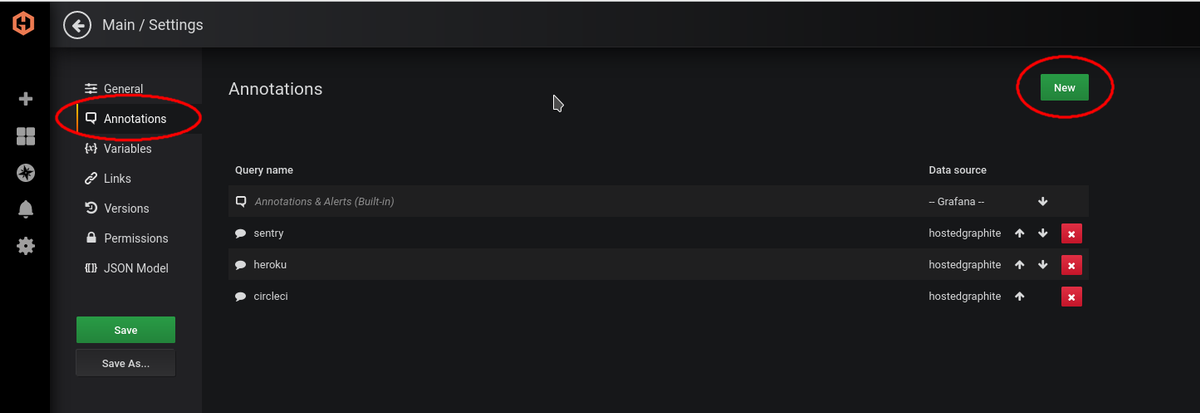
Next, we select the data source as hosted graphite (typically this is the default unless you have manually selected something else for the metric’s data source). Then we add the event tags, you can refer to the image above to see what tags can be used. The tags that you can use with CircleCI are displayed on the CircleCI add-ons page. You can separate the tags by spaces. You can indicate the CircleCI webhook data and your repo’s name in the tags.
Give your repo a git push (or whatever you use to code version control), and you should see an annotation pop-up on your dashboard.
The Result
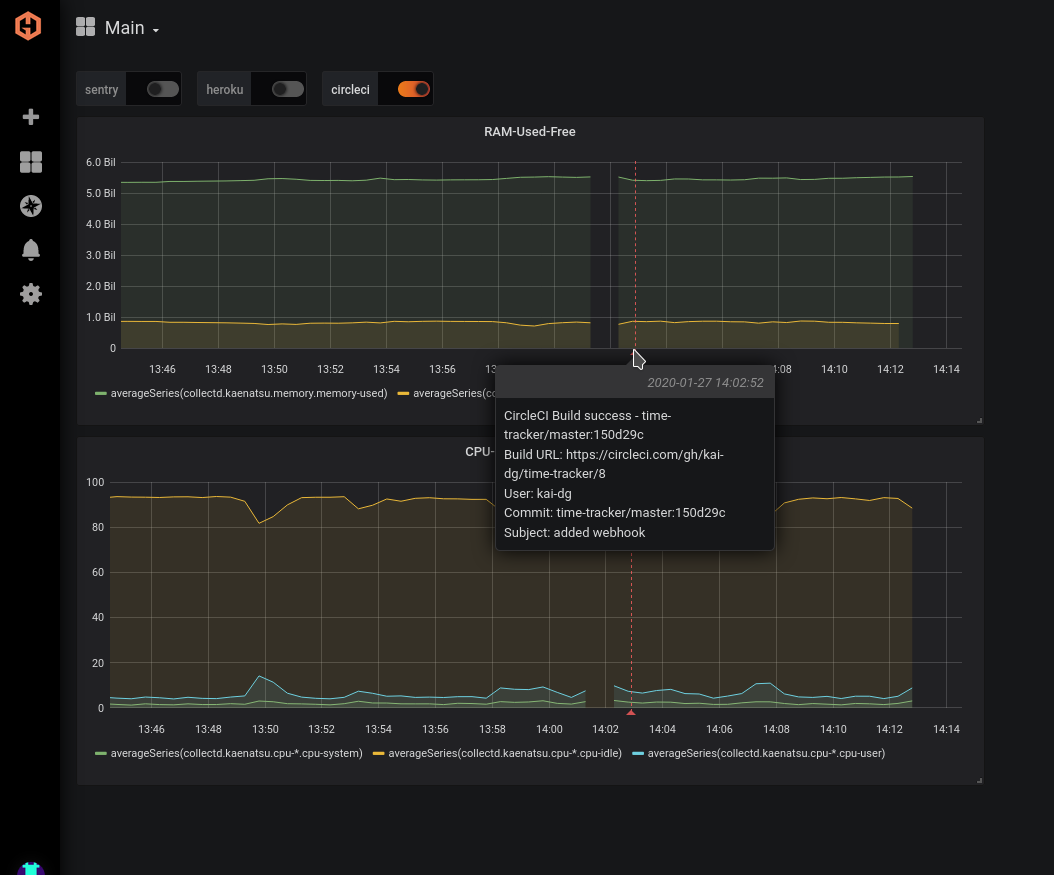
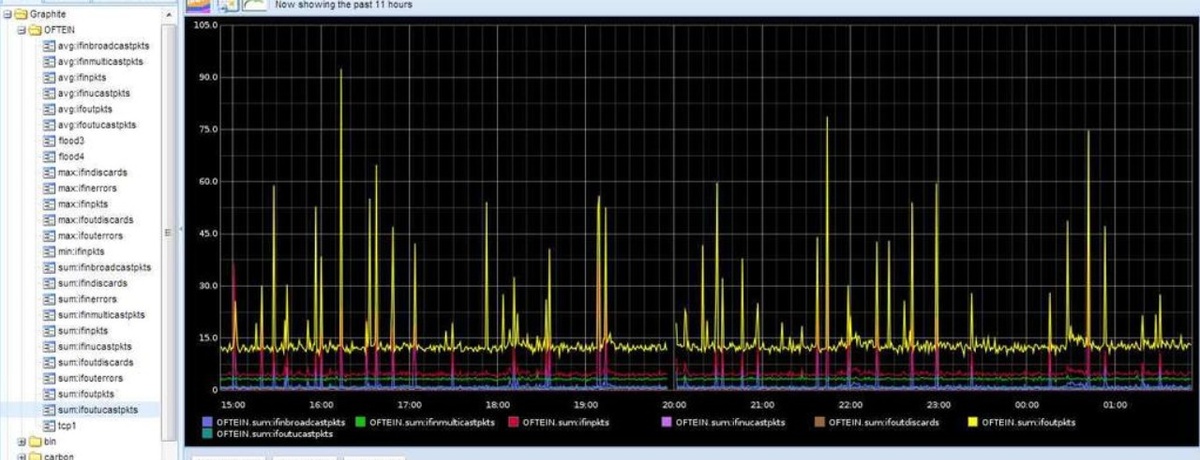
In the above annotation, you can see the data being displayed from CircleCI’s webhook. It shows if the build was a success (you can filter this by success or fail through event tags), the URL, the user, and the commit message. All of this is helpful information to determine at what point in time the graph changed. This graph’s metrics aren’t from a production server, but you can imagine it would be helpful if it was a live deployed server.
Try out making your own CircleCI annotations on MetricFire's free trial, and schedule a demo with us to find out more!