

Table of Contents
Great systems are not just built. They are monitored.
MetricFire runs Graphite and Grafana as a fully managed service for growing engineering teams, taking care of storage, scaling, and version updates so your team doesn't have to. Plans start at $19/month, billed per metric namespace rather than per host, and include engineer-staffed support. Integrations work natively with Heroku, AWS, Azure, and GCP, and data is stored with 3× redundancy in SOC2- and ISO:27001-certified data centres.
Introduction
Monitoring RabbitMQ is essential for maintaining your messaging infrastructure's health, performance, and reliability. It empowers you to take proactive measures, prevent downtime, and deliver a seamless messaging experience for your applications and users. Monitoring helps you monitor RabbitMQ's performance metrics, such as message rates, queue lengths, and resource utilization. Analyzing these metrics lets you identify potential bottlenecks, optimize configurations, and ensure efficient message processing.
In this article, we'll detail how to use the Telegraf agent to collect performance metrics from your RabbitMQ instance and forward them to a datasource.
Getting Started with the Telegraf Agent
Telegraf is a plugin-driven server agent built on InfluxDB and can collect and send metrics/events from databases, systems, devices, and a range of popular technologies. Telegraf is written in Go, compiles into a single binary with no external dependencies, and requires minimal memory footprint. It is compatible with many operating systems and has many helpful output plugins and input plugins for collecting and forwarding a wide variety of performance metrics.
Install Telegraf (Linux/Redhat)
/etc/telegraf/.wget https://dl.influxdata.com/telegraf/releases/telegraf_1.21.2-1_amd64.deb
sudo dpkg -i telegraf_1.21.2-1_amd64.deb
RedHat/CentOS
wget https://dl.influxdata.com/telegraf/releases/telegraf-1.21.4-1.x86_64.rpm
sudo yum localinstall telegraf-1.21.4-1.x86_64.rpm
Configure an Output
You can configure Telegraf to output to various sources, such as Kafka, Graphite, InfluxDB, Prometheus, SQL, NoSQL, and more.
In this example, we will configure Telegraf with a Graphite output. If you're not currently hosting your data source, start a 14-day free trial with Hosted Graphite by MetricFire to follow these next steps.
A Hosted Graphite account will provide the data source, include Hosted Grafana as a visualization tool, and offer an alerting feature.
To configure the Graphite output, locate the downloaded telegraf configuration file at /etc/telegraf/telegraf.conf and open it in your preferred text editor. Then, you will need to make the following changes to the file:
Locate and comment out the line:
# [[outputs.influxdb]]
Then, uncomment the line:
[[outputs.graphite]]
Next, uncomment and edit the server line to:
servers = ["carbon.hostedgraphite.com:2003"]
Finally, uncomment and edit the prefix line to:
prefix = "<YOUR_API_KEY>.telegraf"
Configure the RabbitMQ Input Plugin:
Telegraf has many input plugins that can collect a wide range of data from many popular technologies and 3rd party sources. In this example, we'll demonstrate how to configure the RabbitMQ plugin.
All you need to do is search for the inputs.rabbitmq section in your telegraf.conf file, uncomment the [[inputs.rabbitmq]] line:
[[inputs.rabbitmq]]
Then you can specify the instance URL, or uncomment the default 'URL' line for localhost:
url = "http://localhost:15672"
You may want to enable the federation plugin, to allow messaging between nodes:
rabbitmq-plugins enable rabbitmq_federation
If you do not need the federation plug enabled, you can bypass these metrics by adding the following line to your telegraf.conf file:
metric_exclude = ["federation"]
Save your changes, and then run Telegraf using the following command to see if there are any configuration errors in the output:
telegraf --config telegraf.conf
Telegraf will now be forwarding roughly 100 performance metrics to your data source; this is what some of them will look like in the Graphite format:
telegraf.<host>.false.true.amq_direct.false.direct.http:--localhost:15672.-.rabbitmq_exchange.<messages_publish_metrics>
telegraf.<host>.http:--localhost:15672.rabbitmq_overview.<overview-metrics>
telegraf.<host>.rabbit-localhost.http:--localhost:15672.rabbitmq_node.<disk/mem_metrics>
See the official GitHub repository for a list of metrics collected and configuration options for the RabbitMQ input plugin.
Use Hosted Graphite by MetricFire to Create Custom Dashboards and Alerts
MetricFire is a monitoring platform that enables you to gather, visualize, analyze, and alert on metrics from sources such as servers, databases, networks, devices, and applications. Using MetricFire, you can effortlessly identify problems and optimize resources within your infrastructure. Hosted Graphite by MetricFire removes the burden of self-hosting your monitoring solution, allowing you more time and freedom to work on your most important tasks.
- Once you have signed up for a Hosted Graphite account and used the above steps to configure your server with the Telegraf Agent, metrics will be forwarded, timestamped, ingested, and aggregated into the Hosted Graphite backend.
- They will be sent and stored in the Graphite format of: metric.name.path <numeric-value> <unix-timestamp> provides a tree-like data structure and makes them easy to query.
- You can locate these metrics in your Hosted Graphite account and use them to build custom Alerts and Grafana dashboards.
Create Dashboards in Hosted Graphite's Hosted Grafana
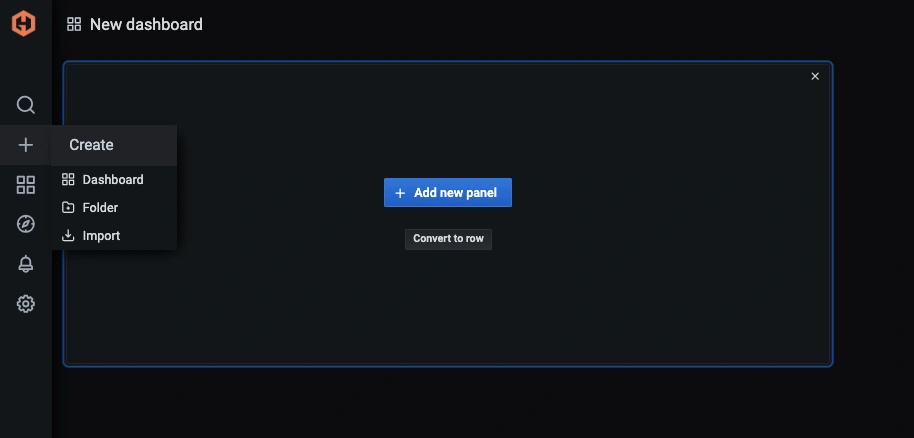
In the Hosted Graphite UI, navigate to Dashboards => Primary Dashboards and select the + button to build a new panel:
Then you can use the query UI to select a graphite metric path (the default data source will be the hosted graphite backend if you are accessing Grafana through your Hosted Graphite account):
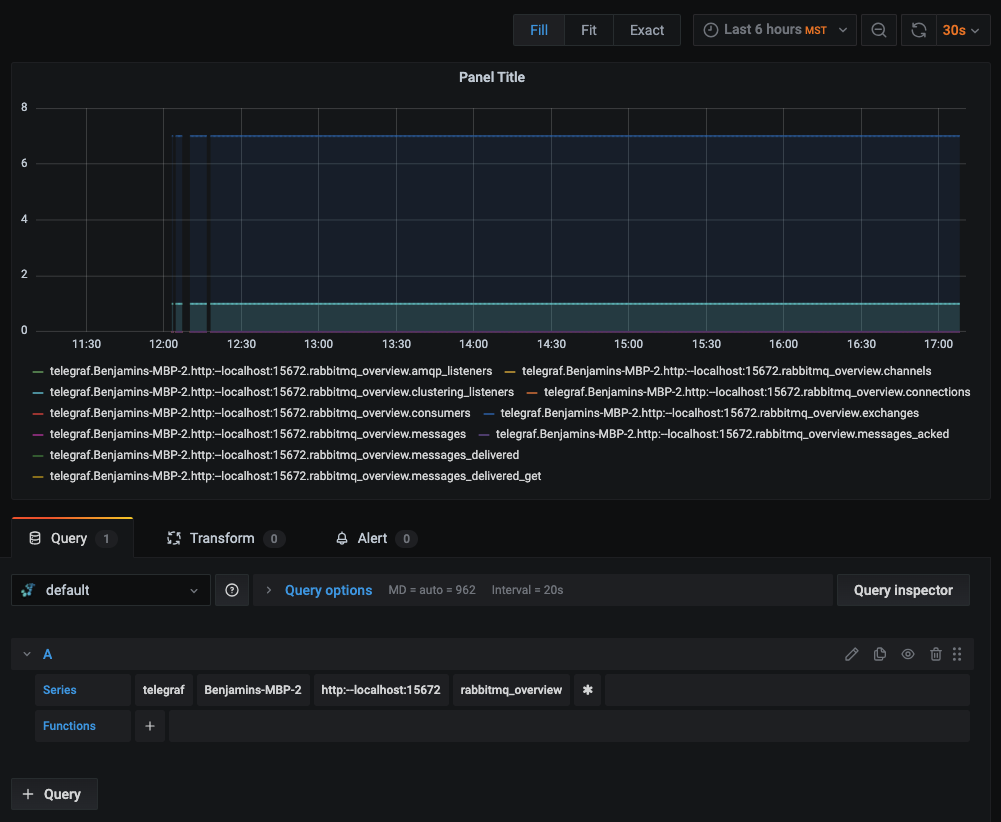
The Hosted Graphite datasource also supports wildcard (*) searches to grab all metrics that match a specified path.
Now you can apply Graphite functions to these metrics, like aliasByNode(), to reformat the metric names on the graph:
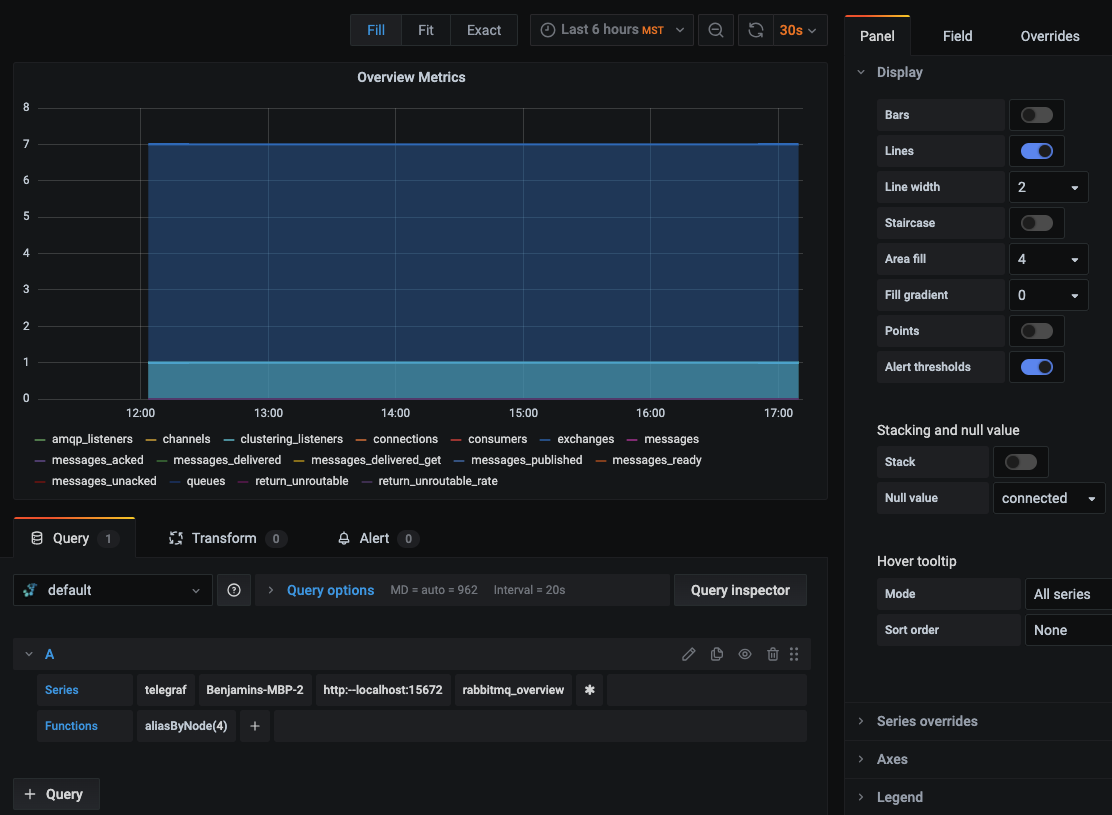
Grafana has many additional options, like configuring dashboard variables and annotations. You can also use different visualizations, modify the display, set the units of measurement, and much more.
Hosted Graphite also has a pre-configured dashboard for Telegraf metrics located in their Dashboard Library:
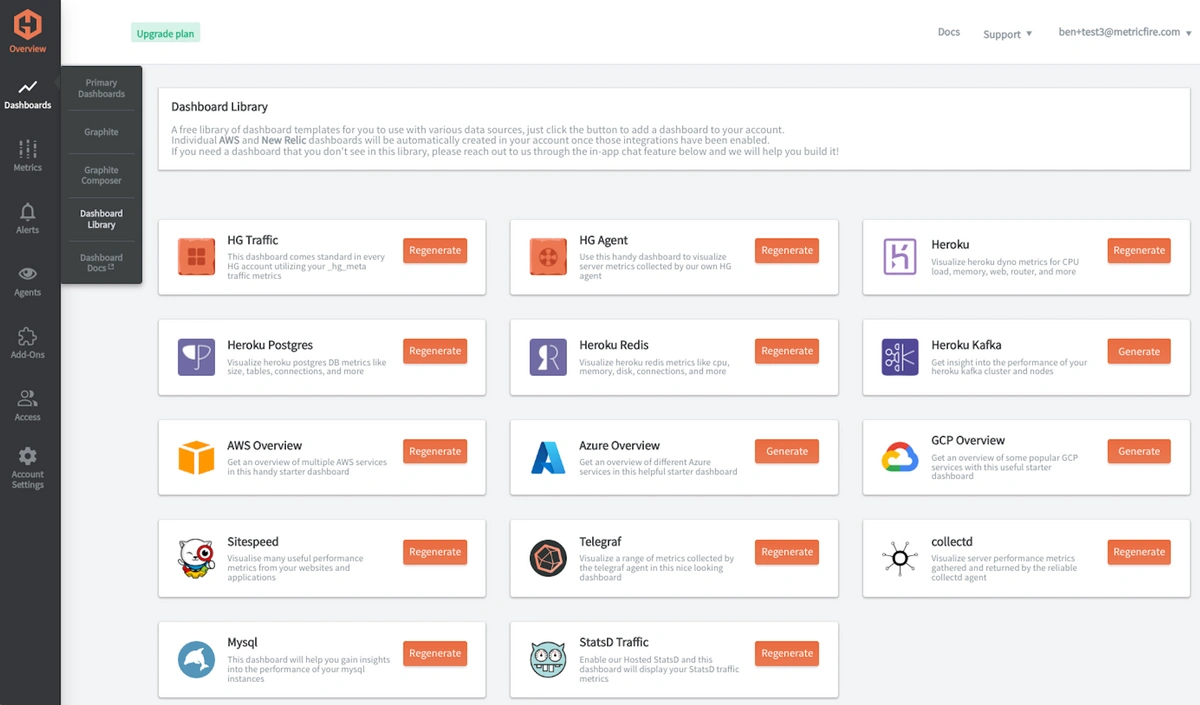
Once this dashboard is generated in your account, you can locate it in your Primary Dashboards to see system metrics (CPU, mem, disk) displayed.
These system performance metrics come standard with a Telegraf => Graphite configuration:
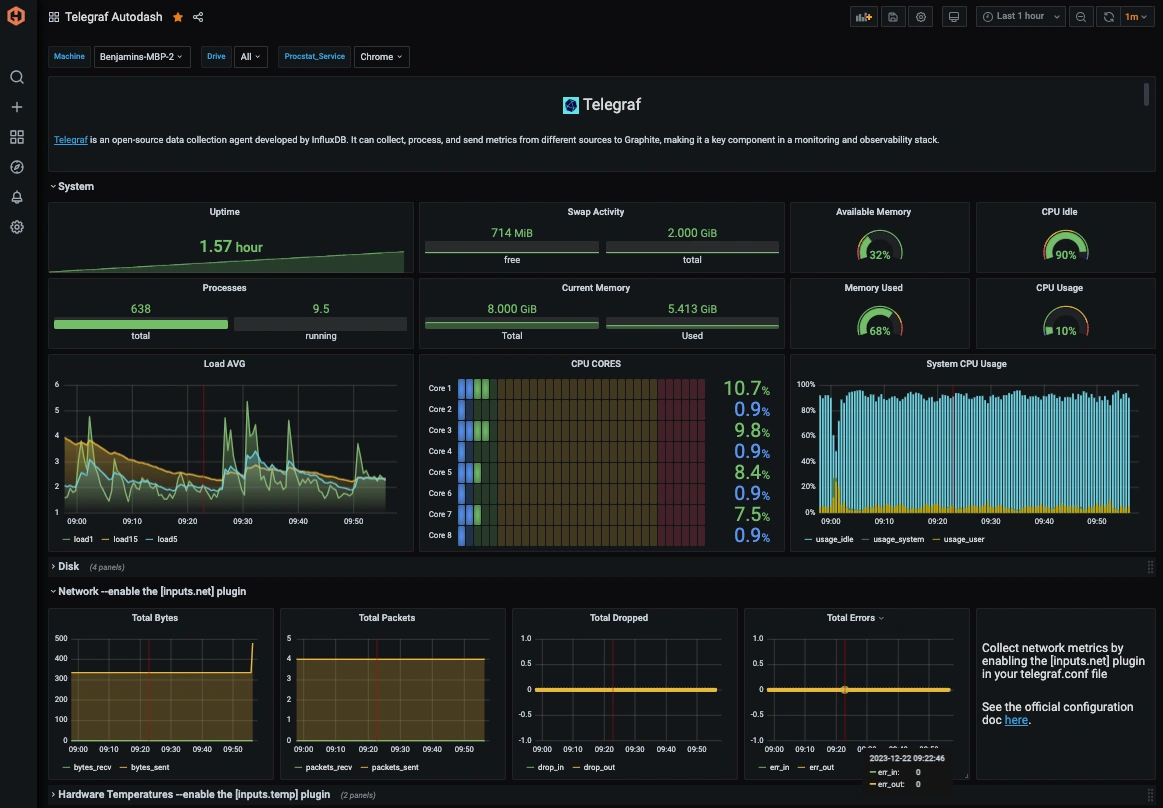
See the Hosted Graphite dashboard docs for more details.
Creating Graphite Alerts
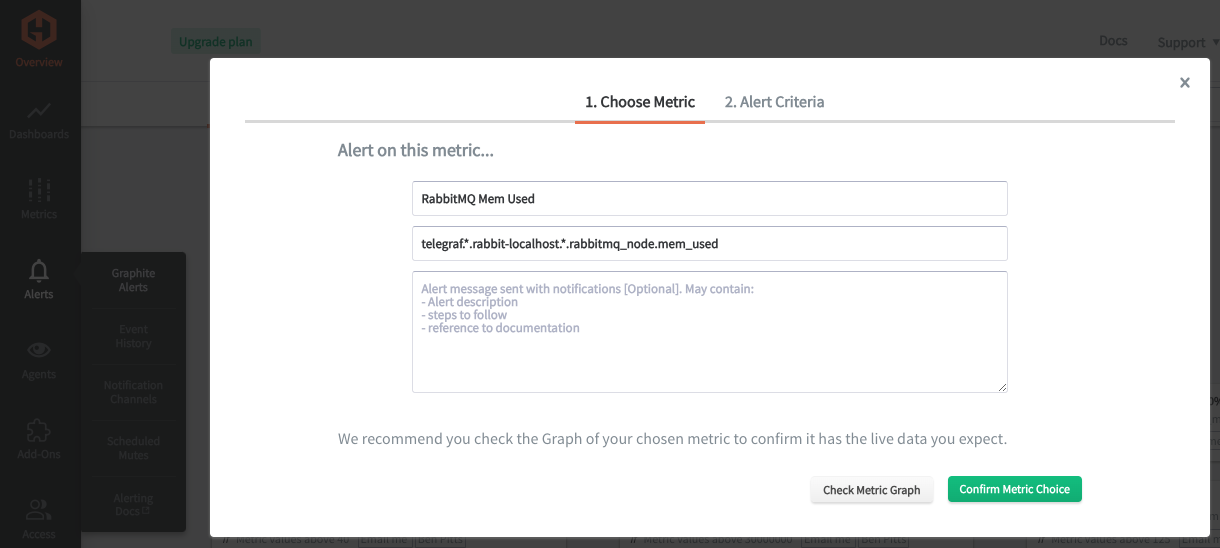
In the Hosted Graphite UI, navigate to Alerts => Graphite Alerts to create a new alert. Name the alert, add one of your graphite metrics to the alerting metric field, and add a description of what this alert is:
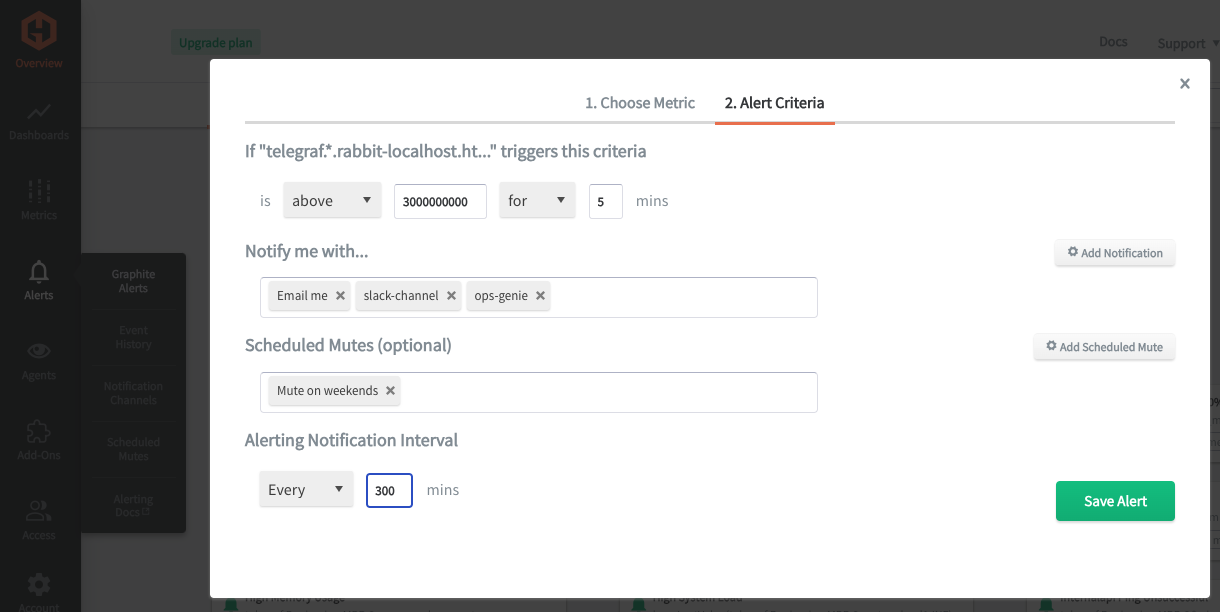
Then, select the Criteria tab, which will set the threshold, and select a notification channel. The default notification channel is the email you used to sign up for the Hosted Graphite account. Still, you can easily configure a channel for Slack, PagerDuty, Microsoft Teams, and more. See the Hosted Graphite docs for more details on notification channels:
Conclusion
Monitoring RabbitMQ is integral to maintaining a robust and dependable messaging infrastructure, ultimately supporting your business applications' overall efficiency, reliability, and user satisfaction. Monitoring helps identify and address performance bottlenecks, ensuring that RabbitMQ operates efficiently and processes messages at optimal rates. Monitoring also ensures the health of RabbitMQ clusters, helping to maintain fault tolerance and high availability, which is critical for uninterrupted message processing.
Message queue performance monitoring provides valuable data, and tools like dashboards and alerts complement this monitoring by providing real-time visualization, proactive identification of issues, historical trend analysis, and facilitating informed decision-making. These are all essential for maintaining a robust and efficient network infrastructure.
Sign up for a free trial, and experiment with monitoring your RabbitMQ messaging infrastructure today! You can also book a demo and talk to the MetricFire team directly about your monitoring needs.


