

Table of Contents
Great systems are not just built. They are monitored.
MetricFire runs Graphite and Grafana as a fully managed service for growing engineering teams, taking care of storage, scaling, and version updates so your team doesn't have to. Plans start at $19/month, billed per metric namespace rather than per host, and include engineer-staffed support. Integrations work natively with Heroku, AWS, Azure, and GCP, and data is stored with 3× redundancy in SOC2- and ISO:27001-certified data centres.
Introduction
Grafana is probably the most popular visualization software and Hosted GrFire'safana is provided by MetricFire. Every day, our users have to perform certain actions and most of them are repetitive. For example, you might want to automatically create a bunch of different folders with dashboards in them. This tutorial will show you how to do that with Terraform, which is very popular in the DevOps circles, and how to go even further by using the client library yourself to automate more.
You can start using Grafana within minutes through MetricFire's Hosted Grafana. Check out the free trial here, or talk to the team directly by booking a demo. Now let's dive into our automations!
Key Takeaways
- Terraform is introduced as a popular tool in DevOps for managing resources idempotently. It uses resource declarations to specify what to create and manage. Providers, like the Grafana provider, allow interactions with different software products.
- To use the Grafana provider in Terraform, you need to specify the provider block in a .tf file with the Grafana instance's URL and authentication token or credentials.
- The article provides examples of using Terraform to create Grafana folders, data sources (e.g., Prometheus), dashboards, alert notification channels, and organizations.
- The article emphasizes the importance of testing automation code, showing an example of testing the organization creation function in Go.
- Readers are encouraged to refer to the SDK documentation for further automation possibilities.
Intro to Terraform
It would be hard to top the documentation that Terraform already has so we will only present the most basic information in a simple way with links where you can find more help.
The fundamental block in Terraform is a resource. A resource’s declaration says what should be created with what configuration. One of the main ideas behind Terraform is that the creation of resources is idempotent or, in other words, no matter how many times you apply the same configuration, the end result will be the same.
Different software products have different objects that you can create and manage. You can imagine those software products as namespaces of resources. They are called providers in Terraform’s parlance. The Grafana provider is one of them and the one that we will use in this tutorial.
All of Terraform’s code is written in files that end with .tf. Of course, there are a bunch of different guidelines on how to organize all of your code. You can group your code into separate units which are called modules. You can find some public modules in the Terraform registry. You can find all of the glossaries of different terms here.
There are even automation products such as Terragrunt or Atlantis which help you achieve even more with Terraform. Because it would be too much to cover we will assume that from this point on you are familiar with Terraform’s syntax and how to apply simple configurations.
Grafana provider
The Grafana provider permits managing resources such as dashboards, data sources, folders, organizations, and alert notification channels. To use it, you will have to supply the provider with administrative access to your Grafana. To do that, add the following provider block to your .tf file:
provider "grafana" {
  url  = "http://grafana.example.com/"
  auth = "eyJrIjoicEXAMPLEEXAMPLEEXAMPLEEXAMPLEk15T2VBbkFCdTYiLCJuIjoidGVycmFmb3JtX3R1dG9yaWFsIiwiaWQiOjF9"
}
Auth can either be a token that you can retrieve from Grafana or a combination of username and password that is separated by the colon character, “:”.
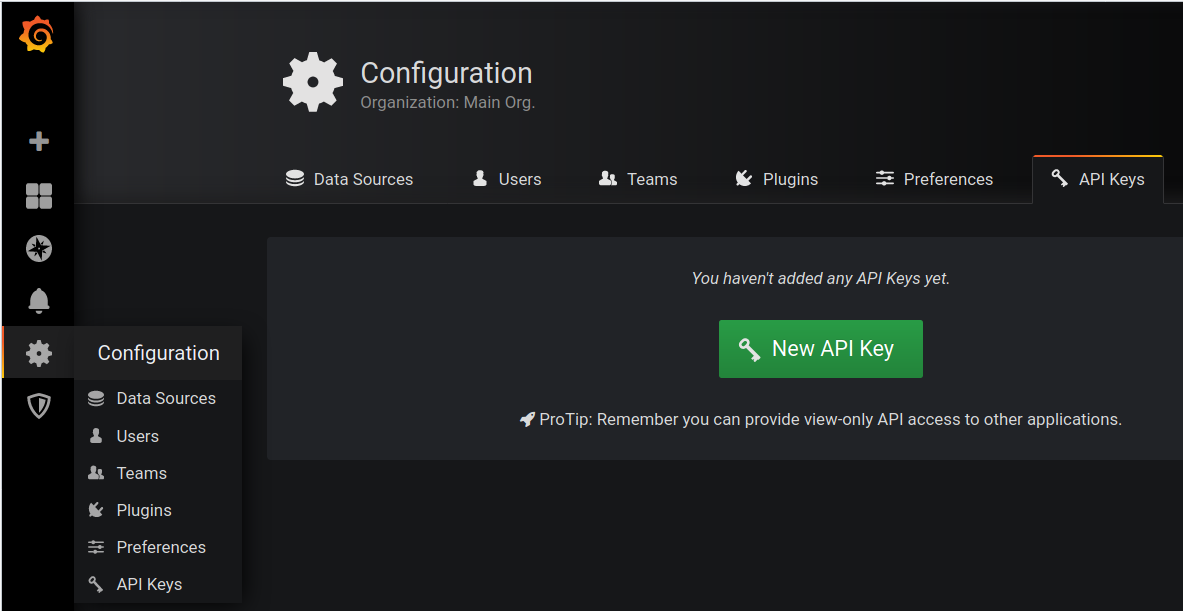
You can retrieve the token by going to the API Keys section under the personal settings menu:
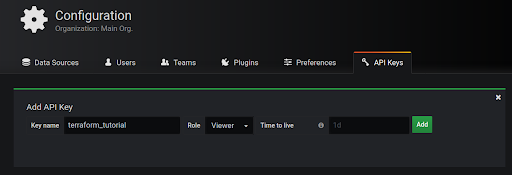
Click New API Key and then create a new key with the Admin role:
Then you will get a key that you should save somewhere safe because it will be shown only once:
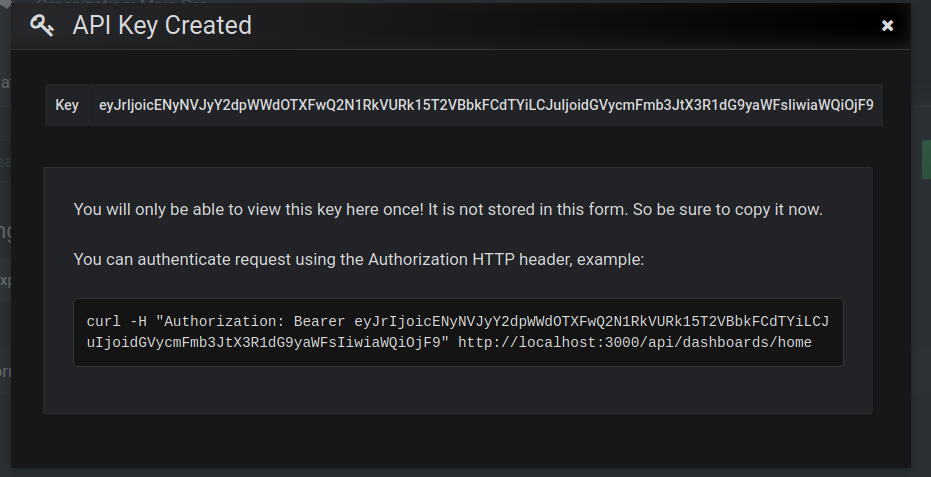
This is the key that you should paste into the auth parameter as in the snippet above. Also, don’t worry, this is just an example key that was generated on a local Grafana. After changing the URL to point to your Grafana instance you are free to continue on exploring the different resources of the Grafana provider. This article will give you an overview of all resources.
Examples
These examples have been tested on Terraform 0.12 and Grafana 6.7.2.
Folders
Creating one folder is as easy as:
resource "grafana_folder" "collection" {
  title = "Monitoring Systems"
}
After applying this with terraform apply, you will get this output:
$ terraform apply

An execution plan has been generated and is shown below.
Resource actions are indicated with the following symbols:
  + create

Terraform will perform the following actions:

  # grafana_folder.collection will be created
  + resource "grafana_folder" "collection" {
  	+ id	= (known after apply)
  	+ title = "Monitoring Systems"
  	+ uid   = (known after apply)
	}

Plan: 1 to add, 0 to change, 0 to destroy.

Do you want to perform these actions?
  Terraform will perform the actions described above.
  Only 'yes' will be accepted to approve.

  Enter a value: yes

grafana_folder.collection: Creating...
grafana_folder.collection: Creation complete after 0s [id=1]

Apply complete! Resources: 1 added, 0 changed, 0 destroyed.
And the following result on Grafana:

Data sources
Before we jump into importing dashboards into that folder, we ought to create some data sources that will be used by those dashboards. With the Grafana provider that is easy.
The exact arguments that you will need to pass to it will differ according to the type of data source that you are going to create. Explore all of the options here. In this tutorial we will show you how to create a Prometheus data source, which you might also want to connect to other systems through a data integration platform like Integrate.io for advanced ETL and data pipeline capabilities:
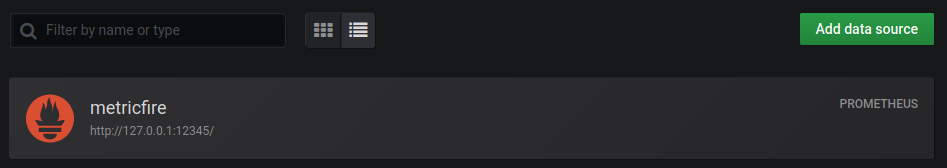
resource "grafana_data_source" "metrics" {
  type      	= "prometheus"
  name      	= "metricfire"
  url       	= "http://127.0.0.1:12345/"
}
The result:
Dashboards
Now that we have a folder and a data source, we can import some dashboards that will visualize data that comes from that data source. You can specify the dashboard’s JSON object in-line or use the file function as per this example:
resource "grafana_dashboard" "metrics" {
  config_json = file("metricfire-dashboard.json")
}
Unfortunately, the grafana_dashboard resource does not support importing dashboards into folders so we cannot import it into the folder that we have created previously. After executing the previous snippet, you will get:
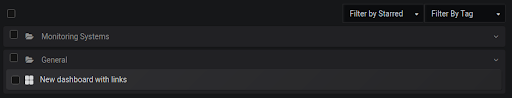
In that file there is a simple dashboard that only contains some links:

Alert notification channels
This resource refers to the channels that Grafana’s native alerting mechanism uses. The required parameters are only name and type. All of the other settings go under the settings key.
Thus, to create an alert notification channel that will make your Grafana send alerts back to your Alertmanager, this snippet could be used:
resource "grafana_alert_notification" "am_integration" {
name = "Alertmanager"
type = "prometheus-alertmanager"
is_default = true
settings = {
url = "http://myalertmanager.com:1234"
basicAuthUser = "mybasicuser"
basicAuthPassword = "supersecret"
}
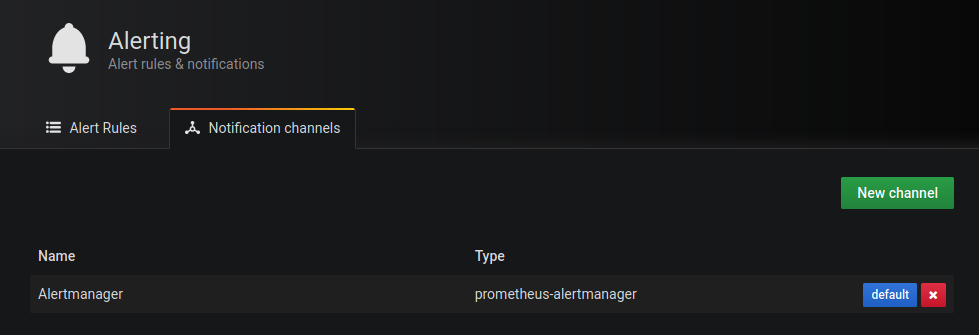
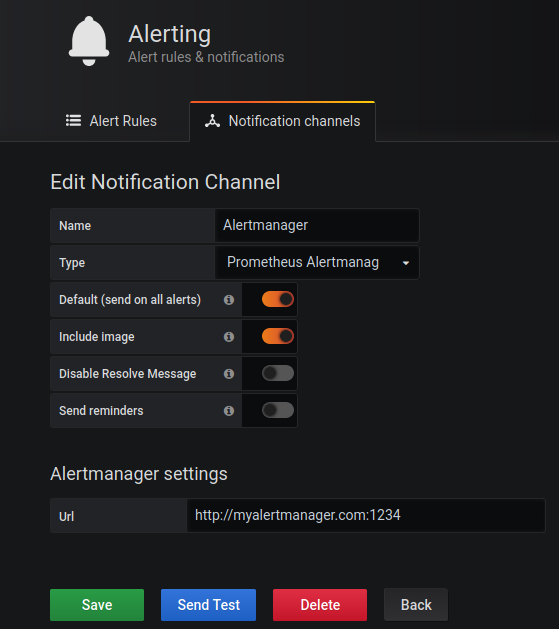
}
This will give you:
Organizations
Finally, let’s look at the last resource that the Grafana provider currently supports. Organizations are a way of separating dashboards and everything else into separate units. They may be created per-team, per-service, or per whatever level of abstraction that makes sense in your company.
It is easy to create new organizations and add users to them. You can use a snippet such as this:
resource "grafana_organization" "CoolProduct" {
	name     	= "My Cool Product"
	admin_user   = "admin"
	create_users = false
	admins   	= [
    	    "admin@localhost"
	]
	editors  	= [
    	    "foobar@foobar.com"
	]
	viewers  	= [
    	    "bazbaz@bazbaz.com"
	]
}
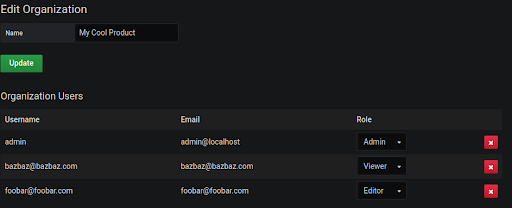
If create_users had been true then place-holder users would have been created but because we only want to add users which already exist according to the specified roles it is false.
Applying the above piece of code gives us:
Notes
Even though you can do all of these things with Terraform and its Grafana provider, it comes with some serious caveats. For example, you cannot create folders, data sources, or any other resource for that matter, in different organizations. You can only do that in the main organization. This is because Grafana does not expose a very nice RESTful API for navigating between them i.e. Grafana stores some server-side state such as what organization is currently selected for an user. This means that there is no nice way of integrating that into Terraform’s philosophy. There have been some attempts to do that but nothing official is available yet.
So, to fully automate all of the actions with Grafana, you’ll have to switch to a general-purpose programming language such as Go.
Automating Actions With Go
There is a pretty popular SDK for automating Grafana actions in Go called grafana-tools/sdk. In this article, we will present you with a bare-bones program that you can take and use as a baseline. Also, some simple tests will be shown that are going to increase your confidence that the automation really works.
In the author's opinion, Go is relatively straightforward to read and it is easy to make web applications with it so that language will be used here. Also, this will not be a tutorial on the language so some experience will be assumed. There are plenty of learning resources online but you can start with the “The Go Programming Language” book.
Barebones Program
A primitive program only has some code that will allow it to connect to a Grafana instance and perform various actions on it, just as we have begun with the Grafana provider block in Terraform’s code.
To do that with the SDK, you need to call the sdk.NewClient method that creates a new client for use. Again, you can use either basic authentication or an API key. In this case, we will use basic authentication:
package main

import (
   "github.com/grafana-tools/sdk"
)

func main() {
   client := sdk.NewClient("http://localhost:3000", "admin:admin", sdk.DefaultHTTPClient)
   var _ = client
}
The var _ = client part has been added because unused variables in Go raise compilation errors. Now we can use clients to do whatever we want to with our Grafana. For example, let’s create three organizations:
- Metric
- Fire
- IsAwesome
With the following code:
package main

import (
   "context"
   "fmt"

   "github.com/grafana-tools/sdk"
)

func main() {
   client := sdk.NewClient("http://localhost:3000", "admin:admin", sdk.DefaultHTTPClient)
   for _, org := range []string{"Metric", "Fire", "IsAwesome"} {
       sm, err := client.CreateOrg(context.Background(), sdk.Org{Name: org})
       // TODO: add proper error handling.
       fmt.Println(sm, err)
   }
}
You will get:
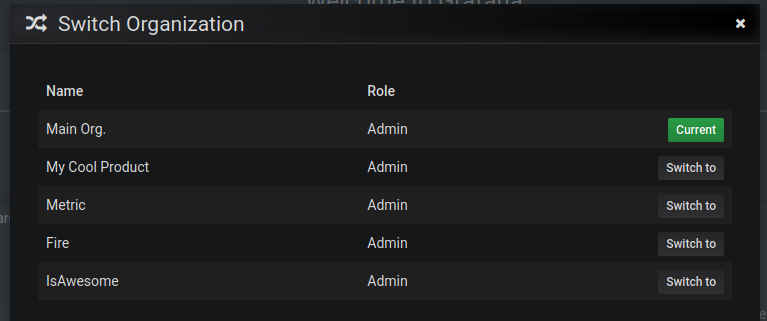
Also, notice that Grafana’s API is idempotent. What it means is that running it twice or more times will not give you an error - instead it returns success because they already exist and the end result is the same:
$ ./sdk_test
{<nil> <nil> 0xc000184110 <nil> <nil> <nil> <nil> <nil>} <nil>
{<nil> <nil> 0xc0001841f0 <nil> <nil> <nil> <nil> <nil>} <nil>
{<nil> <nil> 0xc000012ee0 <nil> <nil> <nil> <nil> <nil>} <nil>
The program prints some diagnostic information via fmt.Println and, as you can see, the second column is always <nil> which means that no error has occurred.
Testing Your Automation
With the great power of general-purpose programming languages, comes a great responsibility. We should always test our code. Let’s write some unit tests for our automation program.
Separating our code into different functions and modules permits testing them independently. Let’s perform that for our program - let’s move the creation of an organization into a separate function. Of course, your own program will be much more complex - this is just an example. Here is what the code looks like:
package main

import (
   "context"
   "fmt"

   "github.com/grafana-tools/sdk"
)

// Preparator is a struct for holding state related to our Grafana
// automation.
type Preparator struct {
   c *sdk.Client
}

// PrepareOrg prepares an organization for our use with the given name.
func (p *Preparator) PrepareOrg(ctx context.Context, orgName string) error {
   _, err := p.c.CreateOrg(ctx, sdk.Org{Name: orgName})
   return err
}

func main() {
   client := sdk.NewClient("http://localhost:3000", "admin:admin", sdk.DefaultHTTPClient)
   prep := &Preparator{c: client}
   for _, org := range []string{"Metric", "Fire", "IsAwesome"} {
       // TODO: add proper error handling.
       fmt.Printf("creating org %s: %v\n", org, prep.PrepareOrg(context.TODO(), org))
   }
}
Now this enables us to write a simple test case on whether the function PrepareOrg works. At the moment, it only ensures that the organization exists without doing any extra work. That is what we will check.
Here is our simple testing code:
package main

import (
   "context"
   "testing"

   "github.com/grafana-tools/sdk"
)

// Tests whether preparator prepares a given organization properly.
func TestPreparatorPrepareOrg(t *testing.T) {
   testcases := []string{"a", "b", "c", "d", "e", "f"}

   // TODO: refactor this into a separate place.
   client := sdk.NewClient("http://localhost:3000", "admin:admin", sdk.DefaultHTTPClient)
   prep := &Preparator{c: client}
   for _, org := range testcases {
       if err := prep.PrepareOrg(context.TODO(), org); err != nil {
           t.Fatalf("preparing org %v: %v", org, err)
       }

       // Now let's check if it has been created successfully.
       if _, err := client.GetOrgByOrgName(context.TODO(), org); err != nil {
           t.Fatalf("getting org %v: %v", org, err)
       }
   }
}
Running it gives us:
go test -v ./...
=== RUN   TestPreparatorPrepareOrg
--- PASS: TestPreparatorPrepareOrg (0.28s)
PASS
ok  	sdk_test    	0.286s
After all of this, feel free to read the documentation of the SDK here and automate whatever actions you want.