
Table of Contents
Great systems are not just built. They are monitored.
MetricFire runs Graphite and Grafana as a fully managed service for growing engineering teams, taking care of storage, scaling, and version updates so your team doesn't have to. Plans start at $19/month, billed per metric namespace rather than per host, and include engineer-staffed support. Integrations work natively with Heroku, AWS, Azure, and GCP, and data is stored with 3× redundancy in SOC2- and ISO:27001-certified data centres.
There are many tools for visualizing data, but Grafana has become one of the best ways for organizations to visualize information and receive notifications about events happening within their infrastructure or data.
According to Kubernetes:
Kubernetes is a portable, extensible, open-source platform for managing containerized workloads and services, that facilitates both declarative configuration and automation. It has a large, rapidly growing ecosystem. Kubernetes services, support, and tools are widely available.
This article will look at the best practices for monitoring Kubernetes using Grafana.
To get started, sign up for a MetricFire free trial. Then, to quickly get started with monitoring Kubernetes clusters, check out our tutorial on using the Telegraf agent as a Daemonset to forward node/pod metrics to a data source and use that data to create custom dashboards and alerts.
Key Takeaways
- Grafana is vital for Kubernetes monitoring: Grafana is a top tool for visualizing data and tracking events in Kubernetes infrastructure.
- Key Kubernetes metrics to monitor: Monitor pod/container, node, and cluster metrics for better performance management.
- Grafana excels at troubleshooting. Using RED metrics helps identify cluster issues, bottlenecks, application problems, and I/O waits.
- Accessible data sources and dashboard creation: Grafana supports various sources, enabling simple dashboard building with compelling visualizations.
- Hosted Graphite and Grafana for scalability: MetricFire's hosted services simplify scaling and monitoring large Kubernetes setups.
Why Choose Grafana?
The issue is that monitoring strategies for regular containerized applications don't work when applied to Kubernetes. Specifically, containers are hard to monitor in today's environments because they are constantly dying and being rebuilt. When combined with container orchestration, managing the application's fundamental infrastructure and the typical operational areas at scale is challenging. This is why it is imperative to have a strategy incorporating monitoring dashboards and centralized metrics for Kubernetes applications.
For real-time metrics in a centralized place, Grafana is the answer. It monitors your infrastructure and applications, which is critical for concise insight into your metrics. Kubernetes leverages these crucial metrics in Grafana so that you get total transparency into the condition of your Kubernetes cluster. This allows you to ensure that everything is running and working exactly how it is supposed to be.
Here are just a few of the metrics you can monitor with Grafana dashboards:
- The availability and health of your pod
- Kubernetes cluster resource utilization (CPU/memory on a cluster, node, pod, and container level)
- Usage of resources, including actual and requested usage, so you have a clear picture of both.
- The Kubernetes cluster node's actual CPU and memory usage
- Kubernetes nodes' available resources
- Individual Kubernetes node available resources
Which Kubernetes Metrics Should Your Organization Monitor?
Kubernetes has two kinds of metrics you can use: application-level metrics and system-level metrics. Application-level metrics are gathered from third-party monitoring integrations or solutions such as Prometheus. Check out our information about Kubernetes monitoring with Prometheus to learn more. System-level metrics are the core Kubernetes sources that come right from the start. These are things like Kubernetes API, Metrics Server, and cAdvisor.
Here are three lists that showcase the Kubernetes metrics that are important to monitor.
Pod/Container Metrics
- Pods resource allocation
- Under-provisioned or over-provisioned pods
- Amount of running pods in the cluster
- Healthy vs. unhealthy pods in the cluster
- Throttled containers percentages
- Occurrences of container restarts
- Number of persistent volumes in a failed or pending state
- Container CPU and memory utilization (you can configure this in the memory-defaults-pod.yaml file for each pod or container)
Node Metrics
- Health check for master nodes—API server, scheduler, controller, etc.
- Degradation of master nodes
- Number of nodes available for serving pods
- Node CPU utilization
- Node memory usage
- Node disk space available for placing pods
- Node disk I/O usage
- Node network traffic (in and out)—receive and transmit
- Node network traffic errors
- Node network traffic drop
Cluster Metrics
- Cluster-level overview of workloads deployed
- Cluster CPU usage: used vs. total
- Cluster memory usage: used vs total (you can configure this in the memory-defaults.yaml file under the default-mem-example namespace)
- Cluster file system usage: used vs. total
- Cluster network I/O pressure
- Cluster health (pod status, pod restarts, pod throttling)
- Overview of nodes, pods, and containers
Kubernetes and Grafana Troubleshooting Guide
When gaining insight into your data visualization, Grafana is an ideal tool. These insights help you pinpoint metrics collected from a variety of source materials. Many troubleshooting scenarios may occur, and here are a few where Grafana shines:
- Cluster Performance Issues and Instability. Here, you can compare requests and limits and find the performance above issues and instability in resource planning.
- Identify and Monitor. Identifying Kubernetes nodes and monitoring bottleneck issues.
- Application Issues. This is where you can locate issues with the application by visualizing container restarts.
- Determining a Source of I/O Waits. This is done by correlating I/O wait for spikes with network spikes or disk using network stats and I/O wait.
- Correlating unhealthy pod states and throttled pods. This is done by memory spikes on nodes or I/O wait times. You can also do this using CPU usage.
RED metrics consist of request rate, error rate, and duration. These are used to instrument the services running in Kubernetes, and from an application perspective, they are crucial for pinpointing performance issues. This makes it easy to alert your team when business portals show breach events, and Kubernetes allows leverage with its built-in alerting capabilities.
Adding Data Sources in Grafana
Grafana fetches data from its sources and then displays it in graphs on the dashboard. These are your time-series data from storage backends. It has support for a plethora of data sources built-in and straight out of the box, including:
- Azure Monitor
- Prometheus Alert Monitoring
- CloudWatch
- InfluxDB
- AWS
- Elasticsearch
- MySQL
- Graphite
- Microsoft SQL Server
- OpenTSDB
- PostgreSQL
- Proxy
- StackDriver
- TestData DB
Multiple data sources can be combined into one dashboard as you create your dashboard. Keep in mind that each of the panels is tethered to a specific data source. With the query editor, you can write queries against your data stores to provide visualizations of the metrics. For teams managing complex Kubernetes environments, DreamFactory can streamline backend integration and provide governed API access to any data source, enabling you to consolidate metrics from multiple systems into Grafana. Many visualization options can be applied to each of your panels to create what is easier for you to utilize.
Building Your Grafana Dashboard
Building your dashboard in Grafana isn't tricky. The Grafana dashboard has panels; the default ones include Table, Heatmap, Graph, and Singlestat. Of course, you can add panel plugins as well. These allow new data visualization for non-time series data and time-series data.
Once the panels are added, they can be placed into rows, and this is done by simply dragging and dropping them to organize them. Along with that, customization is available in a wide range of options. You can do whatever works best for you to have your visualizations in an ideal format.
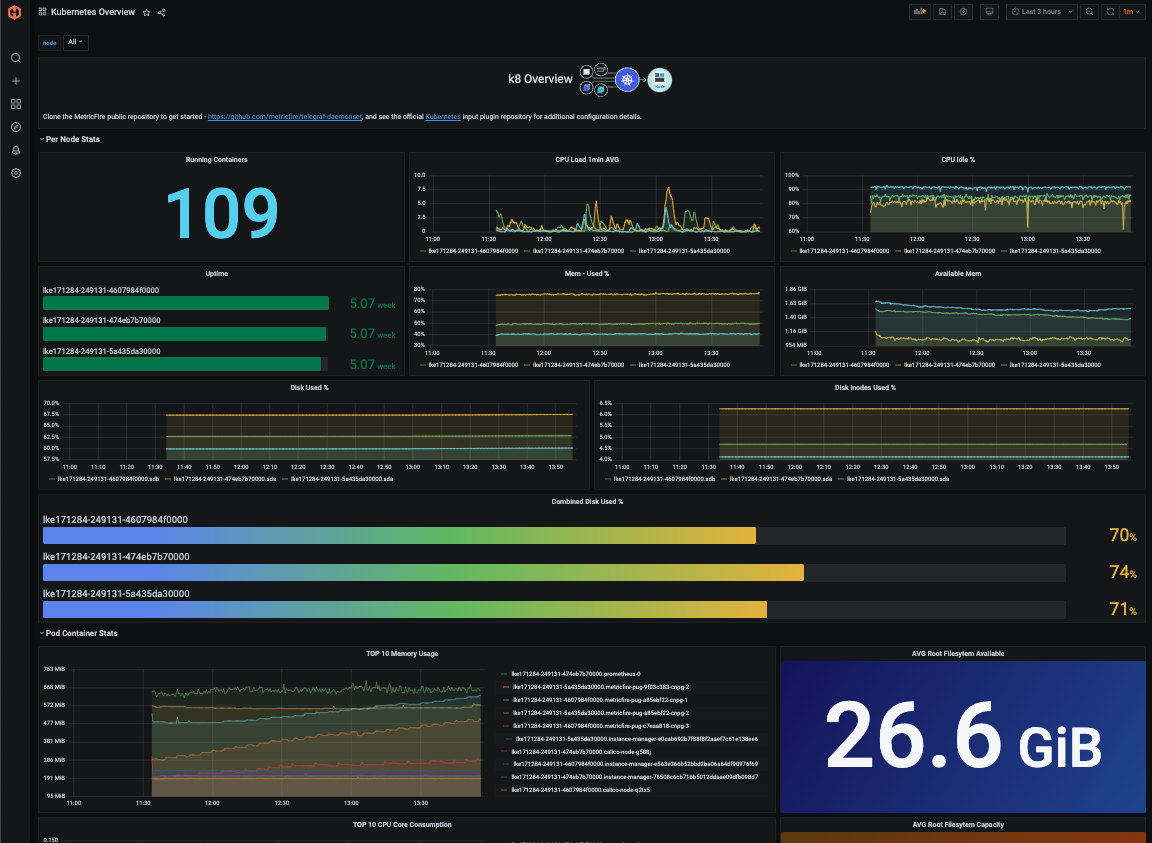
MetricFire also provides a pre-made Kubernetes Overview dashboard that will be compatible with your telegraph-k8 metrics as part of our Hosted Graphite Dashboard Library.
A Few Tips To Keep in Mind
KISS: Seriously, keep it simple! Adding too much information to your dashboard will make it harder to visualize and read. Keep your panels limited. Perhaps a single metric is sufficient to display disk space or CPU memory. You want to understand what you are looking at easily.
Keep It Consistent: Keep all your dashboards the same design to ensure that your metrics are simple to read and that you don't have to learn the layout just because you're on a different dashboard. This can be confusing and is not necessary. Instead, keep it all uniform for easier access and visibility.
Add Tags: Tagging your dashboards ensures you can easily organize and group them without spending extra time looking for what you are trying to find. This is crucial when your team starts creating them.
Keep Your Audience in Mind: The development team will need a detailed dashboard with less aggregation and increased diagnostics for troubleshooting purposes. Management might be interested in an aggregated dashboard that shows a high-level picture of all the services and their SLA/SLI/SLO. Ensure your dashboards are configured to help your staff with decision-making.
Setting up Kubernetes Monitoring using MetricFire
A production-level Kubernetes infrastructure can require a few hundred nodes and upwards of a few Mbps of network traffic. Therefore, you must scale out both Graphite and Grafana to handle the increasing load.
That’s where Hosted Graphite and Hosted Grafana come into the picture. It allows you to scale for long-term storage and provides redundant data storage without you having to go through the arduous process of setting up Graphite and Grafana.
Hosted Graphite and Visualizations through MetricFire allow for the continuous active deployment of new features, as MetricFire’s products all have their foundations in the ever-growing open-source projects. To easily get started with monitoring Kubernetes clusters, check out our tutorial on using the Telegraf agent as a Daemonset to forward node/pod metrics to a data source and use that data to create custom dashboards and alerts.
Sign up for the MetricFire free trial here, and start building Kubernetes dashboards within a few minutes.
Summary
This post taught us more about the best practices for monitoring Kubernetes using Grafana. You can also look at our favorite Grafana Dashboards, our article about Grafana plugins, and our Grafana Dashboard tutorial.
Book a demo and talk to us directly if you want to learn how MetricFire can help with your monitoring needs. Claim your 14-day free trial and create your own Grafana Dashboards within a few minutes of signing up.