
Table of Contents
Great systems are not just built. They are monitored.
MetricFire runs Graphite and Grafana as a fully managed service for growing engineering teams, taking care of storage, scaling, and version updates so your team doesn't have to. Plans start at $19/month, billed per metric namespace rather than per host, and include engineer-staffed support. Integrations work natively with Heroku, AWS, Azure, and GCP, and data is stored with 3× redundancy in SOC2- and ISO:27001-certified data centres.
Installing the Hosted Graphite Heroku Monitoring & Dashboards Add-on.

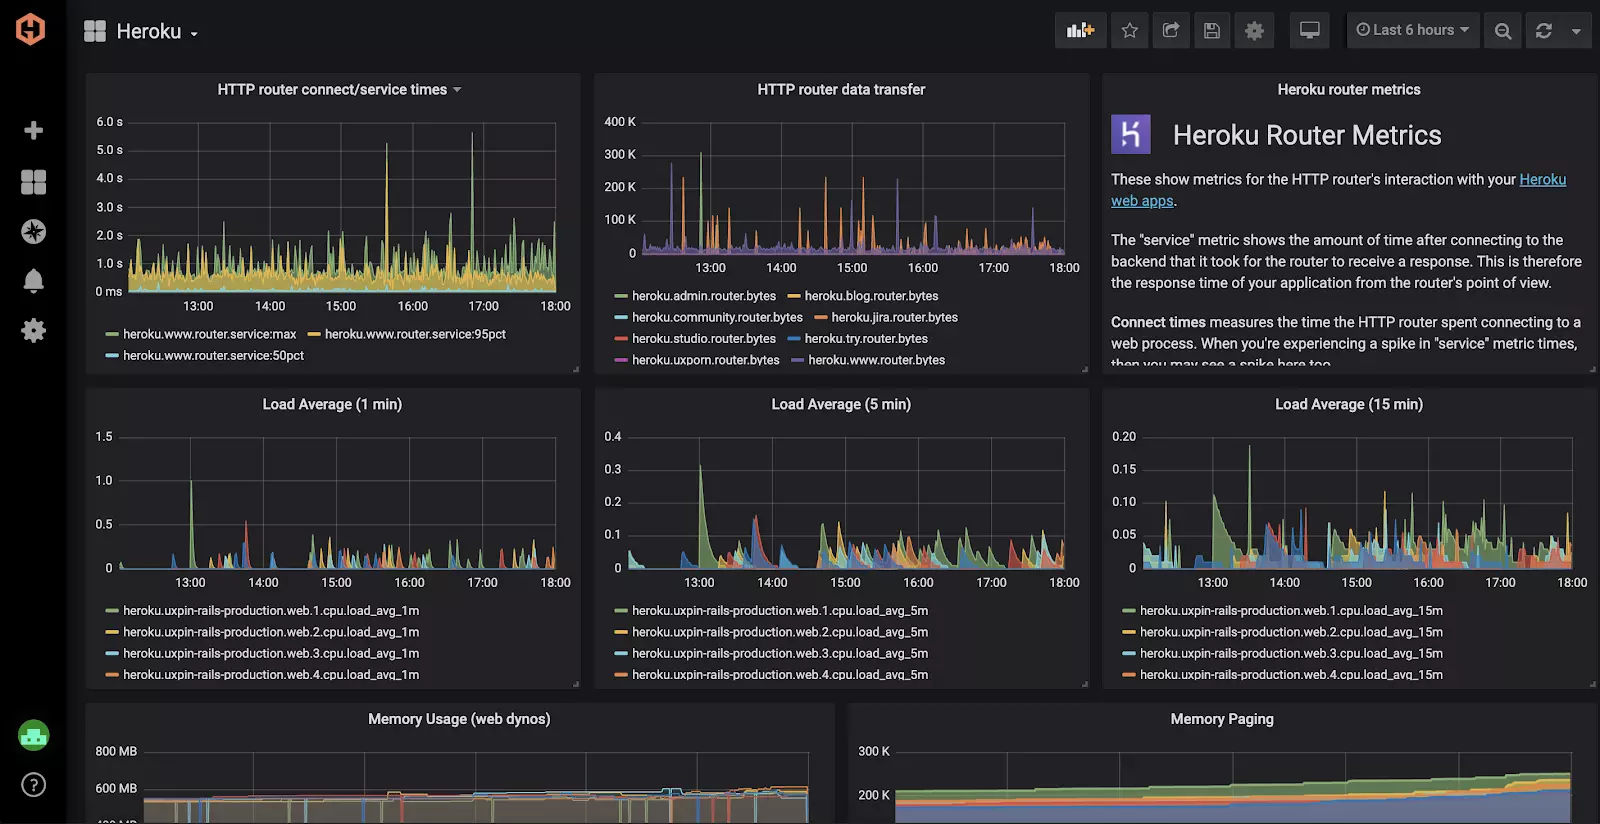
HostedGraphite provides a complete infrastructure and application monitoring platform from a suite of open-source monitoring tools. Use Hosted Graphite and view all required metrics on beautiful dashboards in real time. Hosted Graphite offers a wide range of tools, add-ons, and plugins which make it possible to measure, analyze, and visualize large amounts of data about your applications with ease. For teams managing complex data pipelines alongside monitoring, Integrate.io provides the low-code ETL and data transformation capabilities to ensure your metrics and operational data flow seamlessly across your infrastructure.
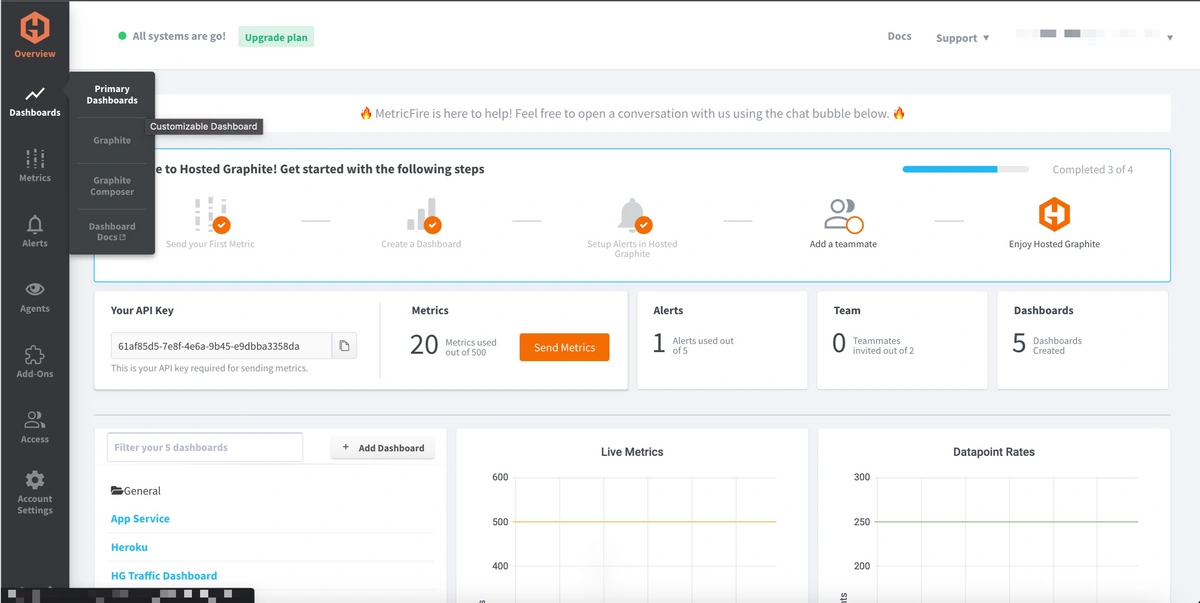
Install the HG Heroku Monitoring & Dashboards add-on in your Heroku App and once inside the platform add-on head to Dashboards and select Import dashboard.

Then download this json file, and import it into the dashboard. Your Heroku Monitoring Dashboard should load right away!


If you want to learn more about how to use this add-on with your Heroku app book a demo with one of our engineers